![]()
![]()
![]()
![]()
-- Weekly Market Update for the Week Commencing 1st February 2016
Big Picture
View
Here is a summary of our big picture
view of the markets. Note that our short-term views may differ from our
big picture view.
The BULL market in US Treasury Bonds that began in the early 1980s ended in early-2015, but there will be many years of topping action in bond prices and bottoming action in bond yields before major new trends get underway. (Last update: 29 June 2015)
The stock market, as represented by the S&P500 Index, commenced a secular BEAR market during the first quarter of 2000, where "secular bear market" is defined as a long-term downward trend in valuations (P/E ratios, etc.) and gold-denominated prices. This secular trend will bottom sometime between 2018 and 2020. (Last update: 29 June 2015)
A secular BEAR market in the US Dollar began during the final quarter of 2000 and ended in July of 2008. This secular bear market will be followed by a multi-year period of range trading. (Last update: 09 February 2009)
Gold commenced a secular bull market relative to all fiat currencies, the CRB Index, bonds and most stock market indices during 1999-2001. This secular trend will peak sometime between 2018 and 2020. (Last update: 29 June 2015)
Commodities,
as represented by the CRB Index, commenced a
secular BULL market in 2001 in nominal dollar terms. The first major
upward leg in this bull market ended during the first half of 2008, but
a long-term peak won't occur until 2018-2020.
(Last
update: 29 June 2015)
Copyright
Reminder
The commentaries that appear at TSI
may not be distributed, in full or in part, without our written permission.
In particular, please note that the posting of extracts from TSI commentaries
at other web sites or providing links to TSI commentaries at other web
sites (for example, at discussion boards) without our written permission
is prohibited.
We reserve the right to immediately
terminate the subscription of any TSI subscriber who distributes the TSI
commentaries without our written permission.
Outlook Summary
|
Market |
Short-Term (1-3 month) |
Intermediate-Term (6-18 month) |
Long-Term (2-5 Year) |
| Gold | N/A |
Bullish (26-Mar-12) |
Bullish |
| US$ (Dollar Index) | N/A |
Neutral (22-Jun-15) |
Neutral (19-Sep-07) |
| US Treasury Bonds (TLT) | N/A |
Bearish (19-Oct-15) |
Bearish |
| Stock Market (DJW) | N/A |
Bearish (30-Dec-15) |
Bearish |
| Gold Stocks (HUI) | N/A |
Bullish (23-Jun-10) |
Bullish |
| Oil | N/A |
Neutral (26-Oct-15) |
Bullish |
| Industrial Metals (GYX) | N/A |
Neutral (09-Nov-15) |
Bullish (28-Apr-14) |
4. Long-term views are determined almost completely by fundamentals and intermediate-term views
are determined by a combination of fundamentals, sentiment and technicals.
Last week's posts at the TSI Blog
How much longer will the gold-mining bear market last?
The
original Fed versus today's Fed
What do changes in GLD's bullion inventory tell us about the future gold price?
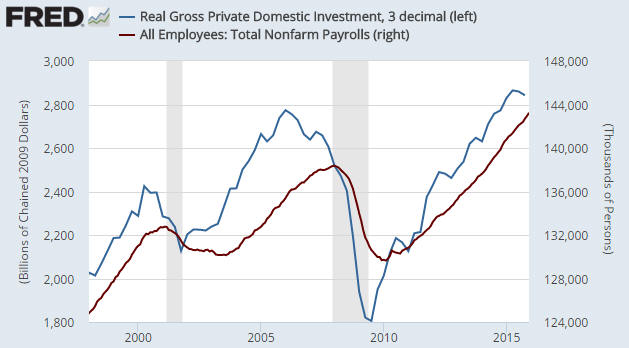
US Recession Watch
The following chart shows Real
Gross Private Domestic Investment (RGPDI) and Total Non-Farm Payrolls
(employment). Notice that RGPDI reversed downward in advance of the 2001 and
2007-2009 recessions. This is normal, as it also reversed downward in advance of
every other recession of the past 50 years. And notice that employment continued
to trend upward until after the 2001 and 2007-2009 recessions were underway.
This is also normal, in that employment is almost always still in an upward
trend at the start of a recession. Why, then, does the Fed focus on employment
as an economic indicator and why have so many commentators pointed to the strong
December-2015 employment report as evidence that the US economy is neither in
recession nor in imminent danger of entering recession? We don't know; you'd
have to ask them.
RGPDI turned down during the third quarter of last year and fell a little
further during the fourth quarter. This opens up the possibility that a
recession will soon begin (based on the historical record, if RGPDI had
continued upward there would be no chance of a short-term slide into recession),
but the reversal is not yet decisive.
The next significant piece of the puzzle will arrive on Monday 1st February. We
are referring to the latest calculation of the monthly ISM New Orders Index. A
decline in this index to below 48 will skew the odds heavily in favour of a
recession having just begun or being about to begin.
The unravelling of the
greatest boom ever
"It has fashioned itself into
an incendiary volcano of unpayable debt and wasteful, crazy-ass overinvestment
in everything. It cannot be slowed, stabilized or transitioned by edicts and new
plans from the comrades in Beijing. It is the greatest economic trainwreck in
human history barreling toward a bridgeless chasm."
The above is a colourful description of China's economic situation included in "Red
Ponzi Ticking", a recent article by David Stockman. We concur, although we
would replace the word "barreling" with "crawling". Due to centralised
government control of money, the banking industry (the quantity of bank lending,
the quality of bank lending (who gets the loans), the interest rates on deposits
and the interest rates on loans are all based on government command) and the
press (public criticism of the government risks imprisonment or worse), we
expect China's collapse to happen gradually.
Stockman's article cites a number of facts that highlight the breathtaking
extent of China's monetary-inflation-fueled boom and resultant mal-investment.
Here are some examples:
1. The PBOC expanded its balance sheet from $40 billion to $4 trillion during
the course of only two decades.
2. In the mid-1990s China had about $500 billion of public and private credit
outstanding. Today that number is $30 trillion or even more.
3. China's steel industry grew from about 70 million tons of production in the
early-1990s to 825 million tons in 2014. Moreover, annual crude steel capacity
now stands at nearly 1.2 billion tons, and nearly all of that capacity, which
amounts to about 65% of the world total, was built in the last ten years.
Evidence of the spectacular over-build is now obvious, given that 2016 steel
production is likely to be less than half of the steel industry's capacity.
4. In 1994, China produced about 1.4 million units of what were bare-bones
communist-era cars and trucks. Last year it produced more than 23 million mostly
western-style vehicles, or 16X more, and is now estimated to have annual vehicle
production capacity of around 33 million units. As is the case with the steel
industry, production in 2016 is going to be far below capacity.
5. In three recent years China used more cement than did the United States
during the entire 20th century.
6. It is estimated that there are about 70 million apartments in China that have
never been occupied.
We turned long-term bearish on China's economy in 2007, at which time it was a
very lonely position to take. It is now a much less lonely position, although we
wouldn't go as far as to say that it has become the mainstream view. The more
popular view is that although China is going through a rough patch, its
long-term prospects remain bright.
The sombre reality is that not only are China's long-term economic prospects not
bright, they are much bleaker today than when we turned long-term bearish back
in 2007. The reason is that the Keynesian stimulus measures and other policies
implemented since 2008 in an effort to keep the boom going have wasted an
extraordinary amount of wealth and dramatically magnified the imbalances. It is
therefore not possible that China's economy is experiencing only a 2-3 year
interruption to a secular up-trend. The secular trend is down.
That being said, it is certainly possible to overstate the global importance of
China's economic travails. China's economy is a mess, but China is not the
primary reason that the economies of the US and Europe are deteriorating. It's
more appropriate to view China's economic problems as a convenient -- from the
viewpoint of Western policy-makers -- excuse for the economic problems caused by
central-bank and government machinations in the West.
The Fed, the ECB, the US federal government and the governments of most European
countries have been following the same playbook as China's government and
central bank; it's just that by necessity (they don't have as much power) they
have been acting in a less draconian manner and have therefore created
relatively minor -- relative, that is, to what's happened in China -- economic
distortions and imbalances.
The point is that the local policy-induced economic distortions and imbalances
in the US and Europe would inevitably lead to severe and/or prolonged economic
weakness with or without China.
The Stock Market
The US
Current Market Situation
The risk/reward parameters are different depending on which US stock index we
consider.
For the S&P500 Index (SPX), the short-term upside potential noted in the 20th
January Interim Update remains applicable. Specifically, back then we said that
the market was sufficiently oversold to allow for a rebound that took the SPX to
either 1990 or the 50-day MA, whichever was lower.
The following chart shows that lateral resistance at 1990 is still below the
50-day MA, but the MA is declining and the two are likely cross within the
coming fortnight.
Short-term downside risk for the SPX is defined by the 20th January intra-day
low (1812). A test of this low is possible in February, but a solid/sustained
break below it probably won't happen until later in the year.
As advised in previous commentaries, a weekly SPX close below the August-2015
low (1867) is still needed to remove any remaining doubt that a bear market is
underway.
For the Dow Industrials Index, short-term upside potential is probably limited
by the declining 50-day MA, which is currently just above 17000.
The Dow hasn't yet traded below its August-2015 low, having reversed upward from
slightly above this critical level on 20th January. The August-2015 low (15370)
should therefore limit the downside until after the recent oversold extreme has
been fully worked off.
Unlike the SPX and the Dow Industrials, the Dow Transportation Average (TRAN)
has left no doubt that a bear market is in progress. In TRAN's case, the price
decline of the past two months was so severe that the August-2015 bottom now
defines the short-term upside potential. In other words, the best that TRAN is
likely to do over the next few weeks is return to the vicinity of its
August-2015 low near 7400.
As is the case with the other indices, short-term downside risk is defined by
the 20th January intra-day low (6403).

In last week's Interim Update we cautioned against being in a hurry to establish
new bearish speculations. Due to the sizable gains made by the stock indices
over the final two days of the week the risk/reward for a new bearish position
-- in the form of either put options or inverse ETFs* -- has improved, although,
as noted above, the indices are probably not going to do any worse during the
weeks immediately ahead than test their January lows.
The current plan with regard to our own money management is to stay out of put
options on the US stock indices until the SPX gets close to its 50-day MA.
Getting close to the 50-day MA will possibly take a few weeks.
*We much prefer put options to inverse ETFs or bear funds,
but many other traders prefer the ETFs and mutual funds. When attempting to
profit from a trend, stick with the method you are most comfortable with as long
as it works for you.
Oil and the Stock
Market
At the beginning of last year there was a lot of chatter about how the decline
in the oil price was going to boost the US economy by freeing-up money to fund
consumption of non-oil-based products. It would work like a tax cut, we were
told. However, the following chart shows that over the past 12 months the SPX
and the oil price have tended to move up and down together, which superficially
suggests that a rising oil price has come to be viewed as an economic plus and a
falling oil price has come to be viewed as an economic minus.
What's actually happening, we think, isn't that a falling oil price has gone
from being perceived as an economic stimulant to being perceived as an economic
depressant, it's that both the stock market and the oil market are responding
similarly to changes in global growth expectations. When speculators, as a
group, become less optimistic about global economic growth, they sell oil and
equities. And when speculators become more optimistic about global economic
growth, they buy oil and equities.
We think that the positive correlation between oil and equities will persist,
although oil is probably a lot closer than the SPX to its ultimate price bottom.
In fact, the scenario we favour involves the SPX dropping well below its Q1 low
later this year while the oil price does no worse than test its Q1 low.
The Emerging Markets
The Emerging Markets Equity ETF (EEM) has rebounded along with everything else
in the equity world since 20th January. And like almost everything else in the
equity world it will probably make some additional gains, or at least spend some
more time working off its 'oversold' extreme, before commencing a decline to
well below its January low.
However, the short-term risk/reward looks more bearish for EEM than for the US
stock indices. The reason, as outlined in previous commentaries, is the
potential for EEM to suffer a rapid price decline that would bring it into line
with industrial commodities.
Due to the risk that EEM will suffer a large and fast decline within the next
couple of months, we are presently keener to establish a new bearish EEM
position than to open a new bet against any of the US stock indices. We might
therefore start averaging back into the June-2016 $25 EEM put options if EEM
moves up to resistance at $31-$32 this week. An alternative, for those who want
to speculate and aren't comfortable with options, would be to buy the ProShares
UltraShort Emerging Markets Fund (EEV) if it drops to around $24 this week. Keep
in mind, though, that losses on any leveraged ETF positions should be kept in
check via the use of 'stops' or another risk management technique.
This week's
significant US economic events
[Notes:
1) The most important events
(to the markets) are shown
in bold. 2) A list of global economic events can be found
HERE]
| Date | Description |
| Monday Feb 01 |
Personal Income and Spending ISM Mfg Index Construction Spending |
| Tuesday Feb 02 | Motor Vehicle Sales |
| Wednesday Feb 03 | ISM Non-Mfg Index |
| Thursday Feb 04 |
Q4 Productivity and Costs Factory Orders |
| Friday Feb 05 |
Monthly Employment Report International Trade Balance Consumer Credit |
Gold and the Dollar