![]()
![]()
![]()
![]()
-- Weekly Market Update for 1st July 2019
Big Picture
View
Here is a summary of our big picture
view of the markets. Note that our short-term views may differ from our
big picture view.
The BULL market in US Treasury Bonds that began in the early 1980s ended in mid-2016, but there will be many years of topping action in bond prices and bottoming action in bond yields before major new trends get underway. A major decline in government bond prices will unfold during the 2020s. (Last update: 11 September 2017)
The stock market, as represented by the S&P500 Index, commenced a secular BEAR market during the first quarter of 2000, where "secular bear market" is defined as a long-term downward trend in valuations (P/E ratios, etc.), gold-denominated prices and inflation-adjusted prices. This secular trend will bottom in 2020 or later. (Last update: 11 September 2017)
A cyclical BEAR market in the US Dollar began in 2016-2017. (Last update: 11 September 2017)
Gold commenced a secular bull market relative to all fiat currencies, the CRB Index, bonds and most stock market indices during 1999-2001. This secular trend will peak in 2020 or later. (Last update: 11 September 2017)
Commodities,
as represented by the CRB Index, commenced a
secular BULL market in 2001 in nominal dollar terms. The first major
upward leg in this bull market ended during the first half of 2008, but
a long-term peak won't occur until 2020 or later.
(Last
update: 11 September 2017)
Copyright
Reminder
The commentaries that appear at TSI
may not be distributed, in full or in part, without our written permission.
In particular, please note that the posting of extracts from TSI commentaries
at other web sites or providing links to TSI commentaries at other web
sites (for example, at discussion boards) without our written permission
is prohibited.
We reserve the right to immediately
terminate the subscription of any TSI subscriber who distributes the TSI
commentaries without our written permission.
True
Fundamentals Summary
[Notes:
1) The date shown next to the current True Fundamentals Model (TFM) signal is
when the most recent change occurred. 2) Charts of the Gold and Equity
TFMs are included in the "Charts and Indicators" section of the TSI web
site]
| Market | True Fundamentals Model (TFM) |
| Gold (US$ Price) | Bullish (04 Jan 2019) |
| US Equity (SPX) | Bearish (19 Apr 2019) |
| Currency (Dollar Index) | Neutral (15 Mar 2019) |
| Commodities (GNX) | Bearish (01 Jun 2018) |
Last week's posts at the TSI Blog
US monetary inflation with and without the Fed
Summary of current
thinking/positioning
1) The Dollar Index (DX) has
commenced a downward trend, but it could be a few months before the new
trend becomes consistent. In the meantime the price action could be
choppy, beginning with a counter-trend rebound that kicks off within the
next week or so.
2) The US$ gold price has broken out to the upside
on a monthly basis. Significant additional gains are likely within the
next three months, but a test of the recent upside breakout probably will
occur within the next three weeks (possibly following a spike to a new
multi-year high this week). The US$ silver price stands a good chance of
making a catch-up move over the months ahead.
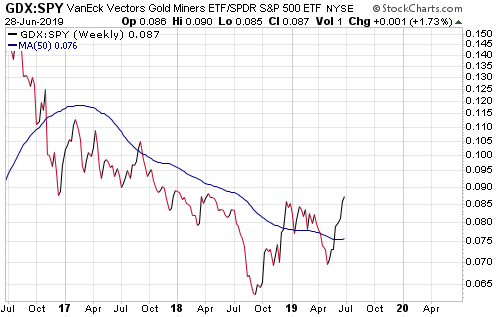
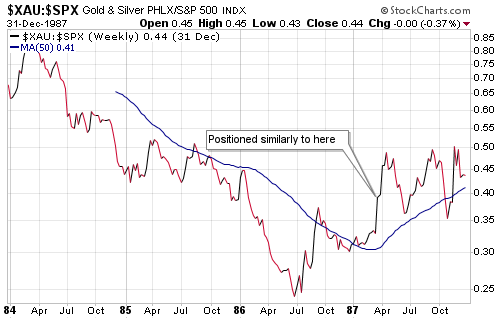
3) Although they are
a long way from following gold bullion to new 5-year highs, on a
short-term basis the gold-mining indices/ETFs are in similar positions to
gold. They are extremely 'overbought' and should soon enter -- if they
haven't already entered -- correction mode.
4) The SPX probably
will commence a sizable multi-week decline by mid-July at the latest.
5) An upside blow-off has set the stage for a large T-Bond decline.
The decline should begin very soon, but it could be September-October
before the market starts trending downward with conviction.
6)
Oil's correction is probably over, although there is still a risk that
stock market weakness during July-August could push the oil price to a new
multi-month low.
7) We are holding a cash reserve of 25%-30%.
No Interim Update
this week
Please note that we will be
taking a short break and as a result there will be no Interim Update this
week. The next report will be the Weekly Update scheduled for Sunday 7th
July.
The Monthly
Closing Prices
At around this time every month
we review some of the most important (from our perspective) monthly
charts. We do this because monthly closing prices can confirm or deny
intermediate-term trend changes.
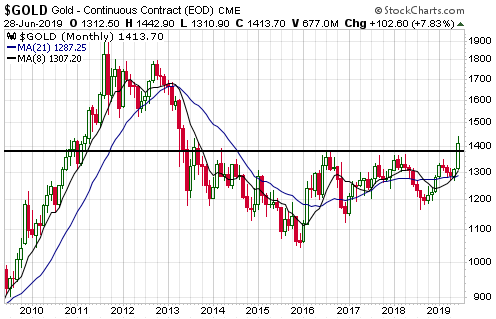
We'll start with the US$ gold
price. A month ago we wrote:
"For two reasons, gold's position
on the monthly chart became even more bullish in May. The first reason is
that gold traded below its 21-month and 8-month MAs during the month
before recovering enough to end the month comfortably above both MAs. The
second and more significant reason is that the 8-month MA has just crossed
from below to above the 21-month MA."
And:
"During
long-term gold bear markets, the 8-month MA crossing from below to above
the 21-month MA tends to be followed by either a rapid 1-2 month price
rise or a long-and-slow (two steps forward followed by one step backward)
upward trend. In the current case the latter scenario appears to be more
likely.
Regardless of whether we get a 1-2 month surge or a steady
1-2 year upward trend, the rising 8-month MA is now an important support
level on a monthly closing basis. To maintain its bullish posture the US$
gold price must not end a month below this MA."
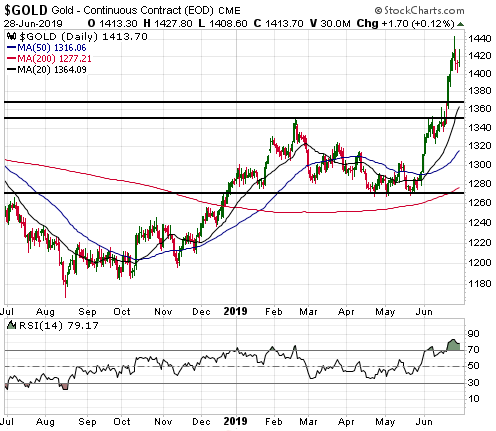
Gold gained
more than US$100/oz during the month of June, which suggests that of the
two scenarios mentioned above we more likely are dealing with the 1-2
month surge. However, by ending the month above its highs of the past few
years the US$ gold price has achieved a breakout that points to
significant additional gains over several months (potentially more than a
year). This breakout should be respected.
The 8-month MA is way
down at $1307. This is too far below the current price to be a useful
demarcation level, but it is beginning to accelerate upward and could
become useful within the next few months. In the meantime, the
February-2019 high ($1350) should be viewed as critical monthly-closing
support.
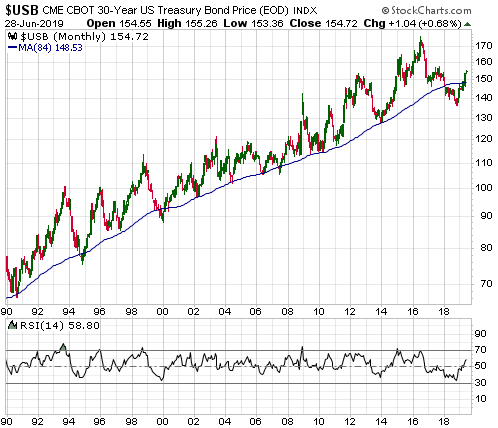
The T-Bond performed better than expected during June. Over the course
of the month it gained only 1 point, but in doing so it remained above its
84-month MA. This means that the 84-month MA is not acting as resistance
the way we thought it would, but doesn't alter our view that the T-Bond
commenced a bear market in 2016.
A substantial T-Bond decline is
coming, but the market could spend 2-3 more months in a topping process
before beginning to trend downward with conviction.
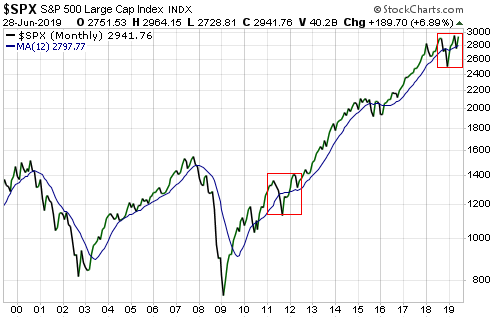
When the S&P500 Index (SPX) ended the month of October-2018 below its
12-month MA it signaled that either an intermediate-term correction or a
bear market had begun. When it subsequently recovered from its Q4-2018
plunge to end the month of February-2019 above its 12-month MA, the
intermediate-term correction scenario was confirmed.
At this
stage, the price action during the period since last September looks
similar to the price action that followed the intermediate-term top in
2011. The similar periods are indicated by the red boxes drawn on the
monthly chart displayed below.
The bull market appears to be
intact, but we aren't assuming that the similarities between the present
and 2011-2012 will continue. On the contrary, we are anticipating
significant additional weakness prior to a sustained move into new high
territory.
The Treasury
Market
A sentiment extreme
The following two charts from Sentimentrader.com make the case that
sentiment in the T-Bond market is at/near an optimistic extreme. The first
chart shows that the Optimism Index for bonds is 180 degrees from where it
was last October (it has gone from a 3-year low to near a 3-year high).
The second chart shows that small traders of T-Bond and T-Note futures are
now as bullish as they have been at any time over the past 17 years.
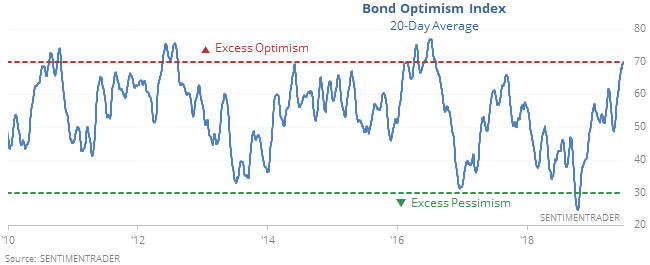
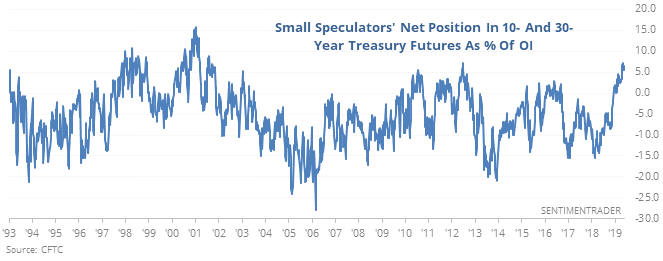
A major sentiment extreme is a necessary, but not a sufficient,
precondition for a major price extreme. For example, a market sometimes
will continue to trend upward for an extended period, with only routine
corrections along the way, while sentiment within the speculating
community remains very optimistic. However, when speculators are very
optimistic the market will be acutely vulnerable to a perceived adverse
change in the fundamental backdrop.
The current sentiment
situation suggests that it won't take much of a perception change to bring
about a large price decline in the bond market.
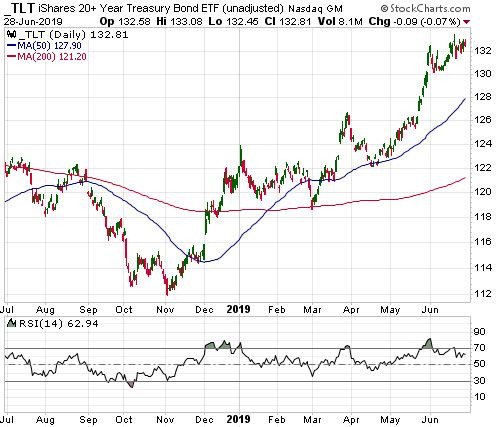
A potential
topping pattern
The upward trend in the iShares 20+ Year
Treasury Bond ETF (TLT) lost momentum over the past month, but a downward
reversal is yet to occur. A daily close below $130 would signal a
reversal.
Based on what we expect to happen in other markets it
could be 2-3 months before TLT begins to trend downward in earnest. The
main reason is that stock market weakness within the next two months could
lead to an increase in demand for the temporary safety offered by the
Treasury market.
One plausible scenario is that a topping pattern
involving a pullback to the 50-day MA followed by a rebound to test the
high will precede the start of a substantial decline.
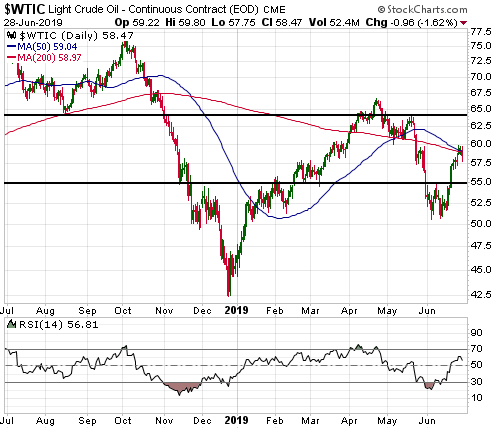
The Oil Market
The following daily chart shows that moving-average resistance at $59-$60
limited the upside in the oil price last week. This was expected and
doesn't provide any useful clues about future performance. Having said
that, over the past week the probability increased that oil's correction
is over. The reason is associated with market sentiment.
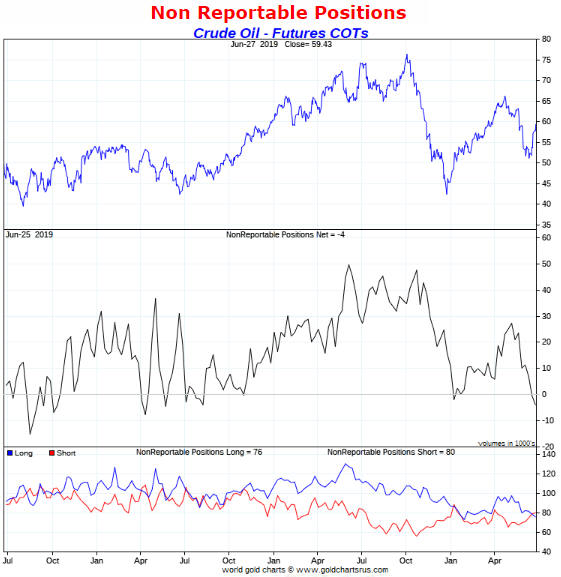
As is the case with the Treasury market, there currently is a
noteworthy sentiment extreme in the oil market. But whereas small traders
(the 'dumb money') are uncommonly optimistic about the prices of T-Bonds
and T-Notes, they are uncommonly pessimistic about the oil price. This is
evidenced by the following weekly chart, the middle section of which shows
that "NonReportable" traders of oil futures have their smallest net-long
exposure in almost two years. This means that the 'dumb money' is
positioned more bearishly now than it was when the oil price was bottoming
6 months ago.
Such negativity on the part of small traders in the
face of fairly normal price action suggests that the June low was the
final correction low.
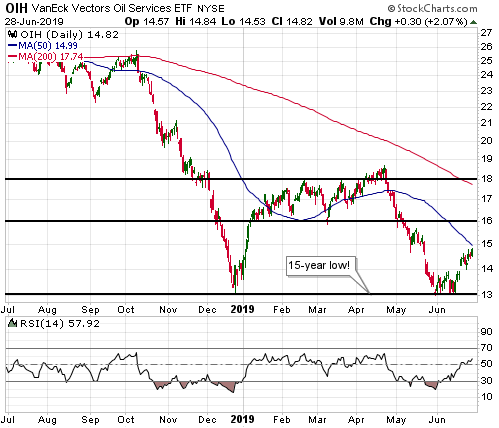
Before leaving oil-related matters it's worth mentioning that the Oil
Services ETF (OIH) has rebounded to near its 50-day MA following a
successful re-test of its 15-year low. This ETF's intermediate-term
downside risk is dwarfed by its upside potential.
The Stock Market
From last week's Interim Update:
"The meeting at the end of this week between presidents Trump and
Xi constitutes a near-term risk for bearish stock market speculators. This
is because although the meeting almost certainly won't result in a deal
that brings the overall US-China conflict to an end, it probably will
result in positive statements and the temporary removal of the US threat
to impose tariffs on the roughly $300B of Chinese products that currently
aren't subject to tariffs.
Therefore, a reasonable trading plan
would involve entering a short-term bearish speculation now with the
intention of adding to the position if next week's market reaction to the
Trump-Xi meeting pushes the SPX up to near its all-time high or to a
marginal new all-time high. Risk could then be managed by setting an
initial 'stop' slightly above whatever high is in place by mid-July."
The outcome of the Trump-Xi meeting was as expected. Positive
statements have been issued and the US government threat to impose new
tariffs on $300B of Chinese products has been temporarily removed. In
addition, Trump has promised to allow US companies to resume selling their
wares to Huawei. This is a significant plus for US chipmakers such as
Intel and Micron. It is also a significant plus for some US software
companies, including Google.
Although the meeting outcome appears
to be in line with what most market participants were expecting, the
removal of a near-term source of uncertainty could give sentiment a
sufficient boost to push the senior US stock indices to new all-time highs
this week. As mentioned in last week's Interim Update, if this happens it
would be an opportunity to establish or add to short-term bearish
speculations, with risk then managed by placing an initial 'stop' slightly
above whatever high is in place by mid-July. An alternative and more
conservative tactic would be to wait for a downward reversal before
entering or adding to a bearish speculation. For example, if the SPX were
to close at a new all-time high (above 2964) early this week, then a
subsequent daily close below 2940 could be viewed as a reversal signal.
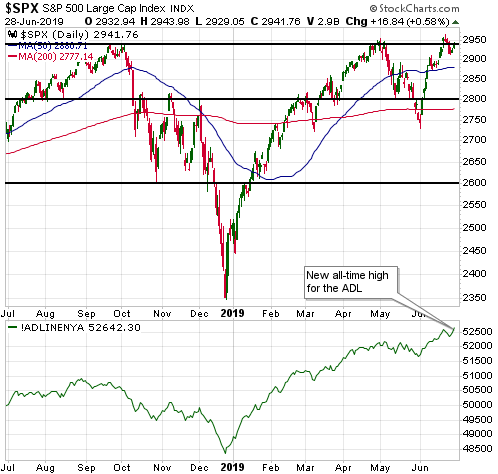
With regard to the short-term price action, during the second half of
last week the US stock market clearly was factoring in the temporary
cessation of US-China hostilities on the trade front. The associated
optimism pushed the SPX up to within 1% of its all-time high and pushed
the NYSE Advance-Decline Line (ADL) to a new all-time high. The on-going
strength of the ADL is a good reason to NOT expect anything more bearish
within the coming two months than a steep multi-week decline.
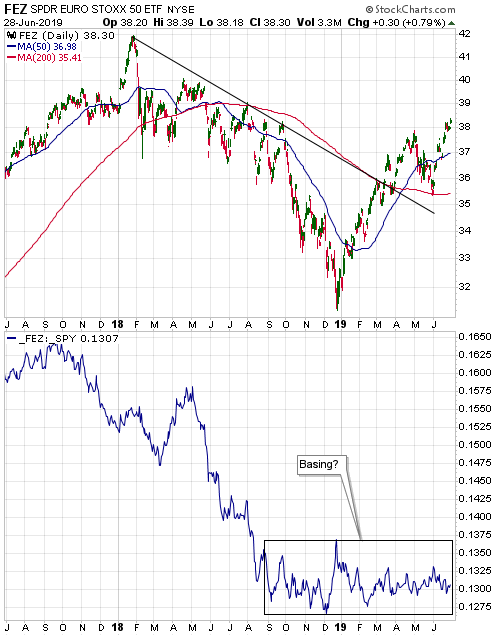
Turning to Europe, the top section of the following daily chart shows
that the EURO STOXX 50 ETF (FEZ) made a new high for the year last week
but remains well below its 2018 high. The bottom section of the chart
shows that FEZ stopped falling relative to the S&P500 ETF (SPY) late last
year.
FEZ/SPY essentially has moved sideways for about 10 months.
If this is a basing pattern (we think it is) then it will have bullish
implications for the euro relative to the US$, but if it is a mid-trend
consolidation then it will limit the euro's strength relative to the US$.
To explain, the euro/US$ exchange rate, and therefore the Dollar
Index, is driven by relative interest rates and relative stock-market
performance. At the moment, the relative interest-rate trend favours the
euro, but the relative stock-market performance trend is still slightly in
the US$'s favour. The net effect is a fundamental backdrop that could be
viewed as favouring the euro, but not decisively so.
To get a
substantial rally in the euro and decline in the DX it's necessary, we
think, for the long period of sideways movement in FEZ/SPY to be a
reversal pattern (a base) as opposed to a continuation pattern.
This week's
significant US economic events
[Notes:
1) The most important events
(to the markets) are shown
in bold. 2) A list of global economic events can be found
HERE]
| Date | Description |
| Monday Jul-01 |
ISM Mfg Index Construction Spending |
| Tuesday Jul-02 | Motor Vehicle Sales |
| Wednesday Jul-03 |
ISM Non-Mfg Index International Trade Balance Factory Orders |
| Thursday Jul-04 | US markets closed for public holiday |
| Friday Jul-05 | Monthly Employment Report |
Gold and the Dollar
The Currency Market
During the week before
last the DX broke out to the downside. Last week it traded within a very
narrow range and achieved no net change, thus consolidating the previous
week's breakout.
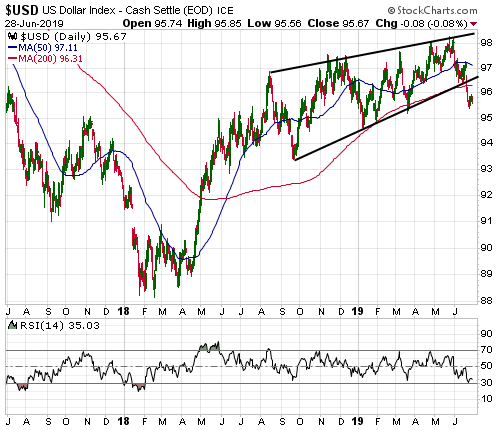
The fundamental backdrop remains neutral, but, as discussed in the
stock market section of today's report, fundamental downward pressure on
the DX will ramp up if it turns out that the many months of sideways
movement in the FEZ/SPY ratio is a basing pattern.
Aside from the
potential for the true fundamental currency-market drivers to move further
in the euro's favour, a reason to believe that the DX is in the early part
of an intermediate-term decline is the performance of the gold market.
Gold's recent upside breakout was not only a reaction to a downside
breakout in the DX, it was also a prediction of additional US$ weakness to
come. This is because gold has broken out in nominal currency terms, but
not in terms of the S&P500 Index or the GSCI Spot Commodity Index. The
implication is that at this time gold appears to be anticipating currency
weakness more than economic weakness.
Updates
on Stock Selections
Notes: 1) To review the complete list of current TSI stock selections, logon at
http://www.speculative-investor.com/new/market_logon.asp
and then click on "Stock Selections" in the menu. When at the Stock
Selections page, click on a stock's symbol to bring-up an archive of
our comments on the stock in question. 2) The Small Stock Watch List is
located at http://www.speculative-investor.com/new/smallstockwatch.html
![]() Company
news/developments for the week ending Friday 28th June 2019:
Company
news/developments for the week ending Friday 28th June 2019:
[Note: AISC = All-In Sustaining Cost, EBITDA = Earnings Before
Interest, Tax, Depreciation and Amortisation (a measure of cash flow), EV
= Enterprise Value or Electric Vehicle, FS = Feasibility Study, FY =
Financial Year, IRR = Internal Rate of Return, ISR = In-Situ Recovery, JV
= Joint Venture, MD&A = Management Discussion and Analysis, M&I = Measured
and Indicated, NAV = Net Asset Value, NPV(X%) = Net Present Value using a
discount rate of X%, NSR = Net Smelter Return or Net Smelter Royalty, P&P
= Proven and Probable, PEA = Preliminary Economic Assessment, PFS =
Pre-Feasibility Study]
*Africa Oil (AOI.TO)
advised that the Heads of Terms agreement between the Government of Kenya
and joint venture partners Africa Oil (25%), Tullow Oil (50%) and TOTAL
(25%) has been signed for the development of the oil fields in the South
Lokichar Basin. This means that key fiscal and commercial principles for
Project Oil Kenya have been agreed and documented between the government
and the JV partners. AOI also advised that the project's Front End
Engineering and Design (FEED) studies are complete.
However, the
Environmental and Social Impact Assessments are taking longer than
expected, so a Final Investment Decision (FID), which was expected to
happen late this year, has been pushed into 2020. The plan is that it will
take three years from FID to initial oil production.
In addition,
AOI reported that significant progress has been made on South Lokichar's
Early Oil Production Scheme (EOPS) -- a pilot test of the planned
production methods. EOPS production has been ramped up to 2,000 bopd and
the reservoirs, wells and associated facilities have been performing as
expected. The oil is being delivered to Mombasa for shipment.
*Continental Gold (CNL.TO) announced that Eric Sprott has
invested US$25M in the company at C$3.10/share. This appears to be an
unnecessary financing that was done mainly for promotional purposes -- to
show the market that Eric Sprott is optimistic about CNL's prospects.
CNL's Buritica project is host to what appears to be an outstanding
gold deposit, but as we saw last year there are security risks associated
with building a mine in Colombia. When these risks materialised during the
final few months of last year in the form of employee deaths due to
attacks by terrorists, the stock was clobbered. We thought at the time
that if the project stayed on track and there were no new problems on the
security front then the market's perception of the company would improve
and the stock would get an upward re-rating. That has happened, but the
security risk has not disappeared.
Depending on exposure to this
stock and the overall gold-mining sector, it could make sense to do some
selling of CNL shares in the C$3.80-$4.00 range, that is, near the current
price. It comes down to personal money management considerations and risk
tolerance, because the stock still offers reasonable value.
We will
be looking for an opportunity to remove CNL from the TSI Stocks List over
the next few months and possibly would view a rise in the stock price to
around C$5.00 as such an opportunity.
*eCobalt
Solutions (ECS.V) continues to trade at a large discount to the
implied value of the Jervois Mining (JRV.AX, JRV.V) takeover bid. Based on
last Friday's closing price of JRV shares in Australia and the current
A$/C$ exchange rate, the JRV bid is worth about C$0.32/share. However, ECS
shares currently are priced at only C$0.22-$0.23.
*Energold
Drilling (EGD.V) advised that due to insufficient working capital
it has defaulted on payment obligations and covenants associated with its
debt. The main component of its debt is C$20M of convertible debentures
issued in 2017.
We didn't see this coming. It was clear that the
company had a cash shortage, but the shortage didn't appear to be a
near-term threat to the company's survival. Given that it was/is a
near-term life-threatening matter, we wonder why the company's management
didn't do an equity financing months ago. A low-priced equity financing
would have diluted the per-share value, but that's a lot better than going
broke.
To get itself out of the current financial predicament EGD
will have to issue a lot of new shares and also bring the conversion price
of the existing debentures down to near the market price (the current
conversion price is C$0.85). Also, the company will be engaging a "chief
restructuring officer" to manage the financial-restoration process.
Will EGD recover?
The company probably will recover, especially
with the gold price having broken out to the upside and the prices of
other metals likely to follow in due course (higher metal prices should
lead to improved sales and profits in the mineral-drilling side of the
business). However, it won't be possible to reassess the risk/reward for
the shares until the details of the financial restructuring are known. In
particular, the post-restructuring fully-diluted share count will have to
be known.
Due to the current unknowns, the small-but-significant
risk of bankruptcy and the likelihood that massive equity dilution is
coming, we view EGD as no better than a hold at its current price of
C$0.09 and would be inclined to lighten-up in the C$0.12-$0.15 range.
In general, drilling has been a very tough business to be in over the
past few years. The shrinkage of profit margins in both minerals drilling
and energy drilling has been out of proportion to changes in the
underlying commodity prices, such that even large and well-financed
companies have struggled. This creates the potential for a huge recovery
over the next few years in the stock prices of the drilling companies that
survive without blowing out their share counts. We made the bet that EGD
would be one of these companies, but this proved to be the wrong bet.
We still very much like the idea of having exposure to the coming
recovery in the profitability of commodity-related drilling. For
energy-related drilling exposure we prefer the Oil Services ETF (OIH),
because we don't have the time or inclination to analyse individual
companies in detail. For minerals-related drilling exposure we like Major
Drilling (MDI.TO), which we discussed in the 19th June 2019 Interim
Update.
*Premier Gold (PG.TO) had positive
and negative news last week.
On the plus side, the company reported
that development of the El Nino underground and Phase 1 open pit mines at
the South Arturo project in Nevada (40% PG, 60% Barrick) is on or ahead of
schedule. El Nino is expected to be in production before the end of this
year and Phase 1 is expected to be put into production next year.
On the minus side, about two months ago the company reported the discovery
of high-grade gold mineralization in a Reverse Circulation (RC) hole
drilled at the McCoy-Cove project's Antenna target (McCoy-Cove is another
PG-Barrick JV). The discovery hole contained a 118.9m intercept grading
4.12 g/t gold. That was very good news, but it was reported last week that
a core hole drilled to 'twin' the RC hole intersected a mineralized zone
that was significantly narrower than the RC hole. The JV is now figuring
out the best way to evaluate the Antenna target.
![]() List
of candidates for new buying
List
of candidates for new buying
From within the ranks of TSI
stock selections the best candidates for new buying at this time, listed
in alphabetical order, are:
1) A40.AX (last Friday's closing price:
A$0.14)
2) CGT.TO (last Friday's closing price: C$0.18)
3)
ECS.V (last Friday's closing price: C$0.22)
4) PG.TO below C$1.90
(last Friday's closing price: C$2.04)
5) PPLT (last Friday's
closing price: US$78.86)
The above list is limited to five stocks.
It sometimes will contain less than five, but it never will contain more
than five regardless of how many stocks are attractively priced for new
buying.
Chart Sources
Charts appearing in today's commentary
are courtesy of:
https://stockcharts.com/
https://sentimentrader.com/
http://www.goldchartsrus.com/