|
-- Weekly Market Update for the Week Commencing 1st August 2011
Big Picture
View
Here is a summary of our big picture
view of the markets. Note that our short-term views may differ from our
big picture view.
In nominal dollar terms, the BULL market in US Treasury Bonds
that began in the early 1980s ended in December of 2008. In real (gold)
terms, bonds commenced a secular BEAR market in 2001 that will continue
until 2014-2020. (Last
update: 4 April 2011)
The stock market, as represented by the S&P500 Index, commenced
a secular BEAR market during the first quarter of 2000, where "secular
bear market" is defined as a long-term downward trend in valuations
(P/E ratios, etc.) and gold-denominated prices. This secular trend will bottom sometime between 2014 and 2020. (Last update: 22 October 2007)
A secular BEAR market in the Dollar
began during the final quarter of 2000 and ended in July of 2008. This
secular bear market will be followed by a multi-year period of range
trading. (Last
update: 09 February 2009)
Gold commenced a
secular bull market relative to all fiat currencies, the CRB Index,
bonds and most stock market indices during 1999-2001. This secular trend will peak sometime between 2014 and 2020. (Last update: 22 October 2007)
Commodities,
as represented by the Continuous Commodity Index (CCI), commenced a
secular BULL market in 2001 in nominal dollar terms. The first major
upward leg in this bull market ended during the first half of 2008, but
a long-term peak won't occur until 2014-2020. In real (gold) terms,
commodities commenced a secular BEAR market in 2001 that will continue
until 2014-2020. (Last
update: 09 February 2009)
Copyright
Reminder
The commentaries that appear at TSI
may not be distributed, in full or in part, without our written permission.
In particular, please note that the posting of extracts from TSI commentaries
at other web sites or providing links to TSI commentaries at other web
sites (for example, at discussion boards) without our written permission
is prohibited.
We reserve the right to immediately
terminate the subscription of any TSI subscriber who distributes the TSI
commentaries without our written permission.
Outlook Summary
Market
|
Short-Term
(0-3 month)
|
Intermediate-Term
(3-12 month)
|
Long-Term
(1-5 Year)
|
| Gold
|
Neutral
(19-Apr-11)
|
Neutral
(24-Jan-11)
|
Bullish
|
| US$ (Dollar Index)
|
Bullish
(13-Jul-11) | Bullish
(02-May-11)
|
Neutral
(19-Sep-07)
|
| Bonds (US T-Bond)
|
Neutral
(20-Sep-10)
|
Neutral
(01-Aug-11)
|
Bearish
|
| Stock Market (S&P500)
|
Bearish
(04-Jul-11)
|
Bearish
(11-Oct-10)
|
Bearish
|
| Gold Stocks
(HUI)
|
Neutral
(13-Jul-11)
|
Bullish
(23-Jun-10)
|
Bullish
|
| Oil | Neutral
(31-Jan-11)
| Neutral
(31-Jan-11)
| Bullish
|
| Industrial Metals
(GYX)
| Bearish
(03-Jan-11)
| Bearish
(25-May-09)
| Neutral
(11-Jan-10)
|
Notes:
1. In those cases where we have been able to identify the commentary in
which the most recent outlook change occurred we've put the date of the
commentary below the current outlook.
2. "Neutral", in the above table, means that we either don't have a
firm opinion or that we think risk and reward are roughly in balance with respect to the timeframe in question.
3. Long-term views are determined almost completely by fundamentals,
intermediate-term views by giving an approximately equal weighting to
fundamental and technical factors, and short-term views almost
completely by technicals.
Moving to Malaysia
In two weeks time my family (wife + 11-year-old son) and I will be relocating from Shanghai to
Kota Kinabalu (KK) in Malaysian Borneo. The main reason for the move is that while we've enjoyed our 5 years in Shanghai, over the past year the negatives of living in this massive city have begun to outweigh the positives.
Air pollution is the biggest Shanghai negative, especially when you have the health of a child to consider. The climate is also a negative. Compared to what people in much of Canada and northern Europe have to put up with, Shanghai winters are mild. To me, however, the period from mid-December through to mid-March is miserably cold.
Lifestyle is another consideration. If you want all the benefits and conveniences that Shanghai has to offer then you have to live in a densely populated part of the city, where the pace of daily life is frenetic. Initially this wasn't a problem, but over the past year or so it has started to weigh on us. From my perspective, an additional lifestyle negative is the lack of ready access to good beaches.
It's also worth noting that one of the reasons that my wife and I originally moved to China was so that our son would become a fluent Mandarin speaker. Mission accomplished.
We've chosen to move to KK because it offers clean air, tropical heat all year round, a relaxed lifestyle and ready access to many excellent beaches. At the same time, it is big enough to have most of the conveniences of a modern city, including shopping malls, international schools, an extensive range of restaurants and sporting facilities, hotels, and an international airport (KK is about 2 hours by plane from Kuala Lumpur, Singapore and Hong Kong). Its population is currently around 500K, but it is growing quickly. Hopefully it won't grow too quickly.
There are other small cities in South-East Asia that offer similar advantages to KK in terms of lifestyle, but picking a location in Malaysia makes sense for the following reasons:
First, the Malaysian government makes it relatively easy for foreigners to relocate to Malaysia, provided that the foreigners can support themselves financially. To be more specific, the Malaysian government offers 10-year renewable residency visas under the
"Malaysia My Second Home Program". To qualify for such a visa, the main requirements are to deposit the Ringgit equivalent of US$50K-$100K (the actual amount depends on your age) in a Malaysian bank and prove that you have monthly income of at least 10,000 Ringgit (about US$3,400).
Second, foreigners can easily purchase residential property in Malaysia.
Talking about residential property, KK appears to be in the midst of a mini property bubble. Houses and apartments in KK are dirt cheap compared to Shanghai, but that's not saying much (property almost everywhere is cheap compared to Shanghai). Actually, it's not that KK property is expensive compared to property in most places, it's just that property prices in KK have gone up a lot over the past several years and are now very high relative to the associated rents. In other words, rental yields are now very low. As a result, from a purely economic perspective it would make more sense to rent than to buy.
However, some decisions aren't solely based on economics. There's definitely something to be said for living in a house that you own, so we've bought a house in KK. It's a terrace house built in the middle of a golf course at
Sutera Harbour, which is about 5 minutes drive from the centre of town.
The house is currently under construction and won't be complete until early next year. This, unfortunately, means that we will be moving three times over the next 9 months. In mid August we'll be moving from Shanghai to a hotel in KK, where we'll stay for two weeks while we look for a place to rent. We'll then move to the rental accommodation while we wait for the house to be finished, after which we'll shift into our permanent abode.
We apologise, in advance, if the shifting around over the next month disrupts the flow of TSI commentaries.
Is the US$ in danger of
losing its reserve currency status?
A week seldom goes by without us reading somewhere that the US dollar is in danger of losing its reserve currency status. We are now going to argue that the US$ is actually in no such danger, because it can't lose what it doesn't have.
The US$ became the official "reserve currency" in 1944 as a result of the Bretton Woods agreement. Under this agreement, all the major currencies of the world were to have fixed rates of exchange against the US dollar. The idea was that participants in the Bretton Woods system would intervene in the foreign exchange market -- buying/selling their own currency or US$ reserves -- to keep the actual rate of exchange within 1% of the stipulated rate. For its part, the US agreed to make the dollar convertible into gold at the fixed rate of $35/ounce, although the conversion facility was only available to central banks and governments.
With all the major currencies pegged to the US$ it made sense for most international trade to be conducted in dollars and for commodity prices to be quoted in dollars throughout the world.
In summary, the Bretton Woods agreement established a system of payments based on the US$, with all currencies defined in terms of the dollar and with the dollar defined in terms of gold. Under this system the US$ was the world's reserve currency, but gold was the ultimate monetary anchor.
For reasons that we won't regurgitate at this time, the Bretton Woods system was abandoned in the early 1970s in two stages. First, the US government "closed the gold window", meaning that the US reneged on its commitment to link the dollar to gold at the fixed rate of $35/ounce. Second, most central banks stopped trying to maintain fixed exchange rates. The result was an anchorless monetary system of free-floating currencies that persists to this day.
Well over half of the world's currency reserves are still US$-denominated, but this is not because the US$ is still the "reserve currency". The accumulation of US$ reserves over the past decade has mostly been associated with the mercantilist trade policies of China, Japan, and other Asian governments. This official-sector accumulation of dollars will continue as long as the political leaders of these countries believe that they can gain an economic advantage via a weaker currency.
Also, a lot of international trade is still US$-denominated and commodity prices are still generally quoted in dollars throughout the world, but this happens for reasons of convenience and efficiency. It doesn't happen because the US$ has something called "reserve currency status". The fact is that the US$ is by far the most widely accepted currency in the world.
The upshot is that under the current monetary system there is no official reserve currency. It therefore isn't possible for the US$ to become less valuable as a consequence of losing "reserve currency status".
Bonds and the Debt Ceiling
Drama
The debt ceiling debate is going down to the wire. At the time of writing there are only two days left until the US government reaches the 2nd August deadline when it will supposedly no longer have enough money to meet all of its obligations. According to many commentators, this means that there is a significant risk of the US government defaulting on its debt in the near future. Furthermore, it is being widely reported that the threat of an imminent debt default has the financial markets worried. Hogwash!
Although there is a good chance that it will happen eventually, there is no chance that the US government will directly default on its debt this year and very little chance that it will directly default next year. Moreover, the markets are absolutely not anticipating a debt default. As evidence we cite the following chart, which shows that T-Bond futures broke to a new high for the year on Friday.
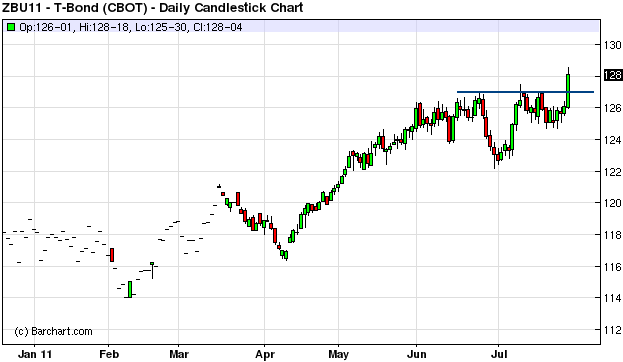
In our opinion, the financial markets are a little worried that the US government will get serious about reining in its spending. The reason is that a more fiscally prudent government would mean less monetary inflation, which would, in turn, mean lower equity prices. At the same time, a more fiscally prudent government would lead to a lesser supply of government bonds and would therefore be BULLISH for Treasury debt.
Some sort of deal will probably be done during the first half of this week to enable a hike in the debt ceiling and the expansion of the US government's total indebtedness. Such a deal would probably bring about a sharp rebound in the stock market and a sharp pullback in the T-Bond market, while continued failure to make a deal would lead to much greater uncertainty in the markets. But regardless of what happens with the debt ceiling over the days/weeks immediately ahead, one thing is crystal clear: the T-Bond is still a popular safe haven in times of uncertainty. Given this fact and the strong potential for equities and economic indicators to weaken markedly over the next 6 months, our intermediate-term T-Bond outlook has changed from "bearish" to "neutral".
RoadRunner email problem
update
Due to the main TSI email address being blocked by the RoadRunner ISP, we are now sending duplicates of all TSI emails to subscribers who have email addresses ending in "roadrunner.com" or "rr.com". If you have such an address and you only receive one TSI commentary notification email, it probably means that RoadRunner is blocking the emails sent to you from the main TSI address (sas888_hk@yahoo.com).
According to one of our subscribers (thanks Hal), the blocked email problem can be solved as follows:
1. Log into the Roadrunner Webmail page
2. Click on "Settings"
3. Click on "Allowed and Blocked Messages options"
4. Insert sas888_hk@yahoo.com in "Allowed Senders and Domains"
The Stock
Market
The S&P500 Index ended last week below short-term support at 1295, although it closed Friday's session 10 points off its low. As illustrated by the following chart, the low for the day coincided with the 200-day moving average.
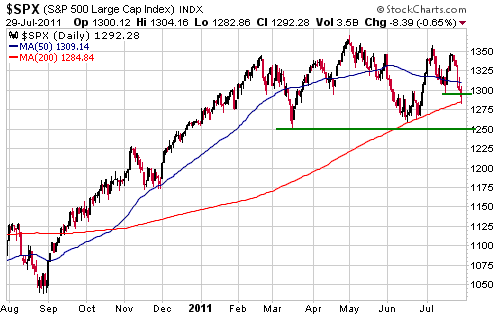
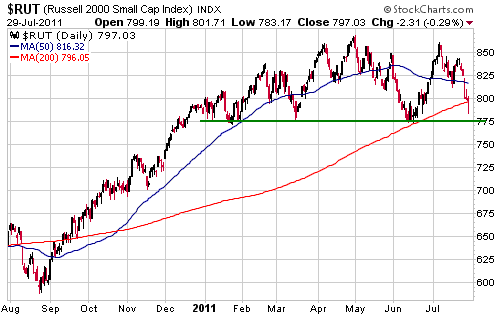
Chart-wise, the Russell2000 Small Cap Index (RUT) is in an interesting position. Over the past 7 months it has bottomed numerous times at 775, which creates a very obvious support level on the chart (see below). At Friday's low the RUT was within 1% of its 775 support level and well below its 200-day moving average, but it then managed to rebound by enough to close the week marginally above this moving average.
Much of what happens in the stock market this week will be dictated by the Debt Ceiling circus. The market is sufficiently 'oversold' that a deal to raise the debt ceiling, or some other agreement that removes uncertainty, would likely be the catalyst for a 1-2 week up-move. This would, we suspect, turn out to be a 1-2 week counter-trend rebound within a downward trend.
This week's
important US economic events
| Date |
Description |
| Monday Aug 01
| ISM Manufacturing Index
Construction Spending | | Tuesday
Aug 02 | Motor Vehicle Sales
Personal Income and Spending
| | Wednesday
Aug 03 | Factory Orders
ISM Non-Manufacturing Index | | Thursday
Aug 04 | No important events scheduled
| | Friday
Aug 05 | Employment
Situation
Consumer Credit
|
Gold and
the Dollar
Gold
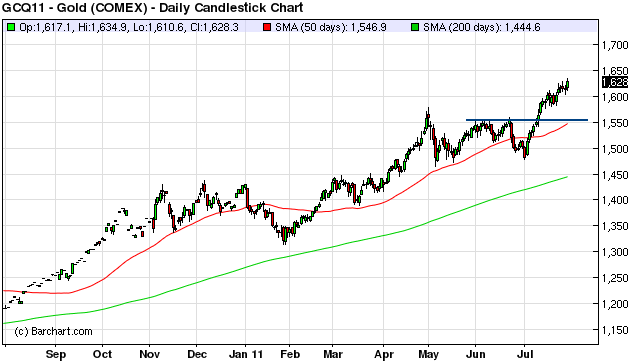
It's likely that the next 'correction' in the gold market will take the gold price down to the 50-day moving average. As illustrated by the daily chart displayed below, the 50-day moving average for August gold futures (the red line on the chart) has almost reached lateral support in the low-$1550s. This means that if a correction were to begin immediately, the low-$1550s would be the most likely destination.
A deal to raise the US government's debt ceiling could be the catalyst for a gold correction. Such a deal would be long-term bullish for gold, but it could set a downward correction in motion because the uncertainty generated by the recent debate in Washington has probably boosted the demand for gold amongst short-term traders.
Gold sentiment can no longer be described as supportive. For example, the total speculative net-long position in COMEX gold futures is now higher than it was during the second half of April, just prior to the May downturn. This is not necessarily a problem, because, as explained in previous commentaries, no market ever began to trend downward due to traders becoming optimistic. Overtly optimistic sentiment simply creates downside risk, because it ensures that a lot of speculators will be caught leaning the wrong way when the market in question reverses downward for some reason other than sentiment. Similarly, overtly pessimistic sentiment creates upside potential.
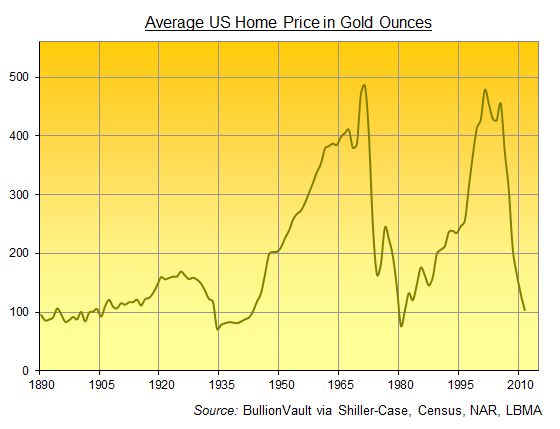
In the 13th June Weekly Update we included a chart showing the average US house price in terms of gold. The chart revealed that the average US house price was approaching a 40-year low relative to gold.
There was a longer-term chart of the house/gold ratio (the average US house price in gold terms) in Adrian Ash's recent
Mineweb article. This chart, a copy of which is inserted below for ease of reference, shows that US residential property is nearing a 100-year low in gold terms. As a matter of fact, if the gold price were to rise another 30% while house prices remained roughly the same, the average US home would be as cheap, in gold terms, as it was at the depths of the 1930s' Great Depression.
The house/gold ratio will possibly overshoot its 1934 and 1980 lows this time round, but the point is that gold is no longer cheap relative to houses.
Silver
The following daily silver futures chart shows that silver's 200-day moving average is now slightly above its May low. This means that silver could now fall far enough to test its 200-day moving average without trading below its May low. The chart also shows that September silver's 50-day moving average has edged up to around $37. The implication is that a normal short-term correction that began over the days ahead would likely end at around $37.
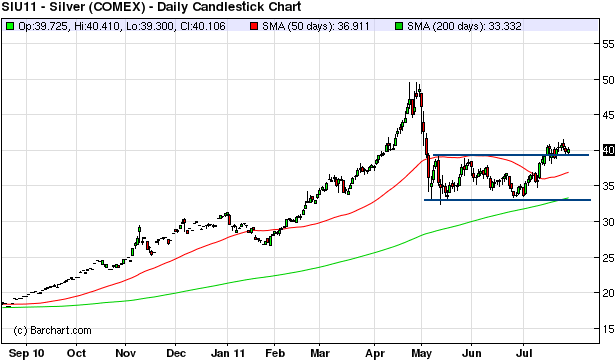
There remains a significant risk that the silver market could experience something far more serious than a normal short-term correction during September-November, with the price dropping back to the $20s. For this risk to materialise there will probably have to be a strong stock-market decline and US$ rally.
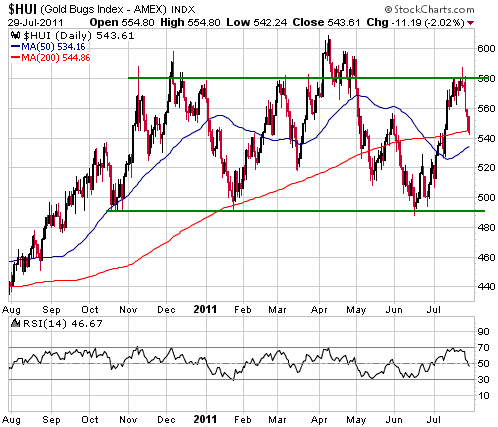
Gold Stocks
With the HUI trading in the low-500s at the beginning of July, we thought that a short-term buying opportunity was at hand. The reason is that almost regardless of which intermediate-term scenario was playing out, there was a good chance of a rebound to resistance at 580-600. After the HUI had moved up to just below this resistance, we thought that a short-term selling opportunity was at hand. The reason is that regardless of which intermediate-term scenario was playing out, there was a good chance of a pullback to near the 50-day moving average.
The HUI has since dropped back to near its 50-day moving average and the HUI's RSI is now close to a level that often coincides with the ends of routine short-term corrections, but the short-term outlook is now heavily dependent on which intermediate-term scenario is in play. If the July rally from 490 to 590 was the first leg of a new intermediate-term upward trend, then the current decline will probably end within about three percent of Friday's closing price and the next rally should take the HUI to a new all-time high. However, if the intermediate-term correction that began last December is still in progress then the short-term upside from here is probably limited to the 570s, versus downside risk to as low as 400 (450 would be the most plausible downside target following a break below support at 490, but 400 would not be out of the question). Due to gold's move to new highs the former scenario is the more likely of the two, but the downside risk is significant.
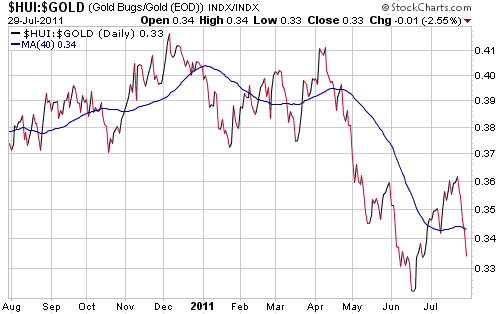
The following chart shows that the HUI/gold ratio has plunged over the past two weeks. This has occurred, at least in part, because the latest quarterly results announced by some major gold producers revealed unexpectedly-large increases in costs. Gold production costs have risen by 10%-20% over the past year, but perhaps of greater importance are the reported increases in mine construction costs. Mining is a capital-intensive business, which means that growth often necessitates substantial up-front expenditure. When capital expenditure is in a steeply rising trend, as is the case right now, it means that the already-high cost of growth is rapidly becoming even higher.
The costs of replacing in-ground reserves combined with the large up-front costs associated with building new mines make it impossible for the stock of the average major gold producer to outperform gold bullion over the long-term. Major mining stocks can sometimes be good intermediate-term trades, but they generally aren't good long-term investments relative to gold bullion.
An important part of our strategy is to accumulate the junior gold miners that the senior gold miners will end up having to buy in an effort to replenish their reserves. This strategy has worked well over much of the past 9 years, but it took a big hit in 2008 and has struggled to make headway since the beginning of this year after yielding large gains in 2009 and 2010. We expect that it will yield large gains over the next two years, but not necessarily over the next few months.
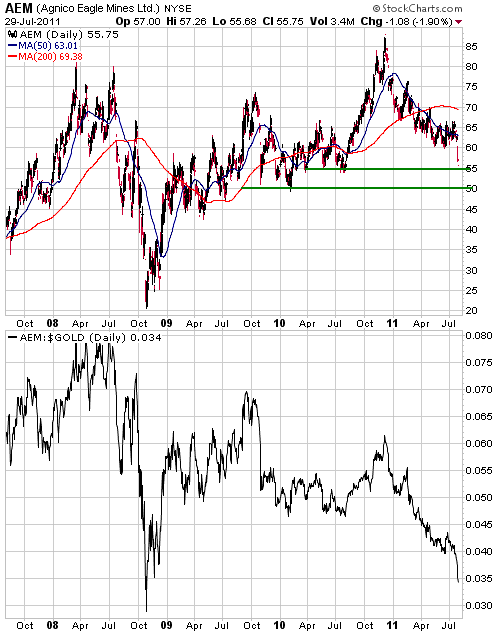
Although Agnico Eagle (AEM) is a high profile gold mining stock, we haven't mentioned it at TSI for a long time. This is because it was growing rapidly and doing most things right, but was priced for perfection. When a stock is priced for perfection it usually doesn't make sense to buy it, but if the company is doing most things right it probably doesn't make sense to bet against it. We therefore left AEM alone.
When a stock is priced for rapid growth and then fails to meet the lofty expectations that are built into its price, it will usually suffer a large price decline. This is exactly what has happened to AEM. As illustrated by the top section of the following chart, AEM has fallen from $85 to $55 over the past 8 months. Furthermore, this has happened in parallel with a $180/oz increase in the gold price.
Of particular interest to us is that the large decline in the AEM stock price along with the moderate concurrent rise in the gold price has taken the AEM/gold ratio back to within about 10% of its 2008 financial-crisis extreme. This suggests to us that the AEM/gold ratio is within 10% of a major low.
AEM is starting to look attractive, in dollar terms and relative to gold bullion. We might be tempted to do some buying this week near $55 and would almost certainly be tempted to do some buying if the AEM/gold ratio lost another 10%.
Currency Market Update
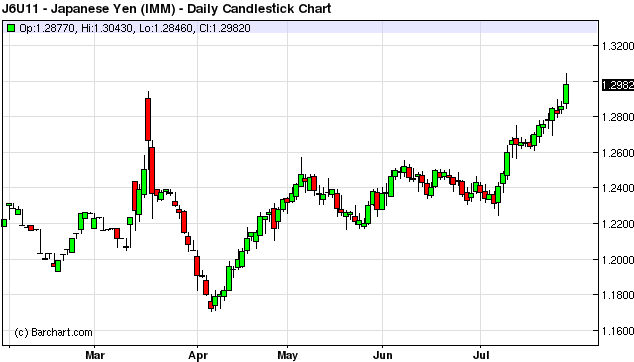
The Yen moved sharply higher during the days following the devastating Fukushima earthquake. This happened because the market quickly attempted to discount the effects of the Japanese capital repatriation that would inevitably occur as a result of the earthquake.
The Bank of Japan (BOJ) then intervened to stem the Yen's rise. The intervention, which came in the form of a massive injection of newly-created money, was successful. It was so successful, in fact, that in early April the Yen made a new low for the year against the US$. However, natural market forces then re-asserted themselves and the Yen began to trend upward. A result of this upward trend is that the Yen broke to a new high for the year on Friday.
Friday's close for the Yen was its highest daily, weekly and monthly close ever. However, we will be surprised if this currency makes much additional upward progress, one reason being that if the upward trend continues it will provoke more intervention (another large injection of new Yen) by the BOJ. Another reason is that the market has now had sufficient time to fully discount the currency-related effects of the Fukushima disaster.
We have no opinion on what the Yen will do over the next few weeks, but we think it will be trading comfortably below its current level in 6 months time.
Update
on Stock Selections
(Notes: 1) To review the complete list of current TSI stock selections, logon at http://www.speculative-investor.com/new/market_logon.asp
and then click on "Stock Selections" in the menu. When at the Stock
Selections page, click on a stock's symbol to bring-up an archive of
our comments on the stock in question. 2) The Small Stock Watch List is
located at http://www.speculative-investor.com/new/smallstockwatch.html)
 Kinross Gold September-2014 US$21.30 Warrants (TSX: K.WT.D). Recent price: C$2.48 Kinross Gold September-2014 US$21.30 Warrants (TSX: K.WT.D). Recent price: C$2.48
Kinross Gold pulled back sharply last week along with most gold stocks.
However, its early-July breakout is intact and will remain so as long as it holds above US$16.00 on a daily closing basis.
Our interest lies with the Kinross warrants mentioned above. We think these warrants have speculative merit below C$2.50.
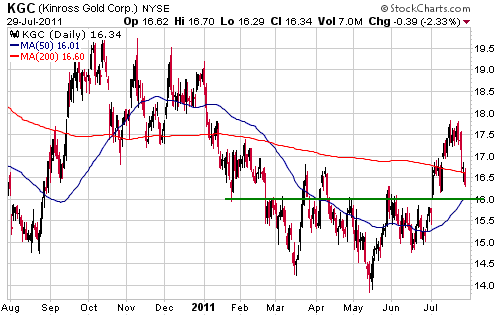
Chart Sources
Charts appearing in today's commentary
are courtesy of:
http://stockcharts.com/index.html
http://www.barchart.com/

|
