


-- Weekly Market Update for the Week Commencing
1st August 2016
Big Picture
View
Here is a summary of our big picture
view of the markets. Note that our short-term views may differ from our
big picture view.
The BULL market in US Treasury Bonds
that began in the early 1980s ended in early-2015, but there will be many years
of topping action in bond prices and bottoming action in bond yields before
major new trends get underway. (Last update: 29 June 2015)
The stock market, as represented by the S&P500 Index,
commenced
a secular BEAR market during the first quarter of 2000, where "secular
bear market" is defined as a long-term downward trend in valuations
(P/E ratios, etc.) and gold-denominated prices. This secular trend will bottom sometime between 2018 and 2020.
(Last update: 29 June 2015)
A secular BEAR market in the
US
Dollar
began during the final quarter of 2000 and ended in July of 2008. This
secular bear market will be followed by a multi-year period of range
trading.
(Last
update: 09 February 2009)
Gold commenced a
secular bull market relative to all fiat currencies, the CRB Index,
bonds and most stock market indices during 1999-2001.
This secular trend will peak sometime between 2018 and 2020.
(Last update: 29 June 2015)
Commodities,
as represented by the CRB Index, commenced a
secular BULL market in 2001 in nominal dollar terms. The first major
upward leg in this bull market ended during the first half of 2008, but
a long-term peak won't occur until 2018-2020.
(Last
update: 29 June 2015)
Copyright
Reminder
The commentaries that appear at TSI
may not be distributed, in full or in part, without our written permission.
In particular, please note that the posting of extracts from TSI commentaries
at other web sites or providing links to TSI commentaries at other web
sites (for example, at discussion boards) without our written permission
is prohibited.
We reserve the right to immediately
terminate the subscription of any TSI subscriber who distributes the TSI
commentaries without our written permission.
Outlook Summary
Market
|
Short-Term
(1-3 month)
|
Intermediate-Term
(6-18 month)
|
Long-Term
(2-5 Year)
|
|
Gold
|
N/A |
Neutral
(27-Jun-16) |
Bullish
|
|
US$ (Dollar Index)
|
N/A |
Bullish
(29-Feb-16) |
Neutral
(19-Sep-07) |
|
US Treasury Bonds (TLT)
|
N/A |
Bearish
(19-Oct-15)
|
Bearish |
|
Stock Market
(DJW)
|
N/A |
Neutral
(04-Jul-16) |
Bearish
|
|
Gold Stocks
(HUI)
|
N/A |
Neutral
(04-May-16) |
Bullish
|
|
Oil |
N/A |
Neutral
(26-Oct-15) |
Bullish
|
|
Industrial Metals
(GYX)
|
N/A |
Bullish
(04-July-16) |
Bullish |
Notes:
1. Our short-term expectations are discussed in the commentaries, but except in
special circumstances we won't attempt to assign a "bullish", "bearish" or
"neutral" label to these expectations.
2. The date shown below the current outlook is when the most recent outlook change occurred.
3. "Neutral" means that we think risk and reward are roughly in balance with respect to the timeframe in question.
4. Long-term views are determined almost completely by fundamentals and intermediate-term views
are determined by a combination of fundamentals, sentiment and technicals.
Last week's posts at the TSI Blog
Helicopter Money
Summary of current
thinking/positioning
1) Concerned about short-term
downside risk in gold, silver and the associated mining stocks, but
comfortable maintaining substantial 'core' exposure in anticipation of
large additional gains over the next two years. Continuing to pick away at
'special situations' -- small/illiquid gold stocks that could generate
large gains independently of sector-wide performance.
2) Planning
to increase exposure to non-gold commodity-related stocks (primarily
base-metals producers/explorers, but also energy and agriculture
companies) during periods of price weakness over the next four months in
anticipation of 2017-2018 being a very bullish period for commodities.
3) Thinking that the US stock market is unlikely to do much on either
the upside or the downside over the coming month, but also thinking that
the time has arrived to START preparing for the possibility/risk of
significant downside during September-October.
5) Speculating on
short-term downside in the 'safe haven' government bonds, but the trade is
not working. This trade will be a failure unless the T-Bond drops sharply
within the coming six weeks.
6) Starting to suspect that the
commodity currencies have completed the downward corrections that began in
late-April.
7) Maintaining a large cash reserve in recognition of
the downside risk in almost all equities, although the cash percentage has
been reduced over the past month via the accumulation of non-gold
commodity stocks. Current cash percentage is around 45%.
Economics and
Monetary Stuff
The Fed did what was
expected
The statement issued by the Fed at the conclusion
of the 26th-27th July FOMC Meeting was exactly what everyone SHOULD have
been expecting. In particular, the Fed a) made no monetary changes, b)
opined that the US economy was doing fine, and c) kept alive the
possibility of a rate hike before year-end while remaining non-committal
with regard to timing.
Based on the fairly minor market reaction to
the Fed's statement it is clear that almost everyone was expecting what
they should have been expecting.
That being said, there was a small
change in interest-rate expectations. For example, the Fed Funds Rate
(FFR) implied by the January-2018 Fed Funds futures contract dropped 3
basis points (0.03%) on the day of the FOMC announcement. This would
normally be a irrelevant fluctuation, but in today's environment almost
any change in the expected FFR provokes noticeable changes in the major
financial markets.
Although under more normal circumstances it
would still be a trivial fluctuation, there was a more significant decline
in the expected level of the FFR on Friday 29th July in reaction (it
seems) to an unexpectedly-low first estimate for Q2 GDP growth. As
illustrated by the following daily chart of the January-2018 Fed Funds
futures contract, there was a decline of around 6 basis points in the
expected level of the FFR on Friday (the implied interest rate is 100
minus the price of the futures contract). Furthermore, over the course of
the week the expected level of the FFR in January of 2018 fell 12 basis
points, which means that last week the market went from assigning a 100%
probability of a Fed rate hike by the end of next year to only a 50%
probability of such an event.
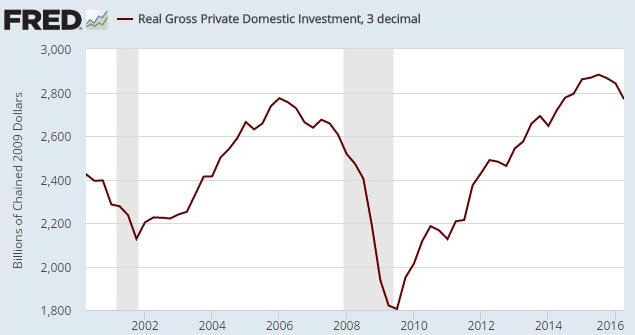
The next US recession
Real Gross Private
Domestic Investment (RGPDI) is the most reliable leading indicator of US
economic recession. Its trend has always reversed from up to down in
advance of a recession (there have been no false negatives) and only in
advance of a recession (there have been no false positives). The latest
iteration of this economic indicator became available on Friday 29th July.
RGPDI peaked in Q3-2015 and -- assuming there isn't a sizable upward
revision to the Q2-2016 number reported last week -- has now fallen far
enough from its peak to confirm that a trend reversal has taken place.
This doesn't tell us that the US economy is currently in recession or that
a recession is imminent. In fact, we know from shorter-term indicators
that the US economy is not currently in recession and is unlikely to enter
recession within the next two months. What it tells us is that the most
important precondition for a recession is now in place and that the meter
is effectively running.
Over the past 60 years, the longest time
from a peak in RGPDI to the start of a recession occurred during
2006-2007. In that historical case, RGPDI peaked in Q1-2006 and a
recession began in Q4-2007. If the delay that occurs this time around
matches the 2006-2007 delay, a recession will begin in Q2-2017.
Based on RGPDI and shorter-term indicators such as the ISM Manufacturing
New Orders Index, our guess is that the next US recession will begin no
earlier than Q4-2016 and no later than Q2-2017.
The T-Bond has
been resilient
Despite emerging signs of "price
inflation", the T-Bond is refusing to buckle. As illustrated by the
following chart of TLT (a proxy for the long end of the US government bond
market), a pullback during the first three weeks of July failed to gain
traction and more than half the loss from the early-July peak was quickly
recouped.
We have some TBT call options (TBT is a fund that moves in the
opposite direction to TLT at twice the pace) that will expire worthless in
September unless there's a sharp decline in the T-Bond price within the
next few weeks. We would exit these call options to salvage their
remaining value now if not for the fact that the T-Bond price and the US$
gold price are tracking each other closely.
The fact that the
T-Bond and gold are currently trading as if they were joined at the hip
means that we can use TBT calls to partially hedge our long exposure to
gold. We are therefore going to retain the TBT call options, although we
will consider switching from the September to the October series. The
extra 5 weeks of time to expiry could be critical.
The Stock Market
The US
The S&P500 Index (SPX) spent the past 11 trading days oscillating within a
narrow horizontal range near its high.
Unlike the gold-mining sector, which, as far as we know, has never
topped on an intermediate-term basis via several days of horizontal
trading within a narrow range, important tops in the SPX sometimes do
involve periods of low-volatility, horizontal trading. That doesn't mean
that the recent 2+ weeks of sideways movement is probably marking a
multi-month top; it means that the price action doesn't preclude such an
outcome.
Turning to the transportation sector, this is what we
wrote in the 20th July Interim Update:
"We will be interested
to see if there's enough strength in the overall market prior to the start
of a correction to push the Dow Transportation Average (TRAN) above
resistance.
TRAN has trend-line resistance very near its current
price, but the most important nearby resistance is defined by the April
high (8150). An ability to close above this resistance, even if only for a
single day, would remove a bearish non-confirmation -- one of the few
remaining pieces of evidence supporting the short-term bearish case."
1.5 weeks later and TRAN is still in roughly the same position.
Although we have a bearish non-confirmation by TRAN and a put/call
sell signal on our hands, we doubt that there will be anything more
serious on the downside over the coming few weeks than a routine pullback
in the SPX to short-term support at 2110-2130. The main reason is that
market internals such as the number of individual stocks making new
highs/lows are not yet warning of significant weakness.
With the
market 'overbought' and sentiment complacent, there remains a small chance
of a traditional September-October crash this year. However, for a crash
to happen during September-October a certain price pattern will have to
unfold over the weeks ahead and there will have to be a pronounced
weakening of market internals.
Europe
The
results of Europe's bank stress tests were released after the markets
closed on Friday 29th July, so we'll have to wait until Monday to see the
market reaction. In general, however, the results appeared to be no worse
than expected, with
most banks having survived the test. Furthermore, the Tier 1 capital
ratio of Deutsche Bank, Europe's most systemically-important bank, was
apparently better than many analysts had feared.
The Europe 600
Banks Index (FX7) ended the week slightly below resistance at 135. It will
be interesting to see if the reaction to the stress-test results is
sufficiently positive to get the FX7 above this resistance and generate a
preliminary signal of an intermediate-term bottom.
This week's
significant US economic events
[Notes:
1) The most important events
(to the markets) are shown
in bold. 2) A list of global economic events can be found
HERE]
| Date |
Description |
|
Monday August 01 |
Construction Spending
ISM Mfg Index |
| Tuesday
August 02 |
Motor Vehicle Sales
Personal
Income and Spending |
|
Wednesday August 03 |
ISM Non-Mfg Index |
|
Thursday August 04 |
Factory Orders |
|
Friday August 05 |
Monthly Employment
Report
International Trade Balance
Consumer Credit |
Gold and the Dollar
Gold and Silver
The Commitments of Traders (COT) Situation
The COT situations for both gold and silver are sounding loud warning bells,
but they've been doing so for months and nothing bad has happened to bullish
speculators. It's therefore tempting to just ignore the warnings and assume that
the current set of circumstances makes the unusually-large size of the
speculative net-long position irrelevant.
However, the fact that a risk
hasn't yet materialised is not evidence that the risk doesn't exist or can
safely be ignored. For example, it would be unwise to conclude that the risk of
playing Russian Roulette was not what it was cracked up to be just because you
were lucky enough to play every day for a week without blowing your brains out.
As we've mentioned many times in the past, an unusually-large speculative
net-long position will never be the cause of a trend reversal from up to down.
What it does is exacerbate the decline that follows a trend reversal. That is,
the risk -- or opportunity, as the case may be -- of an extremely lopsided COT
situation will only materialise when the price-trend reverses course for reasons
that have nothing to do with the COT situation.
During the latest period
for which there are COT numbers (the 5-day period ending 26 July), the total
speculative net-long position in COMEX gold futures dropped a little in parallel
with a $12 price decline. This is normal and leaves gold's COT situation
unchanged. Silver's COT situation, on the other hand, has become more extreme
despite a decline in the silver price. As illustrated below, the total
speculative net-long position (the mathematical offset of the commercial
net-short position) in silver futures has moved further into uncharted territory
over the past couple of weeks despite a pullback in the silver price.
The
recent shift in silver's COT situation adds to the downside price risk and is
evidence that the underlying physical market is weak (it suggests that upward
price pressure caused by speculative buying of futures is being counteracted by
selling of the physical commodity), but at the same time it improves the chances
of a 1-3 week surge to a new high prior to the start of a serious decline. This
is because it shows that speculators, as a group, are becoming increasingly
confident in the upward price trend.
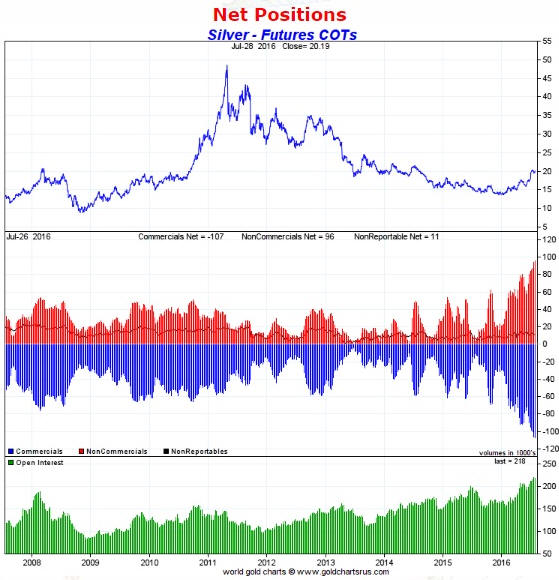
Chart source:
http://www.goldchartsrus.com/
Current
Market Situation
In the 20th July Interim Update we noted that it
isn't normal for minor changes in expectations regarding the Fed Funds rate to
consistently have meaningful effects on gold's fundamentals or price action, but
it's happening now. It's happening now for two reasons. First, the entire
financial world has come to be dominated by monetary policy. Second, gold's
price action since February of this year has been dominated by speculators in
the futures market and these speculators have, as a group, been buying/selling
in response to small changes in the expected actions of the Fed. For example,
during the first three weeks of July the gold price pulled back as the expected
level of the Fed Funds Rate (FFR) drifted upward, and last week the gold price
rose in parallel with a slight decline in the expected level of the FFR. Refer
to the Fed Funds futures chart included earlier in today's report for more
information.
Small changes in the expected level of the FFR are also
being captured by the currency market, the bond market, and, of special
relevance to gold, the bond/dollar ratio (the T-Bond price divided by the Dollar
Index). For example, in response to last week's fairly minor decline in the
expected FFR there was a pronounced upward reversal in the bond/dollar ratio and
a predictable -- based on the strong positive correlation between this ratio and
the US$ gold price -- rally in the gold market.
During the decline from its July peak the gold market generated a warning
signal in the form of a break below the 20-day MA, but at no time did the gold
price breach trend-defining support at $1308. As noted in the 25th July Weekly
Update: "There will be a realistic chance of a surge to $1400 prior to a
multi-month top as long as this support [at $1308] holds on a daily closing
basis."
Last week the gold price not only managed to stay above
$1308, it rallied far enough in response to a down-tick in the expected FFR to
move back above its 20-day MA. The chance of a near-term rise to $1400 has
therefore improved.
Gold Stocks
Last week we wrote:
"There has
been an early warning of a top in the form of a daily close below the 20-day MA,
but the price action does not have the look of a meaningful top. Let's put it
this way: If the HUI's intermediate-term rally ended earlier this month it would
-- as far as we can tell -- be the first time ever that a gold-mining-sector top
was put in place via several days of horizontal trading within a narrow range.
Normally, intermediate-term tops in the gold-mining indices take the form of an
inverted V.
As things stand, there is still a decent chance of a surge to
a new high within the next 1-3 weeks. This will likely remain the case as long
as the HUI holds above 235 on a daily closing basis."
Last week the
HUI not only managed to hold comfortably above support in the 235-240 range, it
reversed upward and made a marginal new high for the year. This has potentially
set the stage for a final surge and a top during August.
Last week's reversal kept the HUI in synch with the 1982-1983 rally in the
Barrons Gold Mining Index (BGMI). Here's the updated comparison.
From a fundamental perspective we aren't keen on the comparison between this
year's rally and the 1982-1983 bear-market rebound, but the historical record
contains no other gold-mining rally from a multi-year low that comes as close to
matching this year's price action.
If the HUI continues to track the
BGMI's 1982-1983 rally then it will surge to a high of around 300 by mid-August
and then drop back to the low-200s over the ensuing two months. But regardless
of whether it continues to follow the 1982-1983 pattern and regardless of
whether we are dealing with a new bull market or an incredibly-strong
bear-market rebound, the HUI's decline from the coming intermediate-term peak is
likely to be at least 25% and could be as much as 40%.
The
Currency Market
Last week's action in the currency market threw
the proverbial spanner into the works. Prior to Friday the Dollar Index was
holding at its 200-day MA and appeared to be completing a routine pullback.
However, Friday's combination of Japan's central bank not acting as stupidly as
expected and a much lower-than-expected estimate for US second-quarter GDP
growth transformed a normal-looking pullback into something more significant.
As illustrated below, the Dollar Index plunged below its 200-day MA on
Friday and appears to be headed for channel support at 94.5-95.0.
From our perspective, the Canadian Dollar (C$) put in the currency market's most
interesting performance last week. Although it didn't make a big move, the C$
piqued our interest because it began to rally shortly after breaking below
important support at 76 (refer to the following chart).
The false
downside breakout is an early warning that the C$'s correction is over, which,
if so, would have implications for other markets. Of greatest significance, if
the C$'s correction is over then the correction in the oil market is probably
close to being over.
A daily close above 78 would be a more conclusive
warning that the C$'s correction is over.
Updates
on Stock Selections
Notes: 1) To review the complete list of current TSI stock selections, logon at
http://www.speculative-investor.com/new/market_logon.asp
and then click on "Stock Selections" in the menu. When at the Stock
Selections page, click on a stock's symbol to bring-up an archive of
our comments on the stock in question. 2) The Small Stock Watch List is
located at http://www.speculative-investor.com/new/smallstockwatch.html
 Company
news/developments for the week ending Friday 29th July 2016:
Company
news/developments for the week ending Friday 29th July 2016:
[Note: AISC = All-In Sustaining Cost, FS = Feasibility Study, FY = Financial
Year, IRR = Internal Rate of Return, MD&A = Management Discussion and Analysis,
M&I = Measured and Indicated, NAV = Net Asset Value, NPV(X%) = Net Present Value
using a discount rate of X%, P&P = Proven and Probable, PEA = Preliminary
Economic Assessment, PFS = Pre-Feasibility Study]
*Endeavour
Mining (EDV.TO) published its quarterly report for the June quarter.
EDV's latest quarterly results show the benefit of not being reliant on any
single or even any two mining operations, as lower-than-expected output from two
mines (Nzema and Tabakoto) and teething problems associated with the startup of
the Karma gold mine (Burkina Faso) were offset by better-than-expected
performance from two other mines (Agbaou and Ity). Overall, it was an in-line
production result that keeps the company on track to achieve its
upwardly-revised (due to the acquisition of True Gold Mining) 2016 guidance of
590K-600K ounces.
EDV's balance sheet has undergone a large and very
positive transformation over the past year. After having well in excess of
US$200M of net debt a year ago, including the recently-completed equity
financing the net debt figure has dropped to only US$24M. EDV is now
conservatively geared and well positioned to complete the construction of its
Hounde mine in Burkina Faso over the coming 12 months.
Despite the
tripling of its stock price since the beginning of this year, EDV still offers
reasonable long-term value in absolute terms and good value relative to many of
its peers. However, regardless of how high the stock price moves over the next
few weeks an opportunity to buy the shares at a much lower price will probably
arrive in the midst of a sector-wide correction during September-October.
*Premier Gold (PG.TO) announced that it has agreed
to buy Yamana Gold's Mercedes gold-silver mine in Sonora, Mexico, for US$122.5M
of cash plus 6M PG shares plus 3M PG 2-year warrants with an exercise price of
C$4.75. Excluding the warrants, at a PG stock price of C$4.60 and a C$/US$ rate
of 0.76 the purchase price equates to about US$143M.
Mercedes is an
underground mining operation that is forecast to produce around 86K-ounces of
gold per year over the next few years at an AISC of around US$935/oz. This means
that PG has agreed to pay about US$1660 per ounce of annual gold production,
which is reasonable for an asset of this type in the current market. Also, the
current M&I resource is about 870K ounces and there is apparently a lot of
exploration-related upside potential.
This is a positive development for
PG, but from our perspective the good news was partly offset by
lower-than-expected 2017 production guidance for the company's South Arturo
project. According to the information released with the Mercedes acquisition
news, PG's 40% share of South Arturo's 2017 production is forecast to be 50K
ounces, which is about half of what we were expecting. PG's total production
guidance for 2017 is now 138K ounces.
PG will be able to finance the
Mercedes purchase with existing financial resources and perhaps some new debt,
although we won't be surprised if the company does an equity financing to cover
part of the cost.
Due to the Mercedes acquisition it is now reasonable to
compare PG with companies such as Richmont Mines (RIC). Such comparisons suggest
that PG is worth about 50% more than its current stock price, although what PG
is actually worth will be influenced to a large extent by the
soon-to-be-released FS for the Trans-Canada project.
PG has been a
relatively strong stock over the past few years. For example, if the HUI had
matched PG's performance over the past three years then it would now be trading
at around 500. However, PG has been a relatively poor performer this year,
although on a relative basis it has turned around over the past month. The lower
section of the following chart shows PG relative to GDXJ.
For
the first time this year PG has risen to a price where partial profit-taking
could be appropriate for those with substantial exposure to the stock. We have
substantial exposure to PG and sold 25% of our shares on Friday 29th July, but
this shouldn't be viewed as a bearish shift of opinion. The sale was a routine
money-management action designed to reduce the stock's weighting in our
portfolio to a more comfortable level.
*Ramelius Resources
(RMS.AX) published its quarterly report for the June quarter.
The report confirmed that the company was strongly cash-flow positive during the
latest quarter, boosting its cash by A$12M to around A$50M. Furthermore, FY2017
production guidance of 135K ounces at an AISC of A$1050 (US$787) per ounce
suggests that the company will be strongly cash-flow positive over the coming 12
months.
Operationally, RMS continues to perform very well.
Also,
RMS announced that it has raised A$25M by issuing 50M new shares at A$0.50/share
to institutions in North America and Australia. The funds will be used to
accelerate the development of deposits at/near the company's Mt Magnet gold mine
with the aim of growing production to 150K ounces in FY2018 (from the 135K
ounces expected to be produced in FY2017) and extending the mine life.
This equity financing came as a big surprise, because the work that is being
funded by the newly-raised money could have easily been funded by existing
financial resources (the $50M of cash mentioned above plus an undrawn $10M
credit facility). However, with the stock price near a multi-year high and a
gold correction in the offing, the financing was well timed.
By slightly
reducing both risk and reward, the financing doesn't significantly change our
opinion of the stock.
*Resolute Mining (RSG.AX)
published its quarterly report for the June quarter. This report's salient
details were previously announced by the company and outlined at TSI in the 11th
July Weekly Update.
As is the case with EDV, RSG's balance sheet has
undergone a large and very positive transformation over the past year. Without
issuing any new shares, over the past year the company has gone from having net
debt of A$64M to having net cash of A$75M.
*Taseko Mines
(TGB) published its quarterly report for the June quarter. TGB is a
moderately-high-cost producer of copper and the copper price is within 10% of a
7-year low, so it isn't surprising that the company just reported another poor
quarterly performance in terms of bottom-line profit (the bottom-line loss was
C$19.3M).
Production costs were down slightly from the preceding quarter
(from US$2.11/pound to US$2.07/pound) and are expected to drop a little more
over the coming two quarters, but near the current copper price of US$2.20/pound
this company will not do any better than break even. At US$2.50/pound it would
probably be able to generate a reasonable profit and at US$3.00/pound it would
probably be very profitable (and the stock price would be much higher). We are
interested in owning TGB and accumulating the stock on weakness in anticipation
of a rise in the copper price to $3/pound next year.
TGB's balance sheet
is not in great shape. In particular, at 30th June the company had net debt
(long-term debt minus working capital) of C$271M, which is up from C$260M at the
end of the previous quarter. This means that there was an $11M balance-sheet
deterioration during the latest quarter.
However, due to its $88M of
working capital the company does not have a short-term financial problem.
Provided that the copper price is in the process of basing, TGB won't experience
a cash crunch.
Chart Sources
Charts appearing in today's commentary
are courtesy of:
http://stockcharts.com/index.html
http://www.barchart.com/
http://bigcharts.marketwatch.com/
http://research.stlouisfed.org/
