|
-- Weekly Market Update for the Week Commencing
1st September 2014
Big Picture
View
Here is a summary of our big picture
view of the markets. Note that our short-term views may differ from our
big picture view.
In nominal dollar terms, the BULL market in US Treasury Bonds
that began in the early 1980s ended in 2012. In real (gold)
terms, bonds commenced a secular BEAR market in 2001 that will continue
until 2018-2020. (Last
update: 20 January 2014)
The stock market, as represented by the S&P500 Index,
commenced
a secular BEAR market during the first quarter of 2000, where "secular
bear market" is defined as a long-term downward trend in valuations
(P/E ratios, etc.) and gold-denominated prices. This secular trend will bottom sometime between 2014 and 2020.
(Last update: 22 October 2007)
A secular BEAR market in the Dollar
began during the final quarter of 2000 and ended in July of 2008. This
secular bear market will be followed by a multi-year period of range
trading.
(Last
update: 09 February 2009)
Gold commenced a
secular bull market relative to all fiat currencies, the CRB Index,
bonds and most stock market indices during 1999-2001.
This secular trend will peak sometime between 2014 and 2020.
(Last update: 22 October 2007)
Commodities,
as represented by the Continuous Commodity Index (CCI), commenced a
secular BULL market in 2001 in nominal dollar terms. The first major
upward leg in this bull market ended during the first half of 2008, but
a long-term peak won't occur until 2014-2020. In real (gold) terms,
commodities commenced a secular BEAR market in 2001 that will continue
until 2014-2020.
(Last
update: 09 February 2009)
Copyright
Reminder
The commentaries that appear at TSI
may not be distributed, in full or in part, without our written permission.
In particular, please note that the posting of extracts from TSI commentaries
at other web sites or providing links to TSI commentaries at other web
sites (for example, at discussion boards) without our written permission
is prohibited.
We reserve the right to immediately
terminate the subscription of any TSI subscriber who distributes the TSI
commentaries without our written permission.
Outlook Summary
Market
|
Short-Term
(1-3 month)
|
Intermediate-Term
(6-12 month)
|
Long-Term
(2-5 Year)
|
|
Gold
|
Bullish
(01-Sep-14) |
Bullish
(26-Mar-12) |
Bullish
|
|
US$ (Dollar Index)
|
Bearish
(27-Aug-14) |
Bearish
(25-Aug-14) |
Neutral
(19-Sep-07) |
|
Bonds (US T-Bond)
|
Neutral
(18-Aug-14)
|
Neutral
(18-Jan-12)
|
Bearish |
|
Stock Market
(DJW)
|
Bearish
(07-Apr-14) |
Bearish
(28-Nov-11) |
Bearish
|
|
Gold Stocks
(HUI)
|
Bullish
(01-Sep-14) |
Bullish
(23-Jun-10) |
Bullish
|
|
Oil |
Neutral
(02-Jun-14) |
Neutral
(31-Jan-11) |
Bullish
|
|
Industrial Metals
(GYX)
|
Neutral
(17-Feb-14) |
Bullish
(28-Apr-14) |
Bullish
(28-Apr-14) |
Notes:
1. The date shown below the current outlook is when the most recent outlook change occurred.
2. "Neutral", in the above table, means that we either don't have a
firm opinion or that we think risk and reward are roughly in balance with respect to the timeframe in question.
3. Long-term views are determined almost completely by fundamentals,
intermediate-term views by
fundamentals, sentiment and technicals, and short-term views by sentiment and
technicals.
Update
on the "widowmaker trade"
Over the past 15 years there have always been very compelling
reasons to short Japanese Government Bonds (JGBs), but almost
everyone who has attempted to make money by shorting JGBs has ended
up losing money. The consistency with which bearish JGB speculators
have lost money over a great many years led to the short-selling of
JGBs becoming known as the "widowmaker trade" and spawned the
saying: "you can't claim to be a speculator until you've lost money
shorting JGBs".
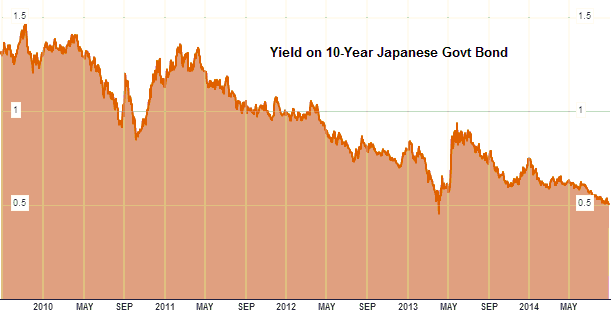
As evidenced by the steady downward trend on the following chart of
the 10-year JGB yield, anyone who has attempted to short the JGB
since the beginning of this year has lost money. In other words, the
"widowmaker trade" is still living up to its name. Moreover, with
the exception of a few days during early-April of last year, the
10-year JGB yield has never been lower than it is right now.
Actually, despite the steady upward grind in price and downward
grind in yield, we doubt that many speculators have lost money
shorting JGBs this year. The reason is that the market for JGBs no
longer functions like a real market. It has effectively been
squashed by the gigantic boot of the Bank of Japan (BOJ).
Due to the BOJ's policy of buying-up every piece of government debt
it can get its hands on, the JGB is so over-priced that there are no
buyers apart from the BOJ. At the same time, nobody in their right
mind would bet against a high-priced investment that was being
supported by a totally committed buyer with infinitely deep pockets.
Consequently, for all intents and purposes the JGB market is dead.
Given the proclivity of the US monetary authorities to copy Japan's
worst policy choices, speculators who believe that they will make a
fortune over the years ahead by shorting US government bonds should
probably re-think their stance. After all, if a Keynesian remedy
fails dismally in Japan, it can only be because the remedy wasn't
implemented aggressively enough.
An early warning that the junk debt
bubble is beginning to deflate
The Fed's money-pumping and commitment to a
near-zero target for the official short-term interest rate caused 'investors' to
bid-up the prices of junk bonds as part of a desperate attempt to obtain a
positive real yield. This led to a powerful upward trend in the iShares High
Yield Corporate Bond Fund (HYG). However, evidence has emerged that this trend
is close to its end.
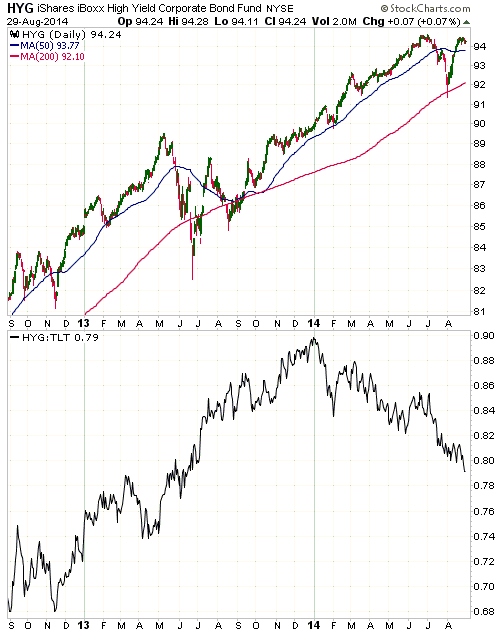
The top half of the following chart shows that there was a quick decline by HYG
to its 200-day MA during July and that the price has since recovered to the
vicinity of its June-2014 all-time high. Given that the July-2014 correction
wasn't even as serious as the bull-market correction that occurred during
May-June of last year and has already been retraced in full, it does not
constitute evidence that a major trend reversal is in the works.
The evidence that we were referring to is in the performance of HYG relative to
TLT, which is shown in the bottom half of the chart. Relative to TLT (a fund
that holds T-Bonds), HYG has been trending downward since the beginning of this
year and ended last week at a new 12-month low. This is the most significant
decline in the HYG/TLT ratio since 2011.
We aren't inclined to short HYG (or similar high-yield bond funds) or to bet on
a further decline in the HYG/TLT ratio. Instead, we will continue to use the HYG/TLT
ratio as a stock and gold market indicator. The weaker HYG becomes relative to
TLT, the more bullish the situation becomes for gold and the more dangerous the
situation becomes for the S&P500.The Stock
Market
The US
Long-term risk has never been higher
Whether it begins immediately or during the final quarter of this year or a year
from now, the next cyclical decline in the US stock market is likely to be among
the largest 1-2 year declines of the past 100 years. One reason is that the
valuation of the median stock is the highest on record. (The S&P500 Index was a
lot more expensive at the 2000 peak than it is today, but that was due to the
ridiculously high valuations of a relatively small number of stocks. For most
stocks, valuations are higher today than they were at the 2000 peak.) Another
reason is that market participants are now, on average, more leveraged than they
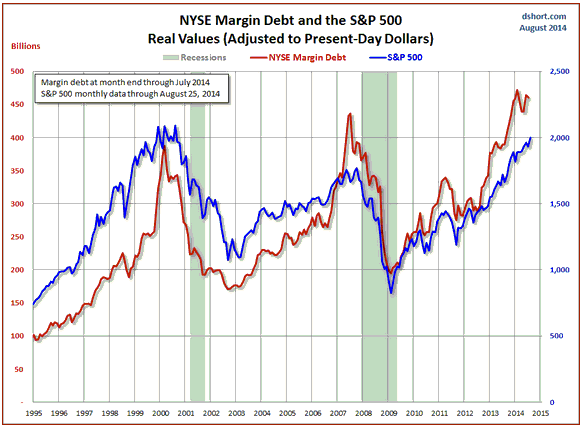
have ever been. The leverage we are referring to is illustrated by the two
charts displayed below, both of which were taken from Doug Short's
25th August article.
The first chart compares NYSE Margin Debt (the red line) with the CPI-adjusted
S&P500 Index (the blue line). A critical point to note here is that while margin
debt is higher than it has ever been, a high level of margin debt is never a
problem for the market until after it stops rising. To put it another way, as
long as market participants continue to take on more debt-based leverage, a
large stock-market decline probably won't begin. Instead, the market only starts
to have a problem after investors start reducing their indebtedness. A related
point is that margin debt has led the S&P500 Index at the last four major
turning points. This implies that if margin debt moves above its early-2014 peak
then the S&P500 is probably still at least a few months away from its ultimate
top, but if margin debt drops below its May-2014 low then the S&P500's ultimate
top is probably either in place or very near.
The second chart compares NYSE Investor Credit (cash plus available credit in
margin accounts minus NYSE margin debt) with the nominal S&P500 Index. Its
message is that market participants are even more extended/leveraged than
suggested by the current high level of NYSE margin debt. Again, though, the
market will only start to have a problem AFTER market participants, as a group,
decide that they want to become less leveraged.

Current Market Situation
Last week the S&P500 Index traded sideways near 2000. The most likely near-term
outcome is a downward reversal before the end of this week followed by a quick
2-3 week decline to the 200-day MA (around 1880) or lower. However, a much less
likely but still realistic possibility is that the S&P500 will accelerate upward
over the next few weeks in a final blow-off move.
"Emerging Markets"
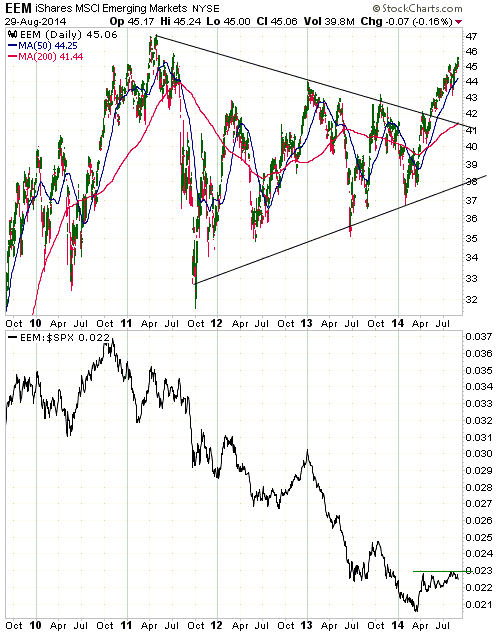
EEM, a proxy for emerging market equities, is 'overbought' and nearing major
resistance at $46-$47. It is likely to soon commence a multi-week downward
correction to the $42-$43 range.
Relative to the S&P500 Index, EEM has been gradually strengthening since March
but hasn't yet gained enough ground to conclusively signal an end to its
cyclical bear market. To generate such a signal, the EEM/SPX ratio (refer to the
bottom section of the following chart) needs to break above its highs of the
past few months.
The view that emerging-market equities are transitioning from bear mode to bull
mode is linked to the view that commodities are transitioning from bear mode to
bull mode. To come to fruition, both of these views will probably require
weakness in the Dollar Index over the next few quarters.
This week's
significant US economic events
(The most important events are shown
in bold)
| Date |
Description |
| Monday Sep 01 |
US (and Canadian) markets closed for public
holiday | | Tuesday
Sep 02 |
Construction Spending
ISM Manufacturing Index | | Wednesday
Sep 03 |
Motor Vehicle Sales
Factory Orders
Fed's Beige Book | | Thursday
Sep 04 |
Q2 Productivity and Costs (revised)
ISM Non-Mfg Index
International Trade Balance
|
| Friday Sep 05 |
Monthly Employment Report |
Gold and
the Dollar
Gold
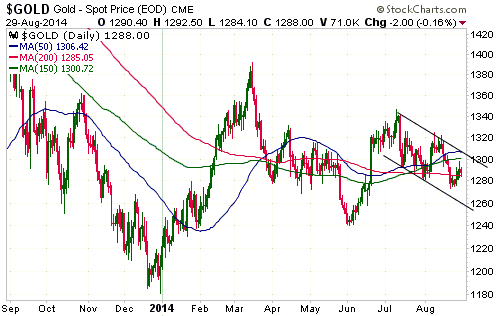
Gold's recent price action has been non-committal. The price broke below
short-term support in the low-$1280s during the week before last and again at
the start of last week, but the downside breakout was not sustained and not
confirmed by significant weakness in the gold-mining sector. The gold price
subsequently negated its breakdown by achieving consecutive daily closes above
$1285 during the second half of last week, but this positive development was
also not confirmed by the gold-mining indices and ETFs. In effect, the
gold-mining sector yawned when gold broke below support in the $1280s and yawned
again when gold negated the breakdown. This tells us that support in the
low-$1280s is not as important as we thought.
We are now essentially back to where we were two weeks ago. We've seen nothing
to indicate that gold's decline from its July peak is anything more serious than
a routine short-term consolidation, but we've also seen nothing to indicate that
the consolidation is over.
Gold's short-term consolidation is defined by the channel drawn on the following
daily chart. The continuation of the consolidation for another week could result
in the gold price spiking down to the channel bottom at around $1260.
Some of our readers have expressed the belief to us via email that a major
catalyst will be required for gold to rally strongly from here. We disagree.
Based on what has happened over the past few weeks we get the impression that
the path of least resistance is to the upside and that a major catalyst will be
needed to push the gold price significantly lower. Our reasoning is that despite
multiple bearish influences, including an upside breakout by the Dollar Index,
the S&P500's rise to the magical 2000 level, a small decline in inflation
expectations and talk of an earlier-than-expected beginning to the Fed's next
rate-hiking program, the gold market couldn't even sustain a break below
short-term support.
Gold Stocks
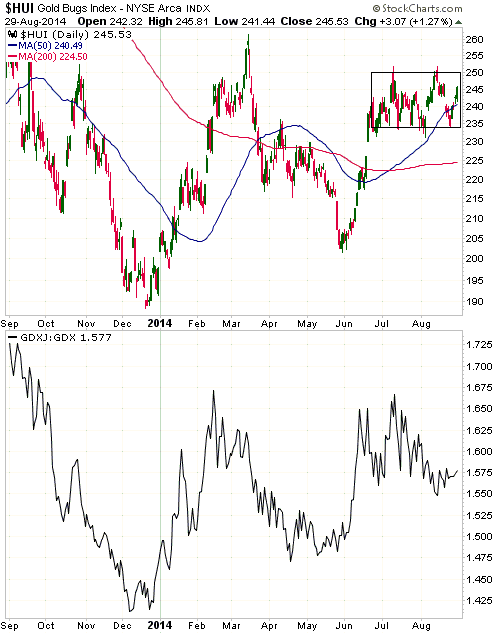
Despite gold's brief dip below short-term support, the HUI remained within the
narrow range in which it has oscillated for more than two months. It touched the
bottom of this range last Monday and then rebounded, climbing back above its
50-day MA in the process. Refer to the top section of the following daily chart
for details.
The HUI has recently been strong enough relative to gold bullion to push the HUI/gold
ratio to a 12-month high. This is obviously bullish. It suggests that both gold
and gold stocks will soon begin to rally. However, the recent lacklustre
performance of the GDXJ/GDX ratio 'muddies the waters'. As illustrated by the
bottom section of the following chart, the GDXJ/GDX ratio has bounced over the
past couple of weeks, but the bounce has been unimpressive.
Based on past performance, we expect the GDXJ/GDX ratio to move sharply higher
at the beginning of the next tradable rally in the gold-mining sector. GDXJ/GDX's
current message is that such a rally hasn't yet begun.
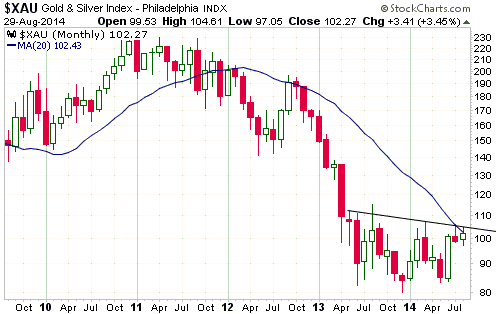
If we step back for a wider-angle view we see that in one respect last week's
performance by the gold-mining sector was picture-perfect. The following monthly
XAU chart shows what we mean. With reference to this chart, notice that last
Friday's intra-day high touched a well-defined trend-line dating back to May of
last year and that Friday's close, which was also the monthly close for
August-2014, was almost exactly at the 20-month MA (the blue line on the chart).
A monthly close above the 20-month MA and the trend-line drawn on our chart
would be additional clear-cut evidence that a major reversal occurred at the end
of last year. Friday's close was therefore as high as it could be without
completely invalidating the 'technical' case that a bear market is still in
progress.
We will be surprised if the aforementioned technical case survives another
month.
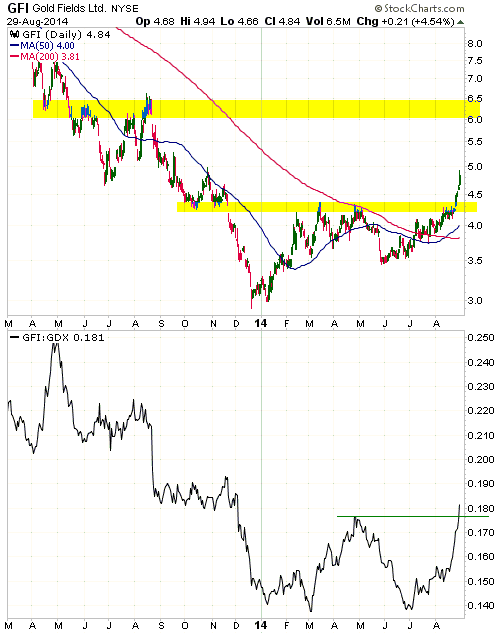
Although last week was uneventful for the gold-stock indices and ETFs, some
individual gold stocks performed impressively. In this regard, the performance
of Gold Fields Ltd (GFI) is worth highlighting.
Two weeks ago we explained why GFI was our favourite senior gold-mining stock.
Soon after and for no news-related reason that we know of, GFI became the
market's favourite senior gold-mining stock. As depicted below, GFI has recently
surged in dollar terms and relative to GDX (an ETF proxy for senior gold
miners). In doing so it has clearly broken above intermediate-term resistance
and the top of its lengthy basing pattern. It appears to be in a hurry to make
up for a year of relative weakness.
GFI is now extended to the upside and could pull back to around $4.50. However,
last week's upside breakout confirms the viability of the $6.00-$6.50
intermediate-term target we mentioned two weeks ago. It also highlights the
speed at which market sentiment can change.
The Currency Market
The latest COT report shows that the total speculative net-short position in
euro futures was at a 2-year high of 196K contracts as of last Tuesday.
The total speculative net-short position in euro futures got as high as 250K
contracts during the second quarter of 2012, but that was when there appeared to
be a short-term threat to the euro's existence. There is no such threat at this
time, so we certainly wouldn't bet on the speculative bearish bet getting
significantly bigger than it is right now. In our opinion, the euro is primed
for a short-term reversal (from down to up) during the first half of September,
perhaps following a final downward spike over the coming few days.
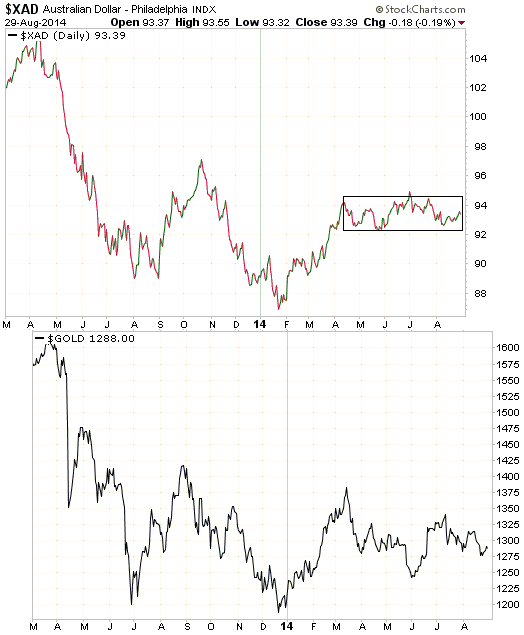
Displayed below is a chart of the Australian Dollar (A$) above a chart of the
US$ gold price, with the gold chart shifted one month to the right to make it
more clear that gold has been leading the A$ by roughly one month at turning
points. The point we want to make is that the A$ will probably begin its next
meaningful advance shortly after gold does the same.
Updates
on Stock Selections
Notes: 1) To review the complete list of current TSI stock selections, logon at
http://www.speculative-investor.com/new/market_logon.asp
and then click on "Stock Selections" in the menu. When at the Stock
Selections page, click on a stock's symbol to bring-up an archive of
our comments on the stock in question. 2) The Small Stock Watch List is
located at http://www.speculative-investor.com/new/smallstockwatch.html
 Company
news/developments for the week ended Friday 29th August 2014: Company
news/developments for the week ended Friday 29th August 2014:
[Note: AISC = All-In Sustaining Cost, FS = Feasibility Study, IRR = Internal
Rate of Return, MD&A = Management Discussion and Analysis, M&I = Measured and
Indicated, NAV = Net Asset Value, NPV(X%) = Net Present Value using a discount
rate of X%, P&P = Proven and Probable, PEA = Preliminary Economic Assessment,
PFS = Pre-Feasibility Study]
*Asanko Gold (AKG) reported that it has arranged to purchase the
2% net smelter return (NSR) royalty on phase 1 of the company's Asanko gold
project from a private Ghanaian company called Goknet Mining. According to AKG's
press release, the financial terms of the arrangement are confidential, but are
not considered material to Asanko. The settlement apparently involves cash, one
million Asanko shares and the transfer to Goknet of two non-material exploration
projects, Kubi and Diaso.
This news is more significant and more positive for AKG than it superficially
seems. The reason is that at $1500/oz the Asanko gold mine would have annual
revenue of about $300M/year beginning in 2016, meaning that a 2% NSR royalty
would begin paying $6M/year in 2016. A $6M/year gold royalty could be worth as
much as $60M, so it is definitely good news that AKG has eliminated this royalty
for an amount that isn't considered material.
*Energold Drilling (EGD.V) published its financial results for the
quarter ending 30th June 2014.
The company reported a loss of $4M for the quarter. The loss was due to the
continuing poor performance of its Minerals division, partly offset by a good
performance (considering the seasonality of the business) by its Energy
division. Minerals-related drilling revenue plunged almost 50% from the same
quarter last year.
A return by EGD to meaningful and consistent profitability will require a global
recovery in minerals-related drilling, which probably won't get underway prior
to the second quarter of next year. However, we expect that EGD's stock price
will begin to discount the aforementioned recovery after it becomes clear that
the gold market has turned the corner.
Apart from anticipation of an industry-wide recovery in minerals exploration,
the reason to buy EGD at this time is that its market capitalisation is
completely covered by its $70M of working capital. In effect, buyers of the
shares near the current price are paying nothing for a drilling business with
the potential to become very profitable within the coming 12 months.
*Premier Gold (PG.TO) reported the results of nine holes drilled
at its 100%-owned Cove gold-silver project in Nevada. The highlights were 18.09
g/t Au across 4.3 m, 5.27 g/t Au across 21.9 m, and 12.73 g/t Au across 7.5 m.
Cove has the makings of a valuable gold project, but it is way too early in this
project's development for us to quantify the value. At this stage, our interest
in PG is mostly due to its Trans-Canada gold project in Ontario. We can value
this project because it has a large defined M&I resource and a PEA.
*True Gold Mining (TGM.V) published its financial report for the
June quarter. The report shows that TGM had $47M of working capital at 30th
June, down from $63M at 31st March as the company ramps up spending on mine
construction at its Karma gold project in Burkina Faso.
With the aforementioned working capital and the $100M recently obtained via a
"streaming deal", TGM should have more than enough money to bring Karma into
production at the rate of around 100K ounces/year by the end of next year.
We think that TGM is slightly under-valued based on Karma's current mine plan
and very under-valued assuming that there is enough economically-viable gold in
the area to extend the mine life by a few years and increase the annual
production rate. Considering the company's success on the exploration front and
the size of the existing Inferred resource, this is a realistic assumption.
 List of candidates for new buying
From within the ranks of TSI stock selections, the best candidates
for new buying at this time are:
1) AKG (last Friday's closing price: US$2.33).
2) EDV.TO (last Friday's closing price: C$0.91).
3) EVN.AX (last Friday's closing price: A$0.75).
4) PLG.TO (last Friday's closing price: C$1.30).
5) TGD (last Friday's closing price: US$1.72).
 Orezone Gold (ORE.TO) trading position exited
As advised in the email sent to subscribers prior to the start of North American
trading last Friday, the ORE trading position had reached our short-term upside
target and had therefore been removed from the TSI List for a gain of about 50%.
As we'd previously confirmed that the position would be exited for TSI record
purposes in the high-C$0.90s, the main reason for the email was to explain why
we intended to retain half of the ORE shares held in our own portfolio.
One reason for retaining half of our exposure was that the stock's upside
breakout (see chart below) suggested the potential for quick and significant
additional gains IF the overall sector resumed its upward trend. The other
reason was to hedge the risk that there would be a takeover bid for ORE from
either TGM.V or EDV.TO. This is a risk to us because a) we have a medium-sized
position in TGM and a large position in EDV, and b) in most takeover situations
there is initially a sharp decline in the stock price of the acquirer. We don't
expect it to happen anytime soon, but based on the way the stocks traded last
Friday the market might be discounting a bid for ORE by TGM.
A takeover of ORE by TGM would probably work out well for TGM shareholders over
the next 12 months because it would increase TGM's leverage to gold, but it
would be a short-term negative.
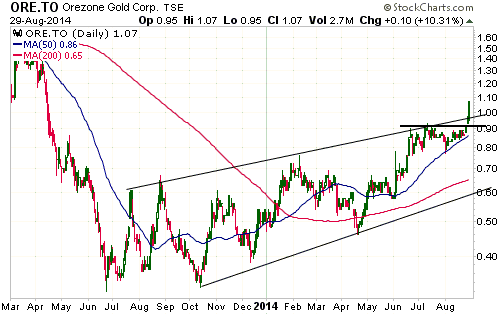
Chart Sources
Charts appearing in today's commentary
are courtesy of:
http://stockcharts.com/index.html
http://www.bloomberg.com/

|

