|
-- for the Week Commencing 1st December 2003, 2nd Page
Copper
From the 12th November Interim Update:
"When copper broke above resistance in the 79-80 range 3 months ago
it generated an upside target of mid-90s, a level that also roughly corresponded
to the peak reached in September of 2000. This target has been achieved
and given the almost vertical rise in the price that has occurred over
the past several weeks it would be normal for a pullback to begin from
around the current level. A reasonable target for such a pullback, assuming
it does occur, would be the breakaway gap at around 86. This would constitute
a 40% retracement of the rally from the May low to the recent peak."
The below weekly chart of copper futures
shows that copper hasn't yet reached the above-mentioned support level.
Other support levels that could come into play if the correction continues
are 82 and 80. In our opinion, 86 is the most likely level for a correction
low while a drop to 82 represents the maximum short-term downside risk.
We continue to expect that copper will
trade up to the mid-120s over the next 12 months in response to Asian demand,
global inflation and a weakening US$.

Bonds
Below is a weekly chart of Japanese
Government Bond (JGB) futures. The Japanese Government bond market has
been the world's leading bond market over the past few years so it is worth
paying attention to the performance of the JGBs.
We expect that resistance at around
139 will hold and that the JGBs will break below important support at around
135.5 within the next few months. However, a weekly close above 139 by
the JGBs would cast doubt on our view that a major bond market peak occurred
last June.
Gold and
the Dollar
Gold Stocks
Gold stocks are often considered to
be inversely correlated with the overall stock market and for this reason
those investors who are bullish on gold stocks are often bearish on the
broad stock market. However, it is clear that gold stocks have rallied
strongly with the broad stock market over the past year. Actually, in this
particular case gold-stock investors (including us) have benefited immensely
from a rally in the broad stock market because general market strength
has contributed to the dramatic out-performance of gold stocks relative
to the gold price.
Those who fully understand the positive
effect that the general stock-market rally has had on the gold sector would
also understand that it would be extremely improbable for gold stocks to
continue trending higher once the broad market embarks on its next major
decline. In fact, if history is any guide the gold sector will peak a few
weeks after the Dow Industrials Index reaches its ultimate recovery high
and experience a very sharp decline once the broad market enters the accelerated
phase of its next intermediate-term downtrend.
The likelihood that gold stocks won't
peak until after the Dow peaks is something we've stressed over the past
several months and is one reason we've been comfortable retaining substantial
exposure to the gold sector. In summary, as long as the broad market was
making new highs there really wasn't any need to be concerned about a major
decline in the gold sector. Now, though, we are approaching a dangerous
time for the gold sector because it's been 3-4 weeks since the Dow Industrials
Index made its most recent high for the year.
Obviously, if the Dow moves to a new
high for the year over the next few weeks -- something we think it has
a good chance of doing -- then the immediate danger for the gold sector
will subside.
The finely balanced situation in the
broad stock market isn't the only reason to be cautious at this time as
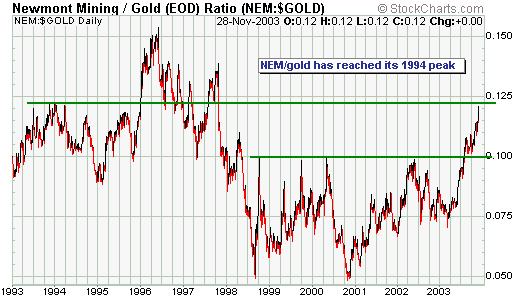
far as the gold sector is concerned. The below charts show that Newmont
Mining (NYSE: NEM) -- the world's most important gold stock -- has just
reached intermediate-term technically-based price targets relative to the
US$ and relative to gold. Specifically, NEM's break above $30 which occurred
during the second quarter of this year projected an intermediate-term upside
target of $48. This target has just been reached. Also, the NEM/gold ratio
has just moved up to its 1994 peak.
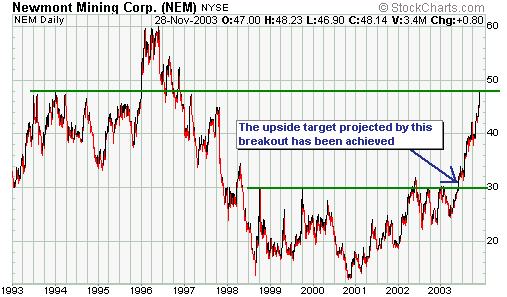
We expect that NEM will eventually
move MUCH higher, but with important technical targets and resistance levels
having just been reached and with the stock price way ahead of the gold
price the short-term risk/reward does not look attractive. If we owned
NEM we'd therefore be taking some money off the table at this time.
Now, NEM is just one stock and many
other gold stocks are not over-valued relative to the current gold price
and do not look extended from a technical perspective. Also, gold stocks
continue to trend higher relative to the gold price and our HUI-Gold Oscillator
indicates that significant upside potential remains. So perhaps its just
a case that NEM has seen its best days (for a while, at least) and that
some of the smaller gold stocks will continue to power ahead.
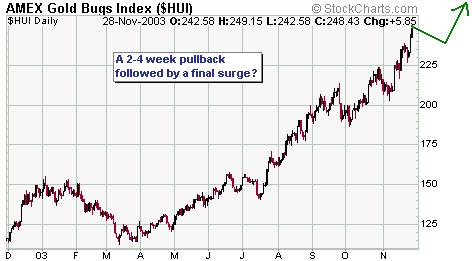
The below chart of the AMEX Gold BUGS
Index (HUI) shows what we consider to be the most likely outcome over the
next 2 months.
The recent price action in both NEM
and the HUI suggests that a pullback has a good chance of occurring over
the coming 2-4 weeks. We'd then expect a final surge to a new high for
the year, although given how expensive many of the HUI components are relative
to the metal price the ultimate high might be only slightly (5%-10%) above
the current level. We do, however, think that many of the junior gold (and
silver) stocks -- the ones that aren't expensive relative to the current
metal price -- have the potential to move considerably higher over the
next 2 months.
Currency Update
The US$ is going to fall a lot further
over the next few years because a) the current account deficit needs to
be corrected, b) we are yet to see an exodus from the dollar (net capital
in-flows have persisted despite everything that has happened over the past
few years), and c) the 'real' returns on dollar-denominated investments
are likely to remain low for the foreseeable future.
In the short-term, though, bearish
sentiment towards the dollar has become so widespread that we should be
alert to the possibility that a counter-trend rally will soon get underway.
In fact, we read an article the other day in which a currency trader was
quoted as saying the dollar was a one-way bet (meaning there was no need
to even consider the possibility that the dollar could rally). And although
we don't spend much time reading financial market commentary in the mainstream
press all the commentary we have seen over the past two weeks has been
bearish on the dollar. However, when almost everyone is in agreement that
a market is going to head in one direction it is not usual for the market
to comply.
Interestingly, bearish sentiment towards
the dollar is reaching an extreme just as the Dollar Index nears important
trend-line support (see chart below).
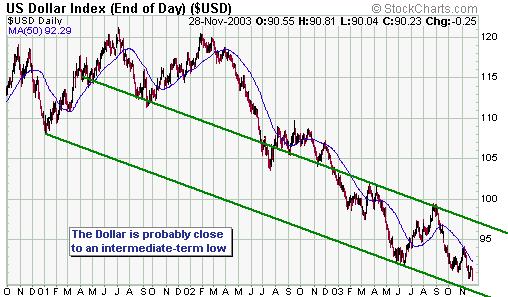
We suggest that currency traders with
a time horizon of 3 months consider scaling out of US$ short positions
from the current level in the Dollar Index down to 89 (the channel bottom
on the above chart). Alternatively, it would be reasonable to use a daily
close in the cash Dollar Index above its 50-day moving average as a 'stop'
for any short positions in the US$.
We are currently neutral on the US$
but will turn short-term bullish following a daily close in the cash Dollar
Index above its 50-day moving average.
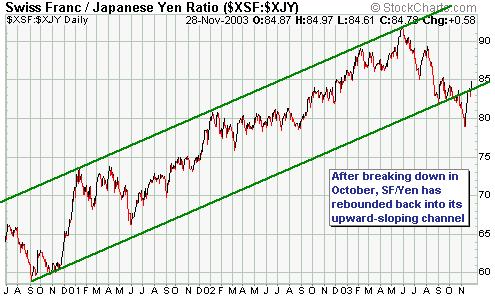
Between the third quarter of 2000 and
October of this year the Swiss Franc trended higher against the Yen. This,
in our view, was indicative of the upward trend in safety-oriented investments
relative to growth-oriented investments, a trend that has also been represented
by an upward trend in the gold price relative to the prices of industrial
metals and an upward trend in the yield-spread.
In October of this year SF/Yen broke
its 3-year up-trend (see chart below), giving us a warning signal that
growth-oriented investments were starting to get the upper hand. The situation
was certainly not clear-cut, though, because other indicators did not confirm
the breakdown in SF/Yen. Furthermore, the SF has rallied enough against
the Yen over the past 3 weeks to enable SF/Yen to recapture its former
upward trend. This doesn't mean that a trend change isn't going to occur
in the near future, but it does mean that there isn't any evidence that
a trend change has already occurred.
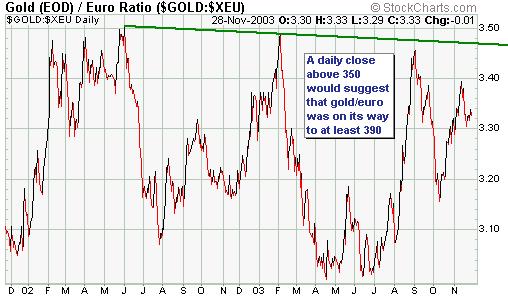
Gold
Below is a chart of the gold price
in euros. Between May of 2002 and the present the euro gold price appears
to have formed a large base. It wouldn't be surprising to see this base
continue to form for another 3-6 months, but the pattern is bullish and
once an upside breakout does occur we would expect the gold price to move
up to 390 euros in quick time.
Update
on Stock Selections
 Regardless
of whether we are talking about gold stocks or non-gold commodity stocks
or tech stocks or any other kind of stocks, general market risk is high
right now. Therefore, investors that already have substantial exposure
to the stock market -- regardless of whether that exposure is via the gold
sector or some other sector of the market -- should not be increasing their
exposure. They should, instead, be looking for opportunities to boost cash
reserves. Regardless
of whether we are talking about gold stocks or non-gold commodity stocks
or tech stocks or any other kind of stocks, general market risk is high
right now. Therefore, investors that already have substantial exposure
to the stock market -- regardless of whether that exposure is via the gold
sector or some other sector of the market -- should not be increasing their
exposure. They should, instead, be looking for opportunities to boost cash
reserves.
We recognise, though, that some of
our subscribers -- particularly some of the newer ones -- might have minimal
exposure to the market. As such, and because there exists the potential
for further large gains in the junior gold and non-gold commodity stocks
over the coming months assuming the overall market holds together, we will
continue to highlight new buying opportunities in individual stocks. In
this respect, three current members of the TSI Stocks List look particularly
interesting right now.
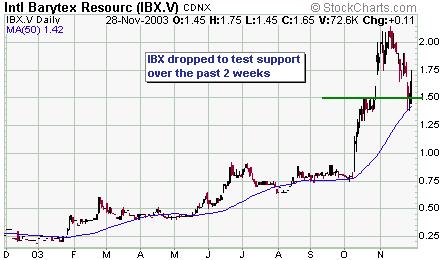
The first is International Barytex
Resources (TSXV: IBX). IBX is in the process of finalising an agreement
with a local Chinese partner and the local government to take charge of
a large tin-zinc deposit in Yunnan Province, China. The stock is very under-valued
based on the size and quality of this metal deposit, but it will be very
speculative until the aforementioned agreement is signed, sealed and delivered.
Once the agreement is finalised, though, the stock price will be considerably
higher, so if you can tolerate the risk we think it makes sense to do some
buying now in anticipation of a positive outcome. As mentioned in a previous
update, IBX has strong management.
The second is Admiral Bay Resources
(TSXV: ADB). ADB has two irons in the fire: a silver-gold project in Mexico
and a natural gas project in Canada. Either of these projects in isolation
would make ADB a worthwhile speculation at the current stock price, but
taking into account the potential of both projects ADB looks extremely
attractive. The company recently completed an equity financing and therefore
has the wherewithal to advance its projects over the next several months.
From a technical perspective, ADB has
been consolidating over the past few weeks and looks set to move higher.
The third is gold junior Canarc Resource
(TSX: CCM). Drill results achieved to date indicate that CCM's Benzdorp
project in Suriname has the potential to host a very large (several million
ounce) gold deposit. And importantly, this potential is clearly not reflected
in CCM's current market cap of only US$42M considering that the company
also owns a 1.3M ounce high-grade gold resource at its New Polaris project
in Canada.
The stocks of exploration/development-stage
gold mining companies such as CCM are often influenced more by company-specific
news, such as the latest batch of drill results, than by the general trend
in the gold sector. And one thing that makes CCM look particularly interesting
right now is that the company is scheduled to complete 48 drill holes at
Benzdorp over the next 4 months, after which a preliminary resource estimate
will be produced. This means there should be a steady stream of news from
CCM over the next several months and if that news is generally positive,
that is, if the drill results continue to point towards a large deposit
at Benzdorp, then investment demand for the stock should increase.
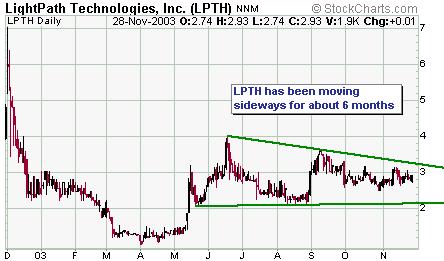
LightPath
Technologies (NASDAQ: LPTH), a long-time member of the TSI Stocks List,
has spent the past 6 months moving sideways in what appears to be a bullish
consolidation. This stock could possibly suffer from some tax-loss selling
over the next few weeks, but depending on what happens with the overall
market it could be a good stock to buy for a trade during the second half
of December in anticipation of a 'January effect' rally. Note - a 'January
effect' rally would only be likely if the market were to pullback or move
sideways over the next few weeks.
Last
week Exeter Resources (TSXV: XRC) announced the results of a scoping study
on its La Cabeza gold project in Argentina. The study showed that La Cabeza
could be developed into a mine producing 45,000-60,000 ounces of gold per
year at an operating cost per ounce of US$192 and an initial capital cost
of US$22M. The conclusion was that the project has potentially robust economics
at a gold price of $375/ounce.
With a current market cap of only US$8M
and several interesting projects in addition to La Cabeza, XRC's risk/reward
looks excellent.
NovaGold's
symbol on the TSX changed from NRI to NG over the past week and as of 2nd
December the stock will trade on the AMEX (also under the symbol NG).
The
QQQ and Dow December-2003 put options in the TSI Stocks List are going
to expire worthless within the next few weeks. We expect to begin building
another bearish position within the next two months, although rather than
using put options we will probably choose an inverse index fund such as
USPIX.
Chart Sources
Charts appearing in today's commentary
are courtesy of:
http://stockcharts.com/index.html
http://www.futuresource.com/

|
