|
-- Weekly Market Update for the Week Commencing
1st December 2014
Big Picture
View
Here is a summary of our big picture
view of the markets. Note that our short-term views may differ from our
big picture view.
In nominal dollar terms, the BULL market in US Treasury Bonds
that began in the early 1980s ended in 2012. In real (gold)
terms, bonds commenced a secular BEAR market in 2001 that will continue
until 2018-2020. (Last
update: 20 January 2014)
The stock market, as represented by the S&P500 Index,
commenced
a secular BEAR market during the first quarter of 2000, where "secular
bear market" is defined as a long-term downward trend in valuations
(P/E ratios, etc.) and gold-denominated prices. This secular trend will bottom sometime between 2014 and 2020.
(Last update: 22 October 2007)
A secular BEAR market in the Dollar
began during the final quarter of 2000 and ended in July of 2008. This
secular bear market will be followed by a multi-year period of range
trading.
(Last
update: 09 February 2009)
Gold commenced a
secular bull market relative to all fiat currencies, the CRB Index,
bonds and most stock market indices during 1999-2001.
This secular trend will peak sometime between 2014 and 2020.
(Last update: 22 October 2007)
Commodities,
as represented by the Continuous Commodity Index (CCI), commenced a
secular BULL market in 2001 in nominal dollar terms. The first major
upward leg in this bull market ended during the first half of 2008, but
a long-term peak won't occur until 2014-2020. In real (gold) terms,
commodities commenced a secular BEAR market in 2001 that will continue
until 2014-2020.
(Last
update: 09 February 2009)
Copyright
Reminder
The commentaries that appear at TSI
may not be distributed, in full or in part, without our written permission.
In particular, please note that the posting of extracts from TSI commentaries
at other web sites or providing links to TSI commentaries at other web
sites (for example, at discussion boards) without our written permission
is prohibited.
We reserve the right to immediately
terminate the subscription of any TSI subscriber who distributes the TSI
commentaries without our written permission.
Outlook Summary
Market
|
Short-Term
(1-3 month)
|
Intermediate-Term
(6-18 month)
|
Long-Term
(2-5 Year)
|
|
Gold
|
N/A |
Bullish
(26-Mar-12) |
Bullish
|
|
US$ (Dollar Index)
|
N/A |
Neutral
(29-Sep-14) |
Neutral
(19-Sep-07) |
|
US Treasury Bonds (TLT)
|
N/A |
Neutral
(18-Jan-12)
|
Bearish |
|
Stock Market
(DJW)
|
N/A |
Bearish
(28-Nov-11) |
Bearish
|
|
Gold Stocks
(HUI)
|
N/A |
Bullish
(23-Jun-10) |
Bullish
|
|
Oil |
N/A |
Neutral
(31-Jan-11) |
Bullish
|
|
Industrial Metals
(GYX)
|
N/A |
Neutral
(15-Sep-14) |
Bullish
(28-Apr-14) |
Notes:
1. Our short-term expectations are discussed in the commentaries, but except in
special circumstances we won't attempt to assign a "bullish", "bearish" or
"neutral" label to these expectations.
2. The date shown below the current outlook is when the most recent outlook change occurred.
3. "Neutral" means that we think risk and reward are roughly in balance with respect to the timeframe in question.
4. Long-term views are determined almost completely by fundamentals and intermediate-term views
are determined by a combination of fundamentals, sentiment and technicals.
Oil
Speculative Capitulation
The plunge in the oil price is obviously the big story right now. In
terms of momentum indicators this market was already near an
historic 'oversold' extreme prior to last week, but the oil price
still managed to plummet 14% last week with most of the decline
happening on Friday in reaction to news that OPEC was not going to
attempt to support the price by curtailing supply. OPEC probably
doesn't have the ability to do anything more than interrupt oil's
intermediate-term downward trend, and going into last week it
appeared as if the oil price had already discounted non-action or
ineffective action on the part of this oil-producing cartel, but
last week's news dealt a heavy blow to market sentiment nonetheless.
As explained in the 24th November Weekly Update, sentiment-wise the
oil market looked vulnerable. The reason is that despite the steep
multi-month decline in the oil price, speculators, as a group, were
maintaining a substantial net-long position in oil futures. This
suggested that whereas speculative capitulation had already happened
in some other high-profile commodity markets, it still lay ahead in
the oil market.
We won't know the extent to which oil speculators have just
capitulated until the Commitments of Traders data covering the final
three days of last week are published at the end of this week.
In momentum terms, the oil market is at a multi-decade 'oversold'
extreme
The lowest weekly RSI(14) in the oil market's modern history
occurred near the end of the 1986 crash in the oil price. Thanks to
last Friday's price action, the oil market's weekly RSI is now
comfortably below its 2008 crash extreme and very close to its 1986
crash extreme. Refer to the following chart for details.
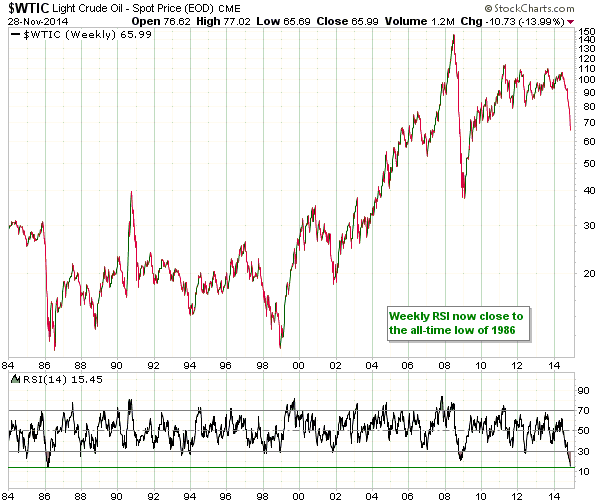
It could be relevant that the RSI low in 1986 occurred in advance of
the ultimate price low. To be more specific, after the weekly RSI
made its low the price action became far more choppy, in that there
were large swings in both directions, with the ultimate intra-day
price low being put in place about four weeks after the RSI low.
There was then a 7-week rebound and a decline to test the low prior
to the start of a substantial intermediate-term rally. If a similar
reversal pattern unfolds this time around, an intermediate-term oil
rally won't begin until next April.
Oil relative to other commodities
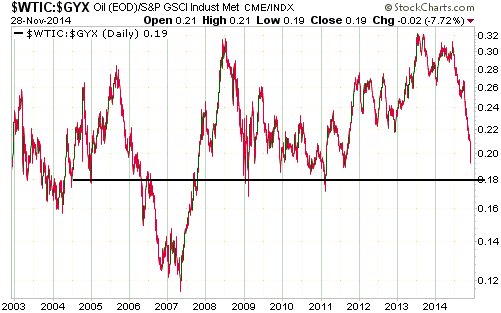
As recently as July of this year the oil price was near an all-time
high relative to the Industrial Metals Index (GYX). Based on the
historical trading range of the oil/GYX ratio, it could be said that
oil was substantially over-valued at this time.
The situation is now very different. Based, again, on the historical
trading range of the oil/GYX ratio, oil is now slightly under-valued
relative to a basket of industrial metals. Furthermore, the
following chart shows that the oil/GYX ratio is now within about 5%
of the level that most often coincided with intermediate-term lows
over the past 10 years. It moved a lot lower during 2006-2007, but
this was due to a spectacular price advance in the Industrial
Metals.
The point is that for the first time in a long time, oil now offers
reasonable value relative to the industrial metals complex. This,
however, doesn't suggest that the oil price is close to a bottom in
dollar terms.
Oil in real terms
Before presenting our long-term chart of the inflation-adjusted oil
price it is worth reiterating that we use a method of adjusting
prices for the effects of US$ inflation that was first described in
a
2010 article about the mythical "Commodity Supercycle". This
method isn't reliable over periods of two years or less, but it
should come close to reflecting reality over the long term. It
should certainly come a lot closer to reflecting reality than
adjusting for the effects of inflation using the price indices
reported by the US government or ShadowStats.com.
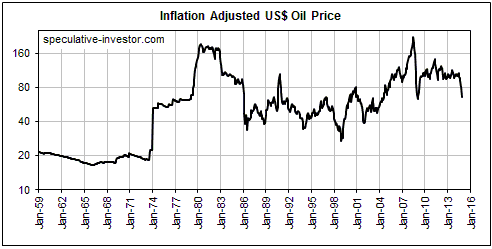
The following monthly chart shows oil's price history in terms of
today's dollar. In other words, the historical prices in this chart
have been adjusted upward to reflect the estimated effects of US$
depreciation.
In today's dollars, the lowest monthly close during the 2008 global
financial crisis was $63 in October-2008. Last Friday's closing
price was therefore within $3 of the inflation-adjusted 2008 crash
low, which also happens to be near the post-1973 average.
We therefore conclude that in inflation-adjusted terms the current
oil price is neither cheap nor expensive. It no longer reflects any
geopolitical threats to supply, but it also hasn't fully discounted
the risk of lower consumption due to economic weakness in many
important oil-consuming countries.
Economic, monetary and financial-market implications of the oil
price crash
Here are some potential implications over the next 6-12 months of
the oil price being much lower than most people were expecting prior
to the past few weeks:
1) Many bankruptcies and bond defaults within the ranks of US
companies focused on shale oil production, leading to much
downsizing and substantial job losses within this industry.
2) "Price inflation", as indicated by the horribly-flawed but
widely-watched CPI, is unlikely to be affected to a significant
degree. The reason is that a sizeable reduction in the price of oil
results in a transfer of purchasing power from oil producers and
associated industries to oil consumers; it does not result in an
overall change in currency purchasing power. In fact, ECRI's Future
Inflation Gauge suggests that the CPI will surprise on the upside
during the first half of next year. However, the reduced price of
oil has already brought about a decline in "inflation expectations",
which are monitored by the Fed with religious fervour. Because the
senior members of the Fed believe that inflation expectations must
never be allowed to fall below some arbitrary level, the lower oil
price could lead to a further extension of ZIRP. A further extension
of ZIRP could also be prompted by the fear that the problems facing
the shale-oil industry (as per item 1 above) will lead to a weaker
economy.
3) Bigger downswings than have occurred over the past two years lie
in store for the US stock market, but if the lower oil price leads
to easier monetary conditions then it could also prolong the equity
bull market.
4) Higher profit margins for gold miners.
Copper
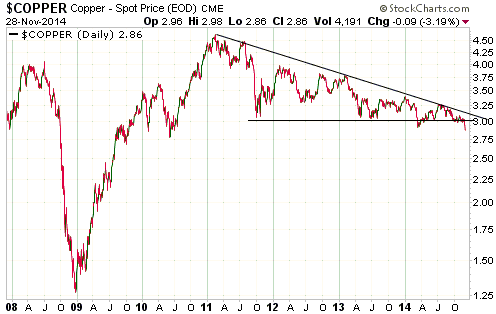
The copper price broke out to the downside in
March, but quickly reversed course and moved back above long-term support at
US$3.00. It broke out to the downside again last week. There's no way of knowing
if the latest breakdown will 'stick', but considering the overall
financial-market situation there's a high risk that it will.
We noted about 2.5 months ago that the copper market looked vulnerable and that
a price decline to the $2.70s appeared to be on the cards. However, given oil's
recent performance and copper's precarious technical position (see chart below),
the downside risk is greater than we previously thought.
We now perceive a high risk of an eventual decline to the $2.50s and an outside,
but still realistic, chance of a decline to the $2.00-$2.20 range. We estimate
that the $2.00-$2.20 range is the current-dollar equivalent of the 2008 crash
low.
Experienced option traders could consider a speculation in JJC (iPath Copper ETN)
put options, especially if there is a rebound to around $3.00 over the days
ahead.
 The
T-Bond
TLT, an ETF that holds T-Bonds, momentarily traded at a
dividend-adjusted all-time high on 16th October in parallel with a mini
stock-market panic. It pulled back as the stock market recovered, but then
resumed the upward trend that got underway almost 12 months ago.
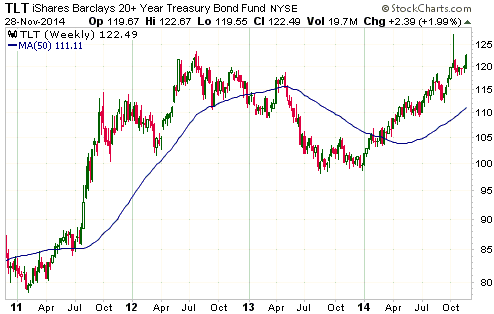
We suspect that TLT will test its October high this month and then consolidate
for 1-2 months, but for two main reasons the intermediate-term upward trend will
probably continue in 2015. The reasons are sentiment and valuation.
Sentiment remains supportive, in that, despite the consistent advance of the
past 11 months, speculators and small traders are still more bearish than
bullish on long-dated US Treasuries (remember that sentiment is a contrary
indicator). In other words, speculators and small traders continue to stubbornly
bet that a big rise in interest rates is about to happen. The way financial
markets tend to work, this popular view will probably have to be abandoned
before a big rise in interest rates really does get started.
Valuation is superficially bearish. After all, the current 2.16% nominal yield
on the 10-year T-Note probably translates into a real yield of zero or lower.
However, the yield on the 10-year bond issued by the US government looks like a
good deal for bond investors when compared with the yields on the 10-year bonds
issued by other governments. For example, the current yields on the 10-year
bonds issued by the governments of Italy, Spain, France and Japan, each of which
is in much weaker financial shape than the US government, are 2.03%, 1.89%,
0.97% and 0.41%, respectively.
The Stock
Market
Nothing significant happened in the US stock
market in the half-day that the market was open last Thursday-Friday. There are
potentially-important bearish divergences within the market, but no reversals,
yet, in the senior indices.
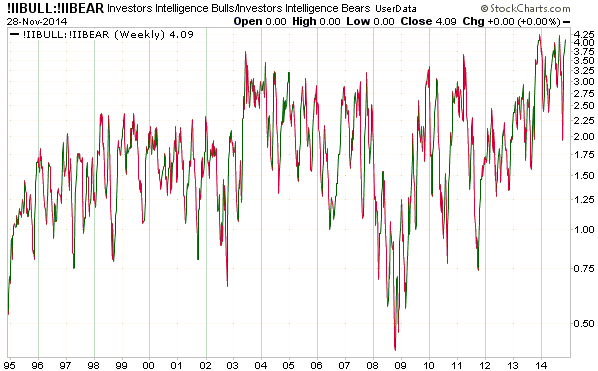
The only development worth mentioning is that the results of the latest
Investors Intelligence sentiment survey show that the bull/bear ratio has moved
back to near the multi-decade high achieved a few months ago (see chart below).
There is usually a surge in bullish sentiment during the first year of a bull
market, which means that an abnormally high bull/bear ratio isn't always a
danger sign. However, it is a danger sign when it happens in a market that has
been trending upward for a few years.
Of course, this particular danger sign first emerged almost 12 months ago, so it
is far from a guarantee that a large decline is about to begin.
Our guess is that there will be a pullback in the US stock market during the
first half of December and then a rally to a new high at the beginning of next
year.
Although we didn't make any changes to the TSI Stocks List to reflect this
trading idea, we noted a few weeks ago that we had purchased some January-2015
put options for our own account as a speculation on a decline in the US stock
market. At that time we thought that the S&P500 would do no better than test its
September peak in early-November before dropping to test its October low. This
speculation hasn't panned out.
A market decline over the coming 2 weeks could create a reasonable opportunity
to sell these options, but with or without such a market decline our intention
is to exit the position by mid-December. The reason is that the time premium in
out-of-the-money options tends to evaporate quickly during the 30 days prior to
expiry.
This week's
significant US economic events
(The most important events are shown
in bold)
| Date |
Description |
| Monday Dec 01 |
ISM Mfg Index | | Tuesday
Dec 02 |
Motor Vehicle Sales
Construction Spending | | Wednesday
Dec 03 |
Q3 Productivity and Costs
ISM Non-Mfg Index
Fed's Beige Book | | Thursday
Dec 04 |
No important events scheduled
|
| Friday Dec 05 |
Monthly Employment Report
International Trade Balance
Consumer Credit
Factory Orders |
Gold and
the Dollar
Gold
Current Market Situation
A sharp decline in the oil price is not fundamentally bearish for gold.
Furthermore, there was no significant change in gold's genuine fundamentals last
Friday (gold's fundamentals remain 'mixed'), as the bullish influence of a small
widening of credit spreads was offset by the bearish influence of a small
increase in real interest rates and a marginal new closing high for the Dollar
Index. However, based on the way that many gold traders think, it is not
surprising that the sort of price action seen in the oil market late last week
prompted a sell-off in the gold market. In fact, considering that last Friday
gave us a crash in the oil price, a decline to a new multi-year low in the
copper price, a marginal new multi-year high in the Dollar Index, a fall in
inflation expectations, a new 10-year high in the NASDAQ100 Index and stability
near all-time highs in the S&P500 Index, the gold market actually held up quite
well (the US$ gold price dropped about 2%).
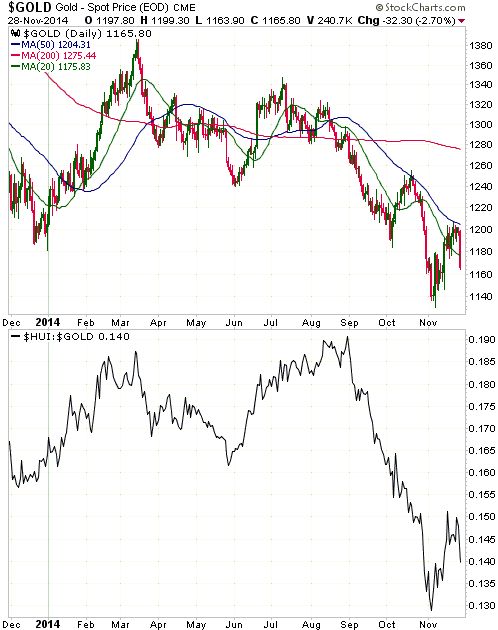
Although the gold price might not have fallen as far as it could have fallen
last Friday, it still fell far enough to end the week below its 20-day MA. We
had allowed for the possibility that there would be a pullback to the 20-day MA
in the mid-$1170s within the context of a continuing multi-week rally, so there
has been more weakness than we bargained on. Furthermore, the similarities
between the October rebound, which was followed by a plunge to a multi-year low,
and the November rebound were heightened by last Friday's price action.
However, the performance of the HUI/gold ratio during the November rebound
stands in stark contrast to its performance during the October rebound. This
makes it more likely that the next decline will do no worse than test the
early-November low
Adding to near-term uncertainty in the gold market is the Swiss Gold Referendum,
the results of which should be known later today. A "no" result is very likely
and should already be factored into the gold market, but, then again, non-action
by OPEC should have been factored into the oil market prior to Friday's plunge.
Taking the recent price action at face value and considering the news and
financial-market backdrops, the most logical conclusions are that gold's initial
rebound from its early-November low has ended and that a successful test of the
early-November low will soon happen. That's assuming a "no" result in the Swiss
Gold Referendum. If the result is unexpectedly "yes", a quick move up to
$1210-$1240 will become likely.
Revisiting the "gold backwardation" (a.k.a. negative GOFO) storm in a teacup
Back in July of last year (the 10th July 2013 Interim Update) we pointed out
that in a world where official short-term interest rates are close to zero, some
short-term market interest rates are also going to be very close to zero, and
that, in such cases, interest-rate dips below zero could occur as a result of
insignificant price fluctuations. A topical example at the time was "gold
backwardation", meaning the price of gold for immediate delivery moving above
the price of gold for future delivery. Gold backwardation is still a topical
example and, thanks to the persistence of near-zero official US$ interest rates,
is still not significant. What we mean is that the "backwardation" has almost
everything to do with the near-zero official short-term interest rate and almost
nothing to do with gold supply/demand. So please, gold analysts, stop pretending
otherwise!
When the gold market is in backwardation, something called the Gold Forward
Offered Rate (GOFO) will be negative. A negative GOFO effectively just means
that it costs more for a major bank to borrow gold than to borrow US dollars for
a short period. In a situation where the relevant short-term US$ interest rate
(LIBOR) is close to zero, why would this be important or in any way strange?
The answer is that it wouldn't be. What's strange is an official US$ interest
rate pegged near zero. Given this US$ interest rate backdrop, it is not at all
surprising that the GOFO periodically dips into negative territory.
The charts displayed below illustrate the point we are attempting to make. The
first chart shows the 1-month GOFO and the second chart shows the 1-month LIBOR.
Notice that apart from a couple of spikes in one that don't appear in the other,
these charts are essentially identical. The message is that GOFO generally
tracks LIBOR, so with the Fed having effectively pegged LIBOR near zero since
late-2008 it would be normal for GOFO to fluctuate around zero and to sometimes
be negative.
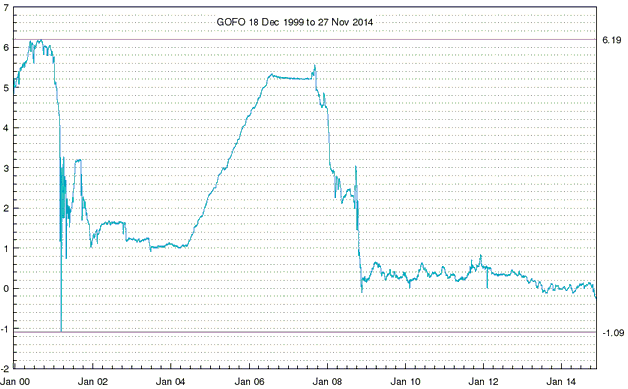
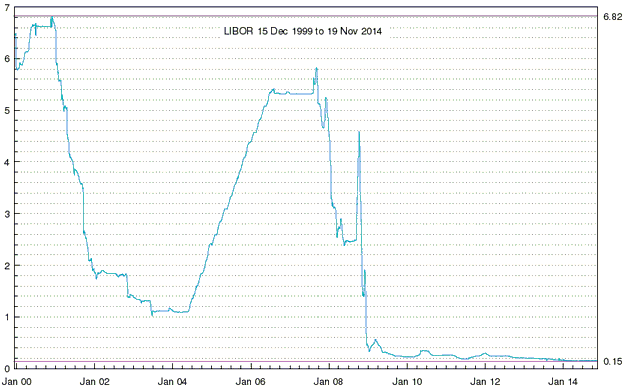
The upshot is that a negative GOFO would be a meaningful signal if LIBOR were at
a more normal level (say, 3%), but with LIBOR near zero it should be expected
that GOFO will periodically move below zero. In other words, there won't be a
useful signal from GOFO until official US$ interest rates move up to more normal
-- or at least up to less abnormal -- levels.
Two related points on gold-linked interest rates
First, the Gold Lease Rate (GLR) that you see quoted in various places is equal
to LIBOR minus GOFO. It is a derived quantity and not the actual amount that is
paid to borrow gold. The actual amount that any gold borrower pays in interest
will be negotiated on a case-by-case basis with the gold lender and will NEVER
be negative. In other words, although the derived GLR will sometimes go into
negative territory, this doesn't mean that people are being paid to borrow gold.
Second, a lower GOFO implies a higher (not lower) cost to borrow gold. GOFO's
recent dip into negative territory therefore implies that the cost to borrow
gold has risen, although the percentage changes have been tiny and, as noted
above, the lease rate paid by a specific borrower will generally not be the same
as the GLR published by the LBMA and charted at web sites such as Kitco.com.
Gold Stocks
Gold bullion held up quite well considering the financial-market backdrop last
Friday, but the same cannot be said about gold-mining stocks. With the gold
price down a bit more than 2%, the HUI was down 8% and GDXJ was down a whopping
12%.
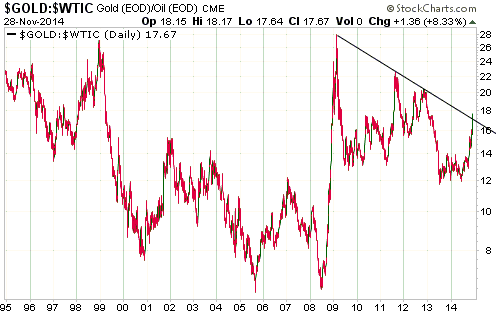
It was one of those days when fundamentals meant nothing and sentiment was
everything. We say that because although gold was down in dollar terms, it was
up sharply relative to oil. In fact, the following chart shows that last Friday
the gold/oil ratio broke above a downward-sloping trend-line that began way back
in early-2009. Since oil is a significant cost for most gold producers, this
reflects a significant improvement in the profitability of gold mining.
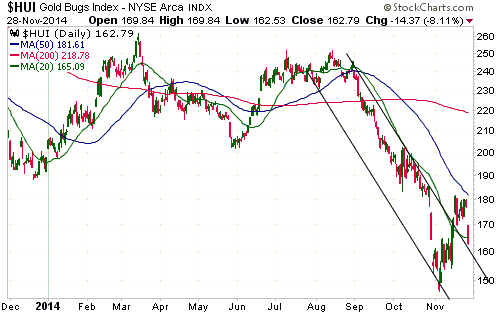
One way to interpret the HUI's recent performance is illustrated by the daily
chart displayed below. The chart shows an upside breakout from a
downward-sloping channel followed by a pullback to test the breakout. But while
this interpretation could be correct, last Friday's decline was much bigger than
would normally occur during any single day within a routine corrective move.
Friday's decline was probably exacerbated by the thin holiday-related trading in
the US, as trading volumes in the major gold stocks were low relative to the
price moves. If so, the decline will be at least partially retraced early this
week. However, as is the case with gold bullion and assuming a "no" result in
the Swiss Gold Referendum, the most logical conclusions are that the gold
sector's initial rebound from its early-November low has ended (a few HUI points
lower than expected) and that a successful test of the early-November low will
soon happen.
The Currency Market
A rise in the Dollar Index is often immediately followed by a decline in
commodity prices. This indicates that many short-term speculators in the futures
markets reflexively sell commodity futures in response to a rise in the Dollar
Index. Late last week, however, the cause-effect seemed to operate the other way
around, in that a plunge in the oil price and other commodity prices prompted
speculators to buy the US$. This is despite a sharply lower oil price providing
a greater net benefit to the economies of the euro-zone and Japan than to the US
economy. In fact, given that the oil industry has probably been the most
important contributor to US economic progress over the past few years, an
argument could be made that substantial weakness in the oil market now
constitutes a net-disadvantage for the US economy.
Short-term traders should draw 'lines in the sand' beyond which they exit their
position regardless of what they think will happen in the future. It would
therefore not be unreasonable to take Friday's marginal new closing high in the
Dollar Index as a signal to exit a bearish US$ trade. However, Friday's price
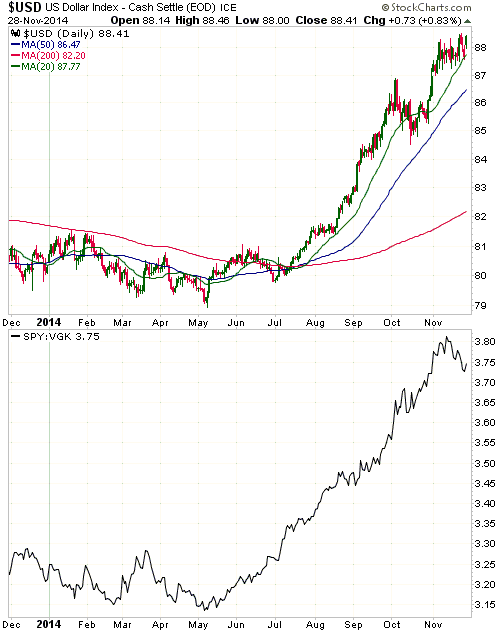
action didn't change our short-term expectations. One reason is the comparison
between the Dollar Index and the SPY/VGK ratio depicted below.
It still looks like the SPY/VGK ratio, a measure of US equity performance
relative to European equity performance (the primary driver of the US$/euro
exchange rate and the Dollar Index), has reversed downward.
Updates
on Stock Selections
Notes: 1) To review the complete list of current TSI stock selections, logon at
http://www.speculative-investor.com/new/market_logon.asp
and then click on "Stock Selections" in the menu. When at the Stock
Selections page, click on a stock's symbol to bring-up an archive of
our comments on the stock in question. 2) The Small Stock Watch List is
located at http://www.speculative-investor.com/new/smallstockwatch.html
 Company
news/developments for the week ended Friday 28th November 2014: Company
news/developments for the week ended Friday 28th November 2014:
[Note: AISC = All-In Sustaining Cost, FS = Feasibility Study, IRR = Internal
Rate of Return, MD&A = Management Discussion and Analysis, M&I = Measured and
Indicated, NAV = Net Asset Value, NPV(X%) = Net Present Value using a discount
rate of X%, P&P = Proven and Probable, PEA = Preliminary Economic Assessment,
PFS = Pre-Feasibility Study]
*Clifton Star (CFO.V) is at risk of losing its option to acquire
the remaining 90% of the Duparquet gold project in Quebec. Its current 10%
ownership and its option to acquire the remaining 90% of the project are CFO's
only significant assets.
There is a $10M option payment due immediately that the company is unable to
pay. We suspect that the option agreement will be renegotiated to give the
company more time and reduce the total obligation, as it would be in the
optionors' best interests for CFO to continue moving the project forward.
However, there is no guarantee that this will happen.
*Energold Drilling (EGD.V) published its financial results for the
September quarter. The company's drilling business generated revenue of $20M and
a net loss of $5.6M during the quarter.
Despite the reported loss, EGD's balance sheet was pretty much unchanged from
the preceding quarter. Working capital was up by about $11M to $81M, but this
was due to an increase in long-term debt. Adjusting for the addition to cash
caused by taking on some long-term debt, working capital was approximately
unchanged.
EGD is unlikely to become consistently profitable until at least 6 months after
a sustained upturn in mineral exploration, but by the time that happens the
stock is unlikely to be as much of a bargain as it is right now. Currently, the
stock is trading at around C$1.00 even though the company has C$1.42/share of
adjusted working capital (working capital minus long-term debt).
This is a good stock to pick away at during tax-loss-selling season, which runs
until year-end.
*True Gold Mining (TGM.V) published its financial results for the
September quarter. These results show that the company had about $65M of working
capital plus $60M of unused credit, or $125M of financial resources, at 30th
September. At the same time, there was about $90M budgeted to be spent to bring
the Karma gold project into production. TGM therefore has more than enough
financial resources to get to production.
 List of candidates for new buying
From within the ranks of TSI stock selections the best candidates
for new buying at this time, listed in alphabetical order, are:
1) AAU (last Friday's closing price: US$1.06).
2) EDV.TO (last Friday's closing price: C$0.47).
3) EVN.AX (last Friday's closing price: A$0.53).
4) RSG.AX (last Friday's closing price: A$0.26).
5) TGD (last Friday's closing price: US$0.93).
Note that the above list is limited to five stocks. It will
sometimes contain less than five, but it will never contain more
than five regardless of how many stocks are attractively priced for
new buying.
 Burkina Faso Risk Update
Following mass protests that succeeded in ousting the country's
president and a brief period of flux when it appeared that the
military could be taking over the government, the political
situation in Burkina Faso has stabilised. An interim president has
been appointed to lead the country to elections that are expected to
be held next year.
That being said, the situation is far from ideal for those of us
invested in mining companies operating in this West African nation.
There is still plenty of uncertainty, because there is no way of
knowing what sort of government Burkina Faso will end up with and
because the interim government has said that it will review mining
contracts signed under the former president. This review appears to
be targeting people who have accumulated numerous unexploited claims
via shady deals and is unlikely to affect foreign mine
operators/developers such as EDV.TO and TGM.V (the companies in
which we have an interest), but this type of thing creates the
perception of greater risk and discourages new investment.
Chart Sources
Charts appearing in today's commentary
are courtesy of:
http://stockcharts.com/index.html
http://www.lbma.org.uk

|

