|
-- Weekly Market Update for the Week Commencing 2nd February 2004
Big Picture
View (Most recent update: 12 January 2004)
Here is a summary of our big picture
view of the markets. Note that our short-term views may differ from our
big picture view.
Bond yields (long-term interest
rates) bottomed in June of 2003 and will move considerably higher during
2004 and 2005.
The stock market rally that
began in October of 2002 will end during the first half of 2004. The October-2002
bottom will be tested during 2005.
The Dollar will make an intermediate-term
bottom during the first half of 2004 in the vicinity of its 1995 low and
then rally for at least 6 months, but a long-term bottom won't occur until
2008-2010.
Gold will make an intermediate-term
peak during the first half of 2004 and then consolidate for at least 6
months, but a long-term peak won't occur until 2008-2010.
Commodities, as represented
by the CRB Index, will make an intermediate-term peak during the first
half of 2004 and then consolidate for at least 6 months, but a long-term
peak won't occur until 2008-2010.
Copyright
Reminder
The commentaries that appear at TSI
may not be distributed, in full or in part, without our written permission.
In particular, please note that the posting of extracts from TSI commentaries
at other web sites or providing links to TSI commentaries at other web
sites (for example, at discussion boards) without our written permission
is prohibited.
We reserve the right to immediately
terminate the subscription of any TSI subscriber who distributes the TSI
commentaries without our written permission.
TSI Vacation
As mentioned is last week's Interim
Update, we will be AWOL for the next couple of weeks. We'll be leaving
a few hours after today's Weekly Update is posted and won't be back in
the office until Friday 13th February, so the next report after this one
will be the Weekly Update on the 15th February.
While we are away we should (hopefully)
have access to e-mail and will endeavour to address any administrative
matters (forgotten passwords, access problems, billing questions, etc.)
that arise, but please note that we won't be answering any market-related
questions. If something dramatic happens in the markets while we are away,
such as a $100 single-day gain in the gold price or a 2,000-point drop
in the Dow, then we'll send out a market alert e-mail to paid-up subscribers;
but hopefully (fingers crossed) that won't be necessary.
Our expectation is that the short-term
trends that are currently in progress will continue over the next two weeks.
In particular, we expect a continuation of the corrections in gold and
gold stocks (although the bulk of the downside is probably behind us),
some additional strength in the US$, and consolidation/weakness in the
stock market.
Free-trial subscriptions will be extended
by enough to ensure that trial subscribers get access to a full month of
commentaries.
Gold and
the Dollar
Gold Stocks - Relative Value
The two main methods to assess the
value of a gold mining company are to a) estimate the value of its gold-in-the-ground
by taking into account the amount of gold reserves and the expected cost
to mine the reserves, and b) to estimate the current value of the cash-flows
that are likely to be generated by the company. We generally stick to method
a) because it is quicker, easier, and fine for our purposes, but based
on what we've observed we think the market uses a combination of a) and
b).
Using method a) we can arrive at a
rough estimate of the fair value of a gold producing company at the current
spot gold price as follows:
Enterprise Value (EV) = (gold price
- reported cash cost) x reserves, where enterprise value is the company's
stock-market capitalisation minus its net debt. For example, if a company
has 5M ounces of reserves and reports a cash cost of $200/ounce then the
company's theoretical enterprise value at a gold price of $400 would be
(400 - 200)*5M = US$1,000M. If this company had no debt and US$100M of
cash in the bank, that is, if its net debt were negative $100M, then its
theoretical market cap would be US$1,100. We could then compare this figure
with the actual market cap to estimate by how much the company is being
over-valued or under-valued by the stock market.
By starting with a company's current
enterprise value and its reported cash cost the above equation can also
be used to estimate the gold price implied by the current stock
price (implied gold price = cash cost + EV/reserves), and that is what
we've done in the below table for ten large and mid-tier gold producers.
The table is organised in terms of relative value with the best value at
the top and the worst value at the bottom.
| Company
Name |
Symbol |
Recent
Price (US$) |
Ent.
Value (US$M) |
Cash
Cost per ounce |
Reserves
(Moz) |
EV
$ per oz Res. |
Implied
Gold Price (US$) |
| Northgate
Exploration |
NXG |
2.00 |
450 |
190 |
6.0 |
75 |
265 |
| Barrick
Gold |
ABX |
19.70 |
10,655 |
205 |
87.0 |
122 |
327 |
| Gold
Fields Ltd |
GFI |
12.87 |
6,174 |
308 |
81.5 |
76 |
384 |
| Kinross
Gold |
KGC |
6.99 |
2,253 |
216 |
13.2 |
171 |
387 |
| Harmony
Gold |
HMY |
15.27 |
3,940 |
350 |
62.0 |
64 |
414 |
| Newmont |
NEM |
41.66 |
18,239 |
203 |
83.0 |
220 |
423 |
| Wheaton
River |
WHT |
2.61 |
1,590 |
100 |
4.3 |
370 |
470 |
| Agnico
Eagle |
AEM |
12.75 |
1,157 |
210 |
4.0 |
289 |
499 |
| Glamis
Gold |
GLG |
15.00 |
1,803 |
180 |
5.4 |
334 |
514 |
| Goldcorp |
GG |
13.36 |
2,446 |
93 |
5.6 |
437 |
530 |
Obviously, the above calculation leaves
out some important factors. For example, a company that is likely to achieve
rapid growth in its reserves over the next few years deserves to sell at
a premium to a slow-growing company. It does, however, provide a reasonable
starting point.
Notes:
1. The table highlights the extreme
under-valuation of Northgate (AMEX: NXG). Something that could be contributing
to NXG's relative cheapness is the fact that it has forward-sold the equivalent
of one-year's production at a low gold price, but these forward sales only
represent about 5% of reserves. Note: We've assumed that 3M ounces of the
5.4M-ounce Kemess North resource will be added to NXG's reserves when the
feasibility study is completed at the end of this quarter. This, we think,
is a reasonable assumption, although perhaps the market will need to see
the official numbers before attributing more value to NXG.
2. ABX appears to be very good value
when looked at in this way, but note that we haven't taken into account
the large unrealised loss on its hedge book. Even so, if the market began
to believe that ABX was going to be able to make a staged and not-overly-painful
exit from its excessive forward-sales position that stock would likely
experience a period of substantial out-performance relative to the more
expensive Newmont.
3. The lacklustre performance of the
Kinross stock price over the past year means that the stock is now substantially
under-valued relative to Agnico Eagle, Glamis and Goldcorp. With the exception
of Northgate, KGC appears to offer the best leverage to the gold price
amongst the large and mid-tier North American gold miners.
4. Although Gold Fields and Harmony
appear in the top half of the table, the above calculations don't do justice
to the relative attractiveness of these companies. This is because we have
used the cash costs reported by the companies for their December-2003 quarters,
but due to a weakening Rand this year's costs, in US$ terms, are likely
to be substantially lower.
5. Despite the 30% drop in its stock
price over the past two months Goldcorp is still priced for perfection.
No wonder the CEO sold 40% of his stake in December.
Central Banks and their Gold
From time to time there are discussions
in the press about how much gold the central banks are going to sell in
the future. However, although the gold price often jumps or pulls back
in knee-jerk reactions to stories about potential or actual central bank
gold sales, such news is really is just 'noise'. What central banks do
or don't do with their gold can have no bearing on the underlying price-trend
in the gold market because this trend is determined by what is happening
in the other financial markets and by the general level of confidence in
fiat currency.
The only way that the central banks
could reverse the longer-term upward trend in the gold price would be to
start pursuing responsible monetary policies. In the mean time there will
be corrections in the gold market and these corrections might happen to
coincide with central bank announcements, but there won't be a change in
the longer-term trend.
By the way, despite what they say the
large CBs must retain most of their gold reserves because without these
reserves they would not be able to maintain the illusion of control.
The Australian Dollar
Australia has a higher current account
deficit than the US (as a % of GDP), a lower savings rate than the US,
higher household debt levels than the US (as a % of household income),
and a higher money-supply growth rate than the US. And yet, the A$ has
been very strong over the past year.
In some respects, the A$ is in a similar
position now to the one in which the US$ found itself during the late 1990s
and early-2000s. Specifically, there are some major fundamental negatives
but these negatives are being offset by rising foreign-investment demand.
That is, the A$ currently sports a substantial investment premium. Furthermore,
like the US a few years ago Australia, today, has a large private-sector
deficit combined with a government surplus.
There is no evidence that the A$'s
investment premium -- which is based on relatively high nominal interest
rates and the bull market in commodities -- is about to disappear. However,
after the US$ bottoms during the next several months the A$'s inherent
weaknesses will probably result in it falling further, during the subsequent
US$ rally, than many of the other major currencies. Therefore, investors
might consider scaling-out of the A$ into strength during the first half
of this year.
We've been long-term bullish on the
A$ over the past two years and expect that it will move much higher over
the next 5 years due, more than anything else, to US$ weakness. Our concern
at this stage, though, is the coming 6-18 months. As such, for our own
account we have begun to scale-out of the A$ and expect to continue this
process over the next few months.
Current Market Situation
Gold Stocks
The following comments from last week's
Interim Update are still applicable:
"...there is no evidence that the
correction in the gold sector is over. In fact, the HUI and the XAU will
probably reach lower levels over the next two weeks. However, we now have
a more optimistic short-term view on the sector because a lot of the downside
risk appears to have been wrung-out. In particular, the XAU is now within
10% of major support ... and many of the individual stocks we follow are
close to levels at which support is likely to emerge."
And "...we think it is reasonable
for both investors and traders to do some buying now and during any additional
weakness over the next two weeks. In this regard, please refer to [the
14th January Interim Update] for some specific ideas on stocks to buy."
As far as the gold sector is concerned,
one of the biggest risks over the next few weeks is the potential for a
sharp pullback in the overall stock market. This is one reason that a scale-in
approach should be emphasized. In other words, it's reasonable to do some
buying now but don't jump in with both feet.
Our view is that the HUI might
have reached a major peak (a peak that will hold for at least 12 months)
last December, but regardless of whether it has or hasn't already peaked
we expect that a good multi-month rally will follow the current correction.
Furthermore, even if the next rally results in a lower high for the HUI
we expect that the unhedged South African majors (Harmony and Gold Fields)
and many of the exploration-stage juniors will move to new highs. In fact,
one of our favourite exploration plays -- Exeter Resources (TSXV: XRC)
-- made a new high last week and another of our favourites -- Aquiline
Resource (TSXV: AQI) - was only a few percent below its all-time high at
the end of last week.
Gold
Below is a daily chart of April gold
futures. In the 12th January Weekly Update -- with gold trading at around
$426 -- we said to expect a correction of similar duration and magnitude
to the one that occurred during June-July of last year. Our expectation
remains the same.
At this stage there is no evidence
that a bottom is in place.
For one thing, gold stocks have exhibited
a strong tendency to lead the metal at significant turning points over
the past couple of years. Last Thursday's new low in the HUI therefore
indicates that further corrective activity in the bullion market is likely
over the next few weeks.
In addition, the drop in the gold price
from $423 on 13th January to $409 on 27th January was accompanied by a
reduction of only 3,000 contracts (from 50,000 to 47,000) in the net-long
position of small traders in COMEX gold futures. This is bearish because
it means that most of the weak hands were not shaken out of their long
positions by the drop from the 420s down to the low-400s. Note, though,
that last Thursday's $16 plunge in the gold price occurred after the latest
Commitments of Traders (COT) data were issued so the next COT report will
probably be more bullish.
Both price and time are important during
any correction because when price has run too far too fast a necessary
'pause to refresh' can take the form of a short and sharp price decline
or a more modest price decline over a longer period. As far as price is
concerned, we think last Thursday's plunge has removed a lot of the short-term
downside risk. What the market probably needs now is another 2-4 weeks
to build a base in the 390s before returning to its upward path.
A sign that a bottom is in place would
be a daily close above the short-term resistance shown on the above chart.
A more definitive sign would be two consecutive daily closes above the
18-day moving average (currently at $415.50 and falling).
From a sentiment perspective, we would
like to see the net-long position of small traders in COMEX gold futures
fall to around 30,000 over the next few weeks in order to set the stage
for the next substantial advance.
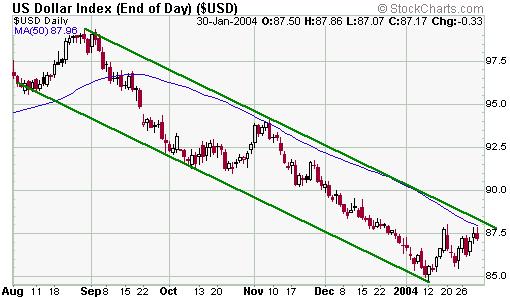
The Dollar
By moving up to near its 50-day moving
average late last week the Dollar Index has fulfilled our minimum expectation
for the current rebound. As the below chart illustrates, it is also now
quite close to the top of its short-term channel. It is therefore possible
that a top is already in place or will be put in place during the next
few days. In fact, this would become probable, rather than just possible,
if the Dollar began to move lower immediately or spiked higher and then
reversed lower during the first half of this week.
There are, however, two reasons we
expect to see a bit more upside in the Dollar over the next few weeks.
First, just as the gold stocks have tended to lead gold over the past two
years, gold has tended to lead the Dollar. It would therefore be typical
for gold to reach a correction low -- something it has probably not yet
done -- before the Dollar's rebound runs its course. Second, the
euro is still about 2% above support (the support we are referring to here
is the trend-line drawn on the below chart of March euro futures).
A sign that a correction low is already
in place for the euro would be a daily close above the short-term downtrend-line
shown on the below chart.
Silver
As mentioned in last week's Interim
Update, the silver price is likely to drop back to around $5.80 over the
next few weeks.
This week's
important economic events
| Date |
Description |
| Monday Feb 02 |
Construction Spending
ISM Index
Personal Income and Expenditure |
| Tuesday Feb 03 |
No significant events |
| Wednesday Feb 04 |
Factory Orders
ISM Non-Manufacturing Index |
| Thursday Feb 05 |
Productivity and Costs (for Q4 2003) |
| Friday Feb 06 |
Employment Report
Consumer Credit
ECRI Future Inflation Gauge
G7 Meeting begins |
 Click
here to read the rest of today's commentary Click
here to read the rest of today's commentary

|
