|
-- Weekly Market Update for the Week Commencing 2nd April 2012
Big Picture
View
Here is a summary of our big picture
view of the markets. Note that our short-term views may differ from our
big picture view.
In nominal dollar terms, the BULL market in US Treasury Bonds
that began in the early 1980s will end by 2013. In real (gold)
terms, bonds commenced a secular BEAR market in 2001 that will continue
until 2014-2020. (Last
update: 23 January 2012)
The stock market, as represented by the S&P500 Index, commenced
a secular BEAR market during the first quarter of 2000, where "secular
bear market" is defined as a long-term downward trend in valuations
(P/E ratios, etc.) and gold-denominated prices. This secular trend will bottom sometime between 2014 and 2020. (Last update: 22 October 2007)
A secular BEAR market in the Dollar
began during the final quarter of 2000 and ended in July of 2008. This
secular bear market will be followed by a multi-year period of range
trading. (Last
update: 09 February 2009)
Gold commenced a
secular bull market relative to all fiat currencies, the CRB Index,
bonds and most stock market indices during 1999-2001. This secular trend will peak sometime between 2014 and 2020. (Last update: 22 October 2007)
Commodities,
as represented by the Continuous Commodity Index (CCI), commenced a
secular BULL market in 2001 in nominal dollar terms. The first major
upward leg in this bull market ended during the first half of 2008, but
a long-term peak won't occur until 2014-2020. In real (gold) terms,
commodities commenced a secular BEAR market in 2001 that will continue
until 2014-2020. (Last
update: 09 February 2009)
Copyright
Reminder
The commentaries that appear at TSI
may not be distributed, in full or in part, without our written permission.
In particular, please note that the posting of extracts from TSI commentaries
at other web sites or providing links to TSI commentaries at other web
sites (for example, at discussion boards) without our written permission
is prohibited.
We reserve the right to immediately
terminate the subscription of any TSI subscriber who distributes the TSI
commentaries without our written permission.
Outlook Summary
Market
|
Short-Term
(0-3 month)
|
Intermediate-Term
(3-12 month)
|
Long-Term
(1-5 Year)
|
| Gold
|
Bullish
(26-Mar-12)
|
Bullish
(26-Mar-12)
|
Bullish
|
| US$ (Dollar Index)
|
Neutral
(22-Nov-11)
| Neutral
(09-Jan-12)
|
Neutral
(19-Sep-07)
|
| Bonds (US T-Bond)
|
Bearish
(05-Mar-12)
|
Neutral
(18-Jan-12)
|
Bearish
|
| Stock Market (S&P500)
|
Bearish
(23-Jan-12)
|
Bearish
(28-Nov-11)
|
Bearish
|
| Gold Stocks
(HUI)
|
Bullish
(26-Mar-12)
|
Bullish
(23-Jun-10)
|
Bullish
|
| Oil | Neutral
(31-Jan-11) | Neutral
(31-Jan-11)
| Bullish
|
| Industrial Metals
(GYX)
| Neutral
(22-Nov-11)
| Neutral
(29-Aug-11)
| Neutral
(11-Jan-10)
|
Notes:
1. In those cases where we have been able to identify the commentary in
which the most recent outlook change occurred we've put the date of the
commentary below the current outlook.
2. "Neutral", in the above table, means that we either don't have a
firm opinion or that we think risk and reward are roughly in balance with respect to the timeframe in question.
3. Long-term views are determined almost completely by fundamentals,
intermediate-term views by giving an approximately equal weighting to
fundamental and technical factors, and short-term views almost
completely by technicals.
Senior currency inflation
and its effects
In these pages we regularly mention the rate of US monetary inflation and occasionally mention the rate of euro-zone monetary inflation. Today we are going to take a slightly different tack and look at "G2 monetary inflation", where G2 is the US plus the euro-zone. In effect, the G2 monetary inflation rate is the rate at which the total supply of senior currency is being inflated, given that the world now has two senior currencies. We thought that combining the US$ and euro supplies would provide us with a useful indicator of what's happening on the inflation front. We were right.
Before we get to the US$-euro combination let's take a look at the individual monetary inflation rates, beginning with the year-over-year (YOY) rate of change in US True Money Supply (TMS).
The following monthly chart shows that the YOY rate of change in US TMS dropped below 5% in early 2000. Based on what happened during 2000-2002, this can be considered evidence that once an inflation-fueled boom has been created a decline in the money-supply growth rate to below 5% sets in motion the liquidation of the boom's mal-investments. This liquidation process leads to an economy-wide downturn, but a painful transition period cannot be avoided if the mistakes of the boom are to be eradicated and the economy is to fully recover.
These days, central banks and governments never allow the economy to fully recover from the mistakes made during an inflation-fueled boom. Instead, shortly after the liquidation of mal-investments begins in earnest they try to create a new boom. Hence, the rapid rate of increase in US money supply between early-2001 and mid-2004. In this case, the new inflation-fueled boom was focused on real estate and real-estate-related debt securities.
In the second quarter of 2005 the YOY rate of US TMS growth again dropped below 5%, but without any readily apparent effects. For example, the real-estate-focused boom continued. Why?

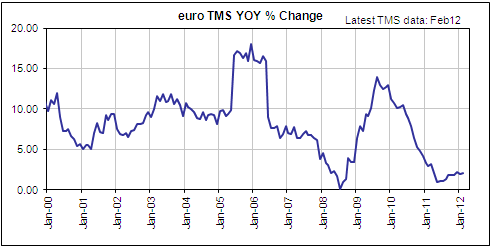
To answer the above question we must refer to the following monthly chart of the euro TMS growth rate. This chart shows that euro-zone monetary inflation exploded during the second quarter of 2005 and remained extremely high (15-20%) for the next 12 months. In other words, it seems that relatively tight monetary conditions in the US during 2005-2006 were offset by ultra-loose monetary conditions in Europe.
To complete the picture we will now address the monthly G2 monetary inflation chart, which is presented below. By the way, the data for this chart uses a 20-year average euro/US$ exchange rate of 1.21 to convert the euro supply to a US$-equivalent before adding the two money supplies. We used a single average exchange rate to convert euros to US dollars as opposed to the exchange rate applicable at each monthly data point to avoid having exchange-rate changes dominate the money-supply changes.
The chart of the G2 TMS growth rate reveals a decline below 5% in 2000 that set in motion the 2000-2002 liquidation of mal-investments. It also reveals that the rate of monetary inflation remained high until the second quarter of 2006, at which point it began a steep decline. By mid-2006 it had fallen below the apparently critical level of 5%.
Not coincidentally, mid-2006 was when the US housing bubble popped. Other markets continued to party for a while, but the price of the average US house commenced a major downward trend in mid-2006.
Between mid-2006 and mid-2008 central bankers in the US and Europe became increasingly worried about an inflation problem, even though the rate of money-supply growth was low at the time. It is important to understand that there was indeed an inflation problem worth worrying about, but that the problem had developed during 2001-2004, a period during which the central bankers were concerned about DEflation. When they finally became concerned about INflation, the world was about to experience the mother-of-all deflation scares.
Central banks reacted to the 2008 deflation scare in typical fashion, ensuring that even as perennial deflation forecasters were patting themselves on the back for having finally been proven right, they had, in actuality, never been more wrong. The central bankers and their governments swung into action as soon as they recognised that genuine deflation was a realistic possibility, the result being an avalanche of new money that pushed the G2 monetary inflation rate from a low of 2.9% in July of 2008 to a high of 14.7% in November of 2009. Again, natural market forces were prevented from fully correcting the mistakes that were made during an inflation-fueled boom.
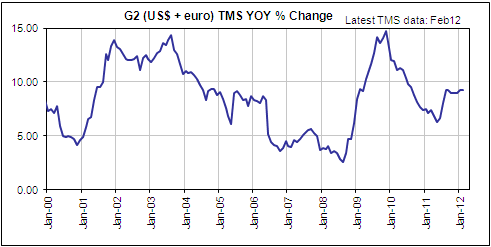
Another boom is now in progress, but this boom is relatively weak despite the abundance of monetary fuel. There are presently no signs that a collapse is imminent, in that the G2 TMS growth rate is comfortably above the critical 5% level and the ECB is 'loosening the reins' after being 'tight' during the bulk of the past 18 months. However, we must remain vigilant because the boom-bust cycle created by the central planners has severely weakened the economic foundations. As a consequence, the next bust could begin at a higher level of money-supply growth and unfold more rapidly than earlier episodes.
T-Bond rebound complete?
The following daily chart shows that T-Bond futures plunged during the first half of March and then rebounded during the second half of the month. The rebound might have ended on Friday at the bottom of the former support range (now resistance range) that extends from 139 to 140.
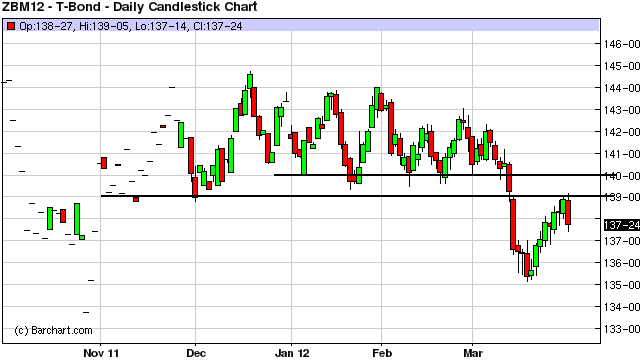
As discussed in previous commentaries, the bond market's cyclical tendencies point to an important price low during April-June. The exact timing of the T-Bond low will be influenced by the timing of the next significant stock market correction, in that the T-Bond usually gets bid-up in a 'flight to quantity' (not quality) whenever the stock market sells off.
China-related silliness
We've noticed that the closer a bull market comes to its end, the sillier the bullish arguments become. These arguments always boil down to something being so special about the bull market in question that traditional valuation metrics and/or economic theories don't apply. A classic example is the arguments that were made in the late 1990s to justify assigning multi-hundred-million dollar valuations to internet business with almost no revenues and low barriers to entry. Another great example is the arguments that get made on a regular basis for why China's "growth miracle" will continue.
The nonsense that gets put forth as justification for being bullish on China's economy typically involves treating the Chinese government's economic growth figures as facts and claiming that China has discovered the Holy Grail of economic interventionism. A generous dose of such nonsense can be found in a recent
Mineweb article.
Getting specific, the above-linked Mineweb article states: "...China's official growth forecast for the current year is 7.5% - a figure which would have all Western governments drooling..." and
"...growth of 7.5% in China ...suggests a continuing increase in huge demand for metals and minerals from around the world..." Western governments probably do drool -- at the prospect of being able to cite whatever economic growth figures they want and have financial journalists blindly accept these figures.
We never cease to be amazed at the way that Western financial journalists who are wisely sceptical of what they are told by their own governments take almost everything China's government says at face value. It's like they switch their brains off before attempting to analyse China. The reality is that China's government has no idea how fast its economy will grow this year. Furthermore, at the end of this year it will have no idea how fast its economy grew over the preceding 12 months. However, the official GDP growth reported for 2012 will almost certainly be around 7.5%, even if the economy collapses during the course of the year.
The article goes on to say:
"Don't underestimate the combination of virtually unbridled capitalism, an enormous, and rapidly growing middle class coupled with a heavily state-controlled political and economic system. Economically it leaves the Western democratic model trailing in its wake."
Unbridled capitalism hand-in-hand with heavy state control of the economy? We hopefully don't need to explain the absurdity of that statement.
Here's how the article concludes:
"Despite Western predictions of a hard landing for the Chinese economy, those who predict that should realise that China is a different animal to its Western counterparts and that economic theory, which may hold good in their own economies, may not apply in quite the same way as in countries like China with hugely tighter government controls - and the overwhelming necessity to keep its enormous population compliant and under control. It chooses to do this by meeting their economic aspirations and, to the outsider at least this seems to be a path that currently is working extremely well."
This, of course, is the plea to the "it's so different in this case that traditional valuation metrics and economic theories don't apply" idea that is often trumpeted near the ends of bull markets. (If only other governments throughout history had realised that they could keep their populations compliant and under control by magically creating a vibrant economy.)
The vastness of mal-investment in China is unprecedented and there are signs -- most notably in the property market -- that the boom is now turning to bust, but the level of control that China's central government exerts over the country's banking industry and money supply opens up the possibility that the inflation-fueled boom could be prolonged. This would mean new
extremes for mal-investment and the resultant misallocation of resources. It would also increase the severity of the eventual/inevitable bust.
We recognise the possibility that China's boom will be prolonged via another round of rapid mal-investment-inducing monetary inflation, but we think it would be imprudent to bet on such an outcome.
The Stock
Market
We continue to focus on the short-term divergence between the small-cap US stocks, as represented by the Russell2000 Index (RUT), and the large-cap US stocks, as represented by the S&P500 Index (SPX). The SPX maintained its upward trend over the past 2 months and is now comfortably above last year's high, but the top section of the following daily chart shows that the RUT essentially went nowhere over the same 2-month period and is still below last year's high. The recent weakness in the RUT relative to the SPX resulted in the sharp pullback in the RUT/SPX ratio illustrated on the bottom section of the following chart.
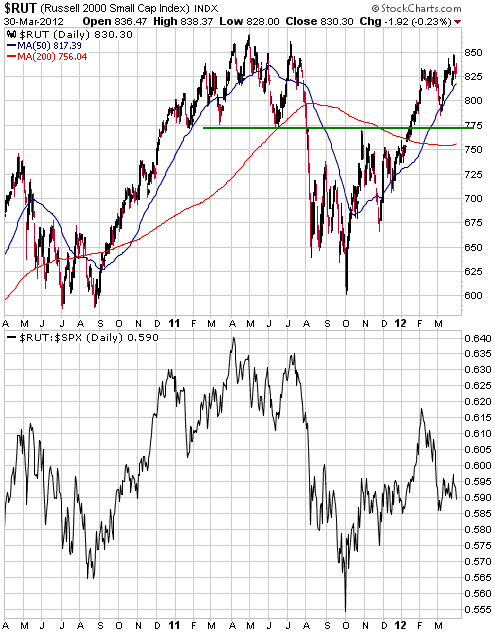
We will be interested to see how the RUT/SPX ratio performs over the next couple of weeks, especially if the SPX pulls back. If the RUT/SPX ratio holds above its early-March low while the SPX declines, it will suggest that the SPX decline is nothing more than a routine correction within a continuing short-term upward trend. However, a break to new lows for the year by RUT/SPX would be evidence that an intermediate-term peak was in place.
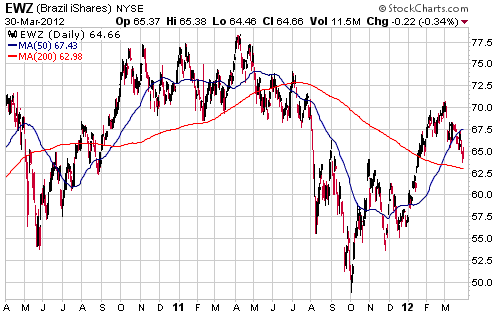
Displayed below is a daily chart of EWZ (Brazil iShares). The chart reflects the performance of the Brazilian stock market in US$ terms.
The performances of Brazil's economy and stock market are linked to the commodity markets. With the commodity markets having generally been in the doldrums over the past 12 months, so has EWZ. Despite EWZ having rebounded strongly from its October-2011 low, it is no higher now than it was 18 months ago.
We suspect that EWZ's relatively poor performance will persist throughout this year. It could therefore be a good candidate for a bearish speculation after evidence emerges that the US stock market has peaked on an intermediate-term basis.
This week's
important US economic events
| Date |
Description |
| Monday Apr 02 | ISM
Manufacturing Index
Construction Spending
| | Tuesday Apr 03 | FOMC
Minutes
Factory Orders
Motor Vehicle Sales
| | Wednesday Apr 04 | ISM
Non-Manufacturing Index | | Thursday
Apr 05 |
No important events scheduled
|
| Friday Apr 06 | Monthly
Employment Report
Consumer Credit
|
Gold and
the Dollar
Gold and Silver
In the 26th March Weekly Update we said: "...we suspect that if gold didn't bottom last week then it will bottom this week at not far below last week's low. " This opinion was based on gold-market sentiment and the close proximity of gold/euro to its 200-day moving average.
Gold didn't make a new low last week. Also, it didn't do anything to confirm that the preceding week's low would hold for long. This leaves open the possibility that a final spike to a new low still lies in store, but doesn't alter our view that the ultimate correction low won't be far from the low reached during the week before last.
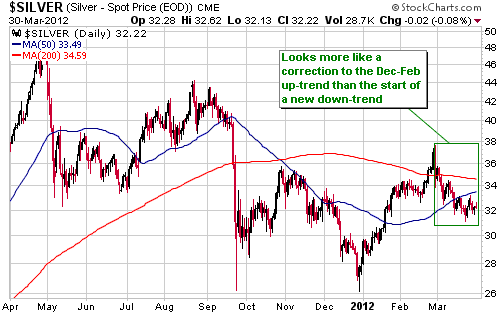
On a short-term basis silver is in a similar position to gold. There could be a final downward spike to set a short-term bottom, but if the bottom is not already in place it probably won't be far below the low of the week before last.
As noted on the daily chart displayed below, silver's price action over the past few weeks looks more like a correction to a short-term upward trend than the start of a new downward trend. If this interpretation is right then the next silver rally should exceed the late February high.
Gold Stocks
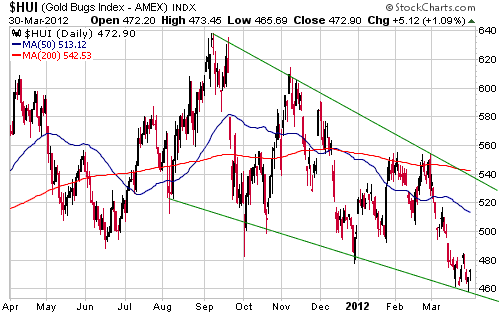
Writing a newsletter gives us insight into the sentiment associated with the types of stocks we follow. Based on feedback received from our readers over the past few weeks, we get the impression that sentiment towards gold stocks is more depressed right now than it has been at any time over the past 10 years. As far as we can tell, there was more enthusiasm for the gold sector at the financial-crisis crescendo in October-November of 2008 than there is today. This means that once a short-term bottom is in place the ensuing upward trend will probably last more than three months, but it doesn't mean that a short-term bottom is already in place.
A short-term bottom might have been put in place last week, but the price action hasn't yet confirmed it. A bottom for the HUI would be signaled by either a sharp intra-day plunge and upward reversal or two large up-days. As long as the HUI 'chops' back and forth within a horizontal range, as it did last week, the potential for a final cleansing plunge will remain.
Selling by legendary hedge-fund manager John Paulson probably had a significant adverse effect on gold bullion and the gold-stock indices during the final four months of last year. As discussed
HERE, Paulson could have had a similar effect over the past several weeks as redemptions by his investors in reaction to recent poor performance resulted in the need for his funds to reduce exposure to gold and gold stocks. However, with the first quarter now complete the downward pressure stemming from redemption-related selling by Paulson's funds should be over, at least temporarily.
Currency Market Update
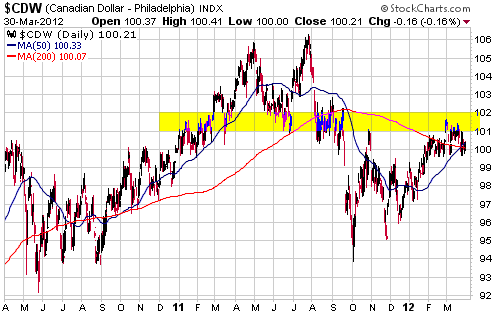
The Canadian Dollar fell alongside equity and commodity prices during May-September of last year and has since rebounded. It is possible that the rebound ended at the 101-102 resistance range in late February, but even if this is the case we doubt that there will be much weakness in the C$ over the next couple of months.
We expect to see considerable weakness in the C$ during the next intermediate-term stock market decline, which at this stage looks likely to occur during the second half of this year.
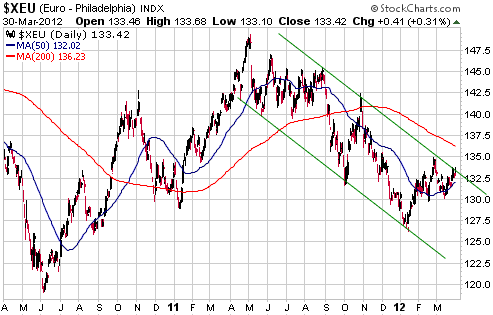
The euro ended last week at the top of the downward-sloping channel drawn on the following daily chart. There is nothing magically significant about channel lines, but they can tell us when a market is extended to the upside or the downside and they can have a psychological effect on traders.
In the euro's case, last week's touch of the channel top doesn't indicate that the market is 'overbought' on even a short-term basis. The euro has essentially been consolidating since late February and will probably soon resume its short-term upward trend (if it hasn't already done so).
The timing of the next stock market correction could determine whether the euro resumes its upward trend immediately or 2-3 weeks from now, in that stock market weakness usually goes hand-in-hand with euro weakness.
Update
on Stock Selections
Notes: 1) To review the complete list of current TSI stock selections, logon at
http://www.speculative-investor.com/new/market_logon.asp
and then click on "Stock Selections" in the menu. When at the Stock
Selections page, click on a stock's symbol to bring-up an archive of
our comments on the stock in question. 2) The Small Stock Watch List is
located at http://www.speculative-investor.com/new/smallstockwatch.html
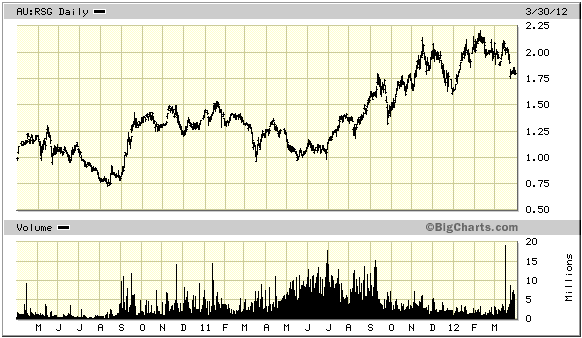
 Resolute Mining (ASX: RSG). Shares: 656M issued, 665M fully diluted. Recent price: A$1.80 Resolute Mining (ASX: RSG). Shares: 656M issued, 665M fully diluted. Recent price: A$1.80
RSG's most important asset is the Syama mine in Mali. The recent military coup in Mali has naturally increased the market's perception (and our perception) of the 'riskiness' of this asset, although the stock price has held up fairly well to date.
The article posted HERE
gives an overview of the current situation in Mali.
Due to the Tuareg rebel insurgency, northern Mali is the most unstable part of the country. Fortunately, RSG's Syama project is located in the far south of the country about 30kms from the Cote d'Ivoire border, which means that it is almost as far away from this relatively unstable region as it could be and still be in Mali.
At this stage RSG's operations haven't been materially affected by the coup, but there is more uncertainty than we would like. We are continuing to hold.
 Sandspring Resources (TSXV: SSP). Shares: 131M issued, 143M fully diluted. Recent price: C$1.00 Sandspring Resources (TSXV: SSP). Shares: 131M issued, 143M fully diluted. Recent price: C$1.00
SSP completed its $25M equity financing late last week. This should remove the downward pressure that caused the stock to underperform over the past few weeks.
We doubt that SSP will buck the sector-wide trend, but it will probably rebound strongly after the HUI reverses course. It is a good candidate for new buying near Friday's closing price of C$1.00.
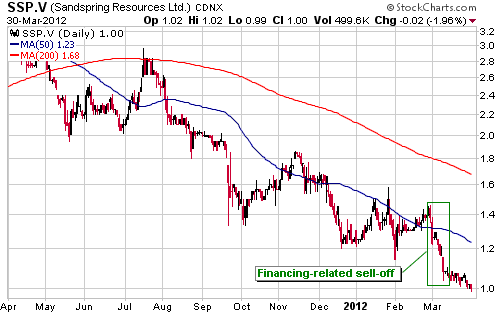
Chart Sources
Charts appearing in today's commentary
are courtesy of:
http://stockcharts.com/index.html
http://www.barchart.com/
http://bigcharts.marketwatch.com/

|

