![]()
![]()
![]()
![]()
-- Weekly Market Update for the Week Commencing 2nd April 2018
Big Picture
View
Here is a summary of our big picture
view of the markets. Note that our short-term views may differ from our
big picture view.
The BULL market in US Treasury Bonds that began in the early 1980s ended in mid-2016, but there will be many years of topping action in bond prices and bottoming action in bond yields before major new trends get underway. A major decline in government bond prices will unfold during the 2020s. (Last update: 11 September 2017)
The stock market, as represented by the S&P500 Index, commenced a secular BEAR market during the first quarter of 2000, where "secular bear market" is defined as a long-term downward trend in valuations (P/E ratios, etc.), gold-denominated prices and inflation-adjusted prices. This secular trend will bottom in 2020 or later. (Last update: 11 September 2017)
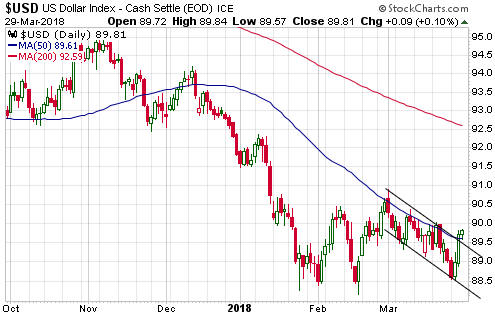
A cyclical BEAR market in the US Dollar began in 2016-2017. (Last update: 11 September 2017)
Gold commenced a secular bull market relative to all fiat currencies, the CRB Index, bonds and most stock market indices during 1999-2001. This secular trend will peak in 2020 or later. (Last update: 11 September 2017)
Commodities,
as represented by the CRB Index, commenced a
secular BULL market in 2001 in nominal dollar terms. The first major
upward leg in this bull market ended during the first half of 2008, but
a long-term peak won't occur until 2020 or later.
(Last
update: 11 September 2017)
Copyright
Reminder
The commentaries that appear at TSI
may not be distributed, in full or in part, without our written permission.
In particular, please note that the posting of extracts from TSI commentaries
at other web sites or providing links to TSI commentaries at other web
sites (for example, at discussion boards) without our written permission
is prohibited.
We reserve the right to immediately
terminate the subscription of any TSI subscriber who distributes the TSI
commentaries without our written permission.
True
Fundamentals Summary
[Notes:
1) The date shown next to the current True Fundamentals Model (TFM) signal is
when the most recent change occurred. 2) Charts of the Gold and Equity
TFMs are included in the "Charts and Indicators" section of the TSI web
site]
| Market | True Fundamentals Model (TFM) |
| Gold (US$ Price) | Bearish (12 Jan 2018) |
| US Equity (SPX) | Bearish (23 Mar 2018) |
| Currency (Dollar Index) | Bullish (15 Dec 2017) |
| Commodities (GNX) | Bullish (29 Dec 2017) |
Last week's posts at the TSI Blog
Money Matters
Summary of current
thinking/positioning
1) A number of markets are set
up for trend reversals or accelerations, with the US$ being the linchpin.
If the DX breaks out to the downside from its recent narrow range, then
rallies should begin or accelerate across the commodity world with silver
bullion and gold-mining stocks leading the way higher. However, if the DX
breaks out to the upside from its recent range then the commodity world
will be pressured downward for at least a few weeks thereafter.
2)
There is a good chance that the SPX will revisit its early-February low
(2530) before the correction comes to an end.
3) Downward
corrections in oil and copper will end by May, with the timing dependent
upon what happens in the currency market.
4) Bond yields are in
long-term upward trends and will go much higher before year-end, but a
counter-trend move is underway. The counter-trend move could end at any
time.
5) Holding a cash reserve of around 30%.
No Interim Update
this week
Please note that we'll be
traveling this week and therefore won't be able to publish an Interim
Update. The next TSI report will be the Weekly Update scheduled for
publication on Sunday 8th April.
As usual, we'll send a Market
Alert email if something happens that demands an immediate comment.
Monetary
Inflation Update
With the February-2018
money-supply data for the euro-zone becoming available last week, we've
updated our calculation of the G2 (US plus euro-zone) monetary inflation
rate. The G2 monetary inflation rate has a closer relationship to the
overall financial-market and economic backdrop than does the US monetary
inflation rate in isolation.
As illustrated by the following chart,
the G2 monetary inflation rate has dipped a little further into 'bust
territory' (the historical record suggests that 6% is the boom-bust
demarcation level) and is at a 9-year low.
The monetary backdrop
therefore remains unsupportive of equity prices and Keynesian measures of
economic performance such as GDP. Importantly (considering the effect that
changes in interest rates have on all asset prices), it is also
unsupportive of bond prices. Over the months/quarters ahead the bond
market will be dealing with declining liquidity combined with the
late-stage effects of the earlier period of abundant liquidity. These
late-stage effects include a faster rate of CPI increase.
Is it time to bet
against the T-Bond, again?
In the 19th March Weekly Update,
we wrote:
"The 30-year T-Bond broke out to the downside from a
major top formation in late-January. This breakout provided powerful
confirmation of our bearish outlook for long-term bond prices and bullish
outlook for nominal interest rates.
The T-Bond's breakout suggests
that there is scope for considerable additional downside in the price over
the coming two quarters, but by the third week of February the Treasury
market had become sufficiently 'oversold' to enable a counter-trend
rebound to get underway. The base of the major top formation (146.5-147.0)
is an obvious target for this rebound."
As illustrated below,
the T-Bond has since moved up to within one point of the 146.5-147.0
obvious rebound target. Note that if resistance at 146.5-147.0 doesn't
hold then a rise to as high as 149-150 could occur.
So, is it time to establish a new position in the ProShares UltraShort
20+ Year Treasury Fund (TBT), a leveraged ETF that moves in the opposite
direction to the T-Bond?
In our 19th March report we wrote that we
hoped to be able to re-enter TBT at around $36 in preparation for another
multi-month decline in the bond market, but that we would take our cues
from the COT data and the price action in the Treasury market. TBT traded
as low as $36.05 on Friday and, as mentioned above, the T-Bond is nearing
an obvious rebound target. However, while the COT data for last week won't
be available until Monday of this week, it's likely that the speculating
community still has a very large net-short position in 10-year T-Note
futures.
Therefore, price action suggests that it's time to start
averaging into TBT, but the sentiment situation suggests that the
sidelines are the place to be.
Once a market begins to trend
strongly in a particular direction, sentiment can stay near an extreme --
an optimistic extreme in an up-trend and a pessimistic extreme in a
down-trend -- for many months. As a consequence, there are times when
price action trumps sentiment. We suspect that this is one of those times.
To put it another way, we doubt that the rising interest-rate trend will
be derailed or even interrupted for more than a brief period simply
because speculators, as a group, have bet heavily on higher bond yields
(lower bond prices) via the futures market.
We haven't yet decided
whether to return TBT to the TSI List, but if you are interested in
speculating on a further increase in long-term interest rates it could
make sense to start averaging into a TBT position now.
The Stock Market
The Monthly Close
Going into last week the SPX/euro ratio was in a position where a
small decline over the course of the week would result in a monthly close
below the 24-month MA. If this had happened it would have been a warning
that the bull market was over, but it didn't happen. The SPX/euro ratio
gained some ground last week and ended the month above its 24-month MA.
Refer to the following monthly chart for details.
Current US Market Situation
In the Market
Alert email sent to subscribers following last Wednesday's trading
session, we wrote:
"The SPX ended Wednesday's session in
essentially the same position that it ended last week: precariously poised
within a few points of the widely-watched 200-day MA. Perhaps it will
again rebound from this obvious support level, but the risk of a 'whoosh'
to the downside is high. As mentioned in the Interim Update posted
yesterday, if this happens it should be viewed as an opportunity to take
profits on short-term bearish speculations, not as a reason to lean
further to the bearish side.
If the SPX's 200-day MA (2588) is
crossed then the next level of support will be the February low (2530).
While a test of the February low could be successful, a short-lived spike
to well below this level would have a better chance of creating a
multi-month bottom.
Note that 'market internals' are holding up
quite well and at the moment we have early signs of a bullish divergence
between the internals and the senior indices. We'll review this
potentially-bullish development in the Weekly Update."
The
chart displayed below shows that the SPX has again rebounded from the
widely-watched 200-day MA. This means that traders and trading programs
are still reflexively buying dips to support, the assumption being that
the market is experiencing nothing more than a short-term correction. This
assumption could well be on the mark, but it increases the risk of a very
sharp decline when the obvious support is eventually breached.

Not all of the important US stock indices are in the same position as
the SPX relative to their respective 200-day MAs, but many of them
rebounded from critical support levels last Thursday. Here are three
examples:
1. The NASDAQ100 ETF (QQQ) rebounded from the bottom of
what is now a well-defined 12-month price channel. This means that closing
below last Wednesday's low would be evidence that we are dealing with an
intermediate-term, rather than a short-term, correction.
2. The Dow Transportation Average (TRAN) rebounded from the bottom of
a well-defined 2-year price channel. As is the case with the QQQ, closing
below last Wednesday's low would be evidence that we are dealing with an
intermediate-term correction. Consequently, there is a lot at stake right
now.
3. The Dow Industrials Index is one of the few US stock indices that
has fully tested its February low. The Dow ended the week before last
slightly above its early-February spike low and held up relatively well
last week.
In the email excerpt presented above we mentioned early signs of a
bullish divergence between the internals and the senior indices. The
divergence is illustrated by the following daily chart. The top section of
the chart shows the NYSE Composite Index (NYA) and the bottom section
shows the numbers of NYSE common stocks making new 12-month highs (the
green bars) and new 12-month lows (the red bars) each day.
Notice
that even though the NYA achieved its lowest close of the year on Friday
23rd March, the number of individual stocks that made new lows on that day
was much smaller than the number that made new lows in early-February.
Also notice that the number of individual stocks making new lows declined
every day last week and that on Thursday (the final trading of the week)
there were more stocks making new highs than new lows.
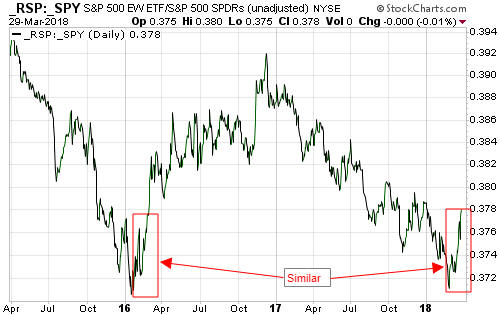
The nascent bullish divergence between the market internals and the
senior indices is also evidenced by the recent strength in the
equal-weighted SPX relative to the normal (that is, market-cap weighted)
SPX. This is illustrated by the next chart.
The bottom line is that there is no evidence yet that the correction
is over, meaning that the door is still open to a trend-ending 'whoosh' to
the downside. At the same time, there is also no evidence yet that we are
dealing with something more bearish than a multi-month correction, while
there is evidence that for the first time in well over a year the market
is stronger underneath than on the surface.
What to do?
The plan should be to exit any existing short-term bearish
speculations if there is a near-term plunge by the SPX to the vicinity of
its early-February low.
New short-term bearish speculations
shouldn't be entered unless there is a significant rebound and should
thereafter be kept on a tight leash. For example, it could make sense to
buy QID (UltraShort QQQ) or QQQ put options with an expiry date of
June-2018 if QQQ rebounds to around $165 within the coming fortnight,
while planning to exit (to mitigate losses) if QQQ subsequently closes
above $171.
Tesla and Amazon
The Tesla
(TSLA) stock price finally broke through the base of its major topping
pattern last week, creating an opportunity to take profits on TSLA April
put options.
We suspect that TSLA has just taken the first big step
along a path to zero. We therefore will be interested in entering new TSLA
bearish speculations in the future, but first a rebound is needed to
establish a better risk/reward for such a trade.
We may enter a new
TSLA bearish speculation if there is a rebound to near $290 within the
next few weeks.
Unlike Tesla, Amazon (AMZN) is capable of generating cash and profits.
However, its valuation is absurd. Furthermore, its valuation would be
absurd even if there wasn't a high risk that the US government will soon
begin to consider actions that restrain the company's growth and/or
increase its costs, but this risk exists.
AMZN not only sat out the
bulk of the Q1 stock market downturn, for a while it was actually treated
as a haven by investors seeking safety. However, last week's close below
the 50-day MA warns that the stock's speculative blow-off is complete.
Due to the extremely high valuation and the risk of much greater
government scrutiny of its business practices, it's not out of the
question that AMZN's price will drop by 50% before year-end.
This week's
significant US economic events
[Notes:
1) The most important events
(to the markets) are shown
in bold. 2) A list of global economic events can be found
HERE]
| Date | Description |
| Monday Apr-02 |
ISM Mfg Index Construction Spending |
| Tuesday Apr-03 | Motor Vehicle Sales |
| Wednesday Apr-04 |
Factory Orders ISM Non-Mfg Index |
| Thursday Apr-05 | International Trade Balance |
| Friday Apr-06 |
Monthly Employment Report Consumer Credit |
Gold and the Dollar