


--
Weekly Market Update for the Week Commencing
2nd July 2018
Big Picture
View
Here is a summary of our big picture
view of the markets. Note that our short-term views may differ from our
big picture view.
The BULL market in US Treasury Bonds
that began in the early 1980s ended in mid-2016, but there will be many years
of topping action in bond prices and bottoming action in bond yields before
major new trends get underway. A major decline in government bond prices will
unfold during the 2020s. (Last update: 11 September 2017)
The stock market, as represented by the S&P500 Index,
commenced
a secular BEAR market during the first quarter of 2000, where "secular
bear market" is defined as a long-term downward trend in valuations
(P/E ratios, etc.), gold-denominated prices and inflation-adjusted prices. This secular trend will bottom
in 2020 or later.
(Last update: 11 September 2017)
A cyclical BEAR market in the
US
Dollar
began in 2016-2017.
(Last
update: 11 September 2017)
Gold commenced a
secular bull market relative to all fiat currencies, the CRB Index,
bonds and most stock market indices during 1999-2001.
This secular trend will peak in 2020
or later.
(Last update: 11 September 2017)
Commodities,
as represented by the CRB Index, commenced a
secular BULL market in 2001 in nominal dollar terms. The first major
upward leg in this bull market ended during the first half of 2008, but
a long-term peak won't occur until 2020 or later.
(Last
update: 11 September 2017)
Copyright
Reminder
The commentaries that appear at TSI
may not be distributed, in full or in part, without our written permission.
In particular, please note that the posting of extracts from TSI commentaries
at other web sites or providing links to TSI commentaries at other web
sites (for example, at discussion boards) without our written permission
is prohibited.
We reserve the right to immediately
terminate the subscription of any TSI subscriber who distributes the TSI
commentaries without our written permission.
True
Fundamentals Summary
[Notes:
1) The date shown next to the current True Fundamentals Model (TFM) signal is
when the most recent change occurred. 2) Charts of the Gold and Equity
TFMs are included in the "Charts and Indicators" section of the TSI web
site]
|
Market |
True Fundamentals Model (TFM) |
|
Gold (US$ Price) |
Bullish (29 Jun 2018) |
|
US Equity (SPX) |
Bearish (29 Jun 2018) |
|
Currency (Dollar Index) |
Bullish (27 Apr 2018) |
|
Commodities (GNX) |
Bearish (01 Jun 2018) |
Last week's posts at the TSI Blog
Can
silver rally without gold?
Summary of current
thinking/positioning
1) With the euro and the Dollar
Index (DX) having again held above/below critical levels (1.156 for the
euro, 95 for the DX) on a weekly closing basis, the stage is set for
another multi-week euro rally and DX decline.
2) Gold and silver
prices either bottomed last week or will bottom during the first half of
July.
3) There is still a realistic chance that the SPX will make
a new all-time high in July, but risk is increasing and there are
preliminary signs that the US stock market is rolling over into what could
be a substantial decline.
4) The commodity markets are mixed, with
some stretched to the downside on a short-term basis while others, most
notably oil, are stretched to the upside.
5) The T-Bond price
should have an upward bias for at least another 2-3 months.
6)
Holding a cash reserve of around 30% and looking for opportunities to
build up this reserve.
A very
interesting monthly close
As expected, the closing prices
on Friday 29th June (the end of the week, the month and the quarter)
provided useful information about the gold and currency markets.
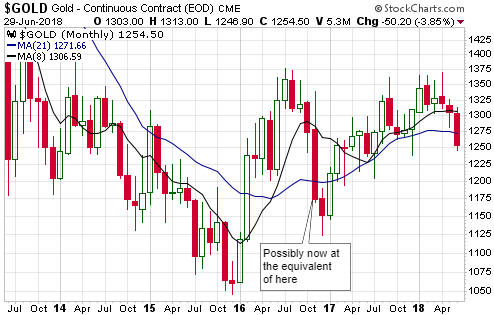
With regard to the gold market, in last week's Interim Update we wrote:
"Unless the gold price gains at least US$16 over the final two
trading days of this week it will end the month of June below its 21-month
MA and generate more evidence that gold is NOT in a bull market (not that
we need more evidence). Of greater significance as far as the next few
months are concerned, a Friday 29th June close below the 21-month MA would
suggest that there will be a spike low to create a multi-month bottom in
July, whereas a rebound over the coming two days that enables the gold
market to avoid a monthly close below the 21-month MA would suggest that a
multi-month bottom is already in place."
As illustrated by the
following monthly chart, the US$ gold price ended Friday's session well
below its 21-month MA. This warns that there may be a spike to a new low
for the year prior to the start of a rally worth trading and constitutes
additional evidence that gold is not in a bull market.
In last week's Interim Update we also wrote that the Dollar Index (DX)
has both intermediate-term lateral resistance and monthly moving-average
resistance (the 20-month MA) near 95 that should not be breached on a
weekly or monthly closing basis IF the DX commenced a bear market in
January-2017.
As illustrated by the following monthly chart, the DX
failed to end last month above the aforementioned resistance. Also, on
Friday 29th June the euro again managed to avoid a weekly close below
critical support at 1.156. Therefore, the 29th June closes kept alive the
possibility that the DX's recovery from its Q1-2018 bottom is nothing more
than a rebound within a bear market.
Developing the
right shoulder
In the 14th May Weekly Update we
wrote: "The bond market is probably close to a multi-month bottom, but
new lows in bond prices (new highs in bond yields) are likely during the
second half of this year." The T-bond bottomed later that week and
has since rebounded. The rebound has been significant, although for the
reason discussed below we expect that it will continue for at least
another 2-3 months.
Rather than look at the T-Bond itself, today
we'll look at our favourite T-Bond proxy: the iShares 20+ Year Treasury
Bond ETF (TLT). Our interpretation of the following chart is that over the
past 18 months TLT has been developing the "right shoulder" of a long-term
"head and shoulders" top. Therefore, when we write that the T-Bond rebound
probably will continue for at least another 2-3 months we mean that TLT
probably will spend more time developing its "right shoulder" before
embarking on the decline that completes the long-term topping pattern.
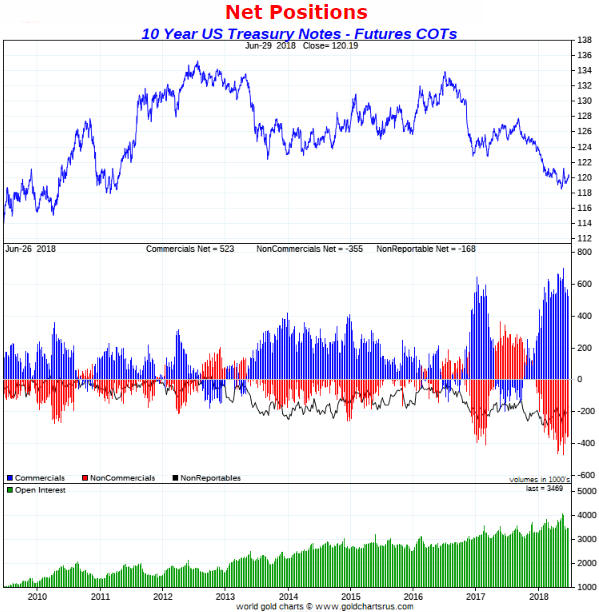
The main reason to expect T-Bonds (and TLT) to have an upward price
bias for at least a couple more months is that speculators, as a group,
are still massively short note and bond futures. Of particular
significance, the following chart shows that although the speculative
net-short position in 10-year T-Note futures has pulled back a little over
the past several weeks, it is still close to the record high reached in
May.
We expect that there will be a lot of short covering on the
part of speculators before the Treasury market commences its next
substantial downward trend. Therefore, even though much lower bond prices
(much higher bond yields) are likely within the coming 12 months, it is
too soon to return to the bearish side of the T-Bond trade.
Oil and copper go
their separate ways
Two weeks ago we thought that
the oil price correction still had a way to go, with $58 being a likely
target for a correction low. However, the correction ended prematurely and
the price then rose in a virtual straight line to a new multi-year high.

News that OPEC was going to increase production by less than expected
was the catalyst for the turnaround. Ordinarily news of this nature
wouldn't result in more than a 1-2 day bounce, but in this case it set in
motion a near-vertical 2-week price rise. The reason is that the physical
supply-demand situation in the oil market was already bullish. As pointed
out in many previous TSI commentaries, the oil futures curve tells us that
oil's physical supply-demand situation turned bullish last November and
has remained so.
Right now both the West Texas Intermediate and
Brent Crude markets are strongly 'backwardated', meaning that near-term
futures contracts are priced well above later-dated contracts. This
indicates that supply is tight relative to demand.
At the same
time, the surge of the past fortnight has left the market short-term
'overbought'. Consequently, we doubt that the price will make significant
additional headway before pulling back by a few dollars.
While the
oil price was rallying strongly over the past two weeks the copper price
was building on its early-June downward reversal. And whereas oil is now
short-term 'overbought', copper is now short-term 'oversold'. Therefore,
we won't be surprised if a near-term pullback in the oil price goes along
with a rebound in the copper price.
Both of the copper scenarios mentioned in the following excerpt from
our 18th June commentary remain plausible at this time:
"...the
extremely aggressive speculative positioning indicated by the latest COT
report combined with Friday's decisive breach of $3.20 suggests that we
are dealing with something more bearish than a routine 1-2 week
correction. It suggests that either the previous week's move up to around
$3.30 created an intermediate-term double top, in which case a decline to
as low as the $2.50s could precede the next substantial rally, or the
price will chop around between $2.95 and $3.30 for a few more months
before resuming its multi-year upward trend."
However, it goes
without saying (but we will say it anyway) that if support at $2.95 is
breached then the second of the above-mentioned scenarios will be ruled
out.
The Stock Market
The price action leaves the door
open for new all-time highs in some US stock indices this month. For
example, the NASDAQ100 Index and the Russell2000 Index have possibly
completed routine pullbacks to their respective 50-day MAs. Also, the
following daily chart shows that the SPX made a marginal new all-time high
in gold terms last week. This is a short-term bullish development given
that the SPX usually peaks in gold terms before it peaks in US$ terms.

However, other indices are already showing signs of rolling over to
the downside. For example, both the Dow Industrials Index (chart included
below) and the Dow Transportation Average ended last week below their
200-day MAs, and the Bank Index (chart also included below) is
precariously poised at the edge of a virtual cliff.
Once a large stock market decline gets underway the root cause will be
tighter monetary conditions, but the proximate cause, or catalyst, could
be the increasingly heavy-handed attempts by governments to 'manage'
international trading/investing. The so-called "trade war", which involves
threats, counter-threats, backtracking, new threats and a few actual
policy measures, is creating uncertainty and could be the pin that bursts
the confidence bubble.
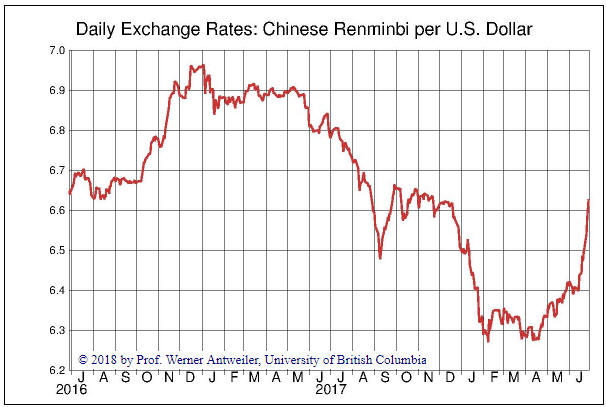
Happening in the background, but related to
the "trade war", is a recent sharp decline in China's currency. This sharp
decline is indicated by the sharp rise over the past month of the line on
the following US$/Yuan chart (the line on the chart rises when the Yuan is
weakening relative to the US$).
Now, it should be understood that
the bulk of what happened to the US$/Yuan exchange rate over the 2-year
period covered by this chart was mostly due to US$ strength/weakness. For
example, the Yuan's strength relative to the US$ during 2017 was due to
US$ weakness and the Yuan's weakness relative to the US$ during April-May
of this year was due to US$ strength. We know this because of the way the
Yuan performed against the euro. However, the June-2018 surge in the
US$/Yuan exchange rate was driven primarily by Yuan weakness.
We won't know for sure until China's central bank publishes its
international currency reserve figure for June, but the recent weakening
of the Yuan does not appear to be the result of a deliberate move by
China's government. However, regardless of its cause, if the Yuan weakness
persists it could be the catalyst for a fast stock-market decline that
drags commodity and gold stocks downward along with most other stocks.
This would be similar to what happened in reaction to a sudden bout of
Yuan weakness in August-2015.
This week's
significant US economic events
[Notes:
1) The most important events
(to the markets) are shown
in bold. 2) A list of global economic events can be found
HERE]
| Date |
Description |
|
Monday Jul-02 |
ISM Mfg Index
Construction
Spending
Canadian markets closed for public hol |
|
Tuesday Jul-03 |
Motor Vehicle Sales
Factory
Orders |
|
Wednesday Jul-04 |
US markets closed for public
hol |
|
Thursday Jul-05 |
ISM Non-Mfg Index
FOMC
Minutes |
|
Friday Jul-06 |
Monthly Employment Report |
Gold and the Dollar
Gold
The Fundamentals
Our Gold True
Fundamentals Model (GTFM) turned bearish on 12th January 2018 and remained in
bearish territory until the end of last week, when it turned bullish. Here is
the chart comparing the GTFM (in blue) with the US$ gold price (in red) from the
Charts & Indicators section of the TSI web site. The chart is updated at the end
of each week.
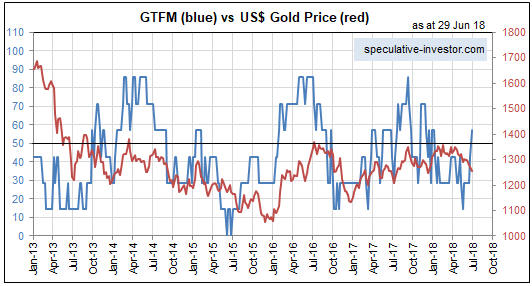
It
was a small widening of credit spreads that tipped the Model into bullish
territory last week. Be aware that the Model is vulnerable to being whipsawed at
the moment due to the credit spreads component being close to its demarcation
level, but as things currently stand the fundamental backdrop is a tailwind for
the gold price for the first time since mid-January.
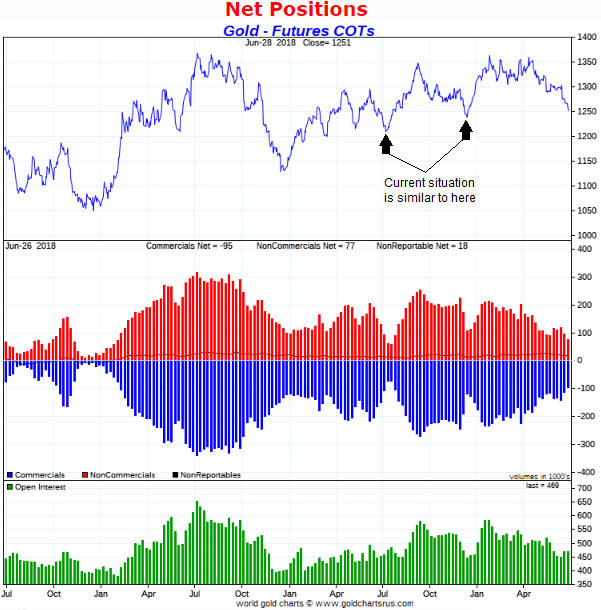
Sentiment
When assessing sentiment in
the gold and silver markets the only indicator that we need to concern ourselves
with is the Commitments of Traders (COT) information. Other sentiment indicators
just muddy the waters.
Below is a chart showing the net positions and
open interest (OI) in Comex gold futures. Taking into account both the net
speculative position and the OI, the COT situation now is much less supportive
than it was in December-2015, slightly less supportive than it was in
December-2016, and similar to what it was near the multi-month price bottoms in
July and December of last year.
Therefore, the message from the current
COT situation is that the stage is potentially set for a gold rally that lasts
about 2 months and adds $100-$150 to the price. To establish a sentiment
backdrop conducive to a larger/longer rally there probably will have to be some
additional price weakness.
The Price Action
We've been
anticipating a decline to test lateral support at $1240 (the December-2017 low)
prior to a short-term bottom. Last week the price traded as low as $1246.90,
which is close enough to the aforementioned support to be viewed as a test.
It's certainly possible that last week's low will turn out to have been a
successful test of support, but it's a little more likely that there will be a
decline to a new low during the first half of July prior to the start of a
tradable rally.
As
mentioned above, the sentiment situation suggests that if a short-term price
bottom is already in place then we may get a 2-month rise of $100-$150, but not
significantly more than that. However, additional price weakness during the
first half of July could enable a more substantial rally.
Silver
Silver traded below important support at $16.10 last Wednesday and then
quickly recovered to end the week above this support. This reversal was bullish,
but there are two reasons to be sceptical that a short-term price bottom is in
place.
The first reason is that there was minimal follow-through to the
upside after Wednesday's reversal. Specifically, after trading as low as $15.94
on Wednesday and then rebounding to end the day at $16.15, the price was able to
make an additional gain of only $0.05 by week's end. This means that the market
did the minimum it had to do to signal that a multi-month price bottom is in
place, but a more conclusive signal would have been generated by a weekly close
above $16.30.
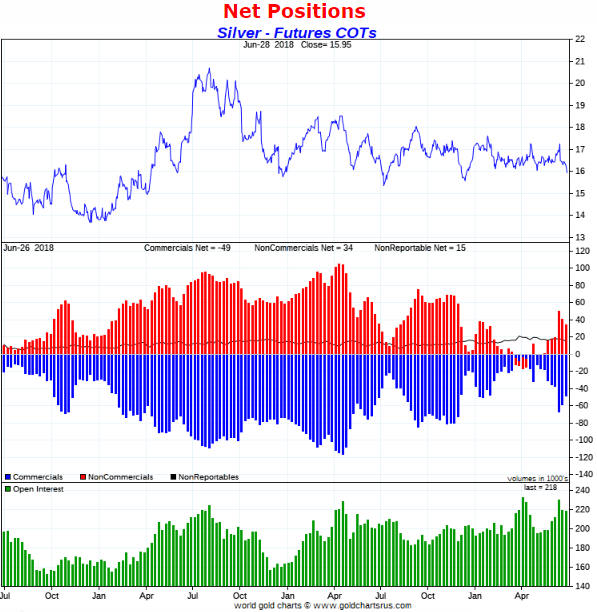
The second reason is sentiment. Taking into account the net positions and open
interest in Comex silver futures as illustrated by the following chart, the
sentiment backdrop is no better than neutral for silver. In other words,
sentiment is neither a head-wind nor a tail-wind at the moment. The market is
not yet close to being 'sold out'.
As is the case with gold, there is a better than even money chance of
additional weakness in the silver market prior to a multi-month price bottom.
Gold Stocks
The HUI tested lateral support
defined by its March low on Thursday 28th June and then reversed course. This
reversal from near support may or may not have marked a short-term bottom. It's
too soon to make an educated guess either way.
The
ducks are now pretty well lined up for a sizable gold stock rally (a rally that
lasts at least two months and results in a HUI gain of at least 30%). One
concern, however, is that there hasn't been a sharp decline or capitulation that
'clears the deck'. A capitulation is not a prerequisite for the sort of rally
mentioned above, but the fact that it hasn't happened creates a risk. The risk
is that a trend-ending capitulation is yet to come. Another concern is the
likelihood, discussed above, that gold and silver will make new lows before
commencing tradable rallies.
In any case, it would be reasonable for
short-term traders to buy gold-mining ETFs and mitigate the above-mentioned
risks by placing daily-closing stops slightly below last Thursday's intra-day
lows. If stopped out it would be a matter of waiting for a new upward reversal
before re-entering.
The Currency Market
The Euro
Critical support for the euro
lies at 1.156. The euro ended last Thursday's trading session at 1.156, so even
a small decline on Friday would have resulted in a downside breakout. As it
turned out, the euro rebounded strongly on Friday and thus avoided the bearish
signal.
The fundamental backdrop strongly favours the US$ over the euro
at this time, so we aren't confident that the euro will continue to avoid a
weekly close below 1.156. As long as it does, though, it will be reasonable to
give the benefit of the doubt to the short-term euro-bullish scenario.
The Australian Dollar (A$)
The A$ has
been pressured downward by weakness in some commodity prices and speculation
that the 'trade war' will lead to a lot more commodity-price weakness in the
future.
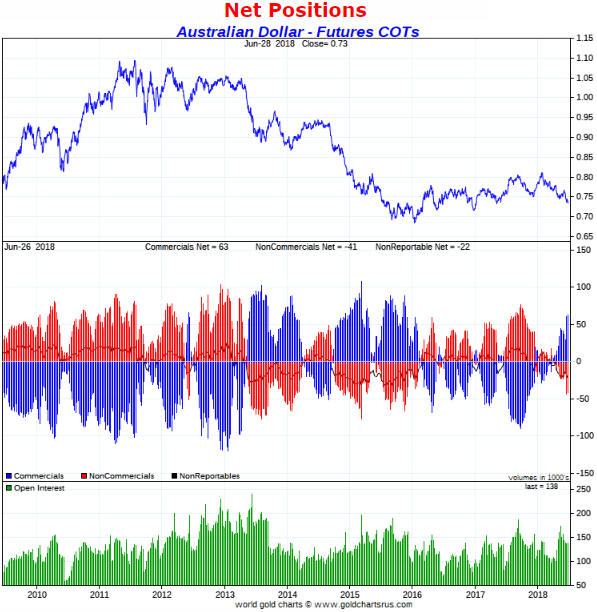
The increasing popularity of anti-A$ speculation is illustrated
by the middle section of the following chart. The blue bars in this section of
the chart indicate the commercial net position, which is the inverse of the
total speculative net position.
The chart shows that speculators in A$
futures have done an about-face over the past 9 months. Last September they had
their largest net-LONG exposure in 4 years, but thanks to a wave of speculative
short-selling over the past two weeks they now have their largest net-SHORT
exposure in 2.5 years.
It is fair to say that speculative sentiment is
now very supportive of the A$, but there's a caveat: Based on the historical
record the total speculative net-short position in A$ futures could rise from
its current level of 63K contracts to as high as 100K contracts prior to the
start of the next multi-month rally.
Updates
on Stock Selections
Notes: 1) To review the complete list of current TSI stock selections, logon at
http://www.speculative-investor.com/new/market_logon.asp
and then click on "Stock Selections" in the menu. When at the Stock
Selections page, click on a stock's symbol to bring-up an archive of
our comments on the stock in question. 2) The Small Stock Watch List is
located at http://www.speculative-investor.com/new/smallstockwatch.html
 Company
news/developments for the week ending Friday 29th June 2018:
Company
news/developments for the week ending Friday 29th June 2018:
[Note: AISC = All-In Sustaining Cost, FS = Feasibility Study, FY = Financial
Year, IRR = Internal Rate of Return, ISR = In-Situ Recovery, MD&A = Management
Discussion and Analysis, M&I = Measured and Indicated, NAV = Net Asset Value,
NPV(X%) = Net Present Value using a discount rate of X%, NSR = Net Smelter
Return, P&P = Proven and Probable, PEA = Preliminary Economic Assessment, PFS =
Pre-Feasibility Study]
*Clean TeQ (CLQ.AX, CLQ.TO)
is developing the Sunrise nickel-cobalt-scandium project in New South Wales
(NSW), Australia, and was added to the TSI List in the 30th May Interim Update.
At that time all we had to go on -- as far as the economics of the project were
concerned -- was a PFS completed in October-2016, but the results of the
project's FS were expected within the ensuing month.
The results of the
FS were reported last week.
The FS was a disappointment because it
revealed substantially worse economics than the PFS. In particular, despite the
FS being based on significantly higher metals prices than the PFS, the estimated
post-tax IRR fell from 30% in the PFS to 19.1% in the FS.
An approximate
doubling of the pre-production capex was the reason for the deterioration in the
economics. The company explained the dramatic capex increase by referring to
improvements and additional capacity, but whoever did the PFS capex estimate
obviously made some mistakes.
Fortunately, although the numbers in the FS
were worse than expected they still point to the project being economically
viable at current metal prices. Furthermore, we like the fact that the
calculated NPV uses a discount rate of 8%. This is more conservative and far
more realistic than the 5% rate favoured by many junior mining companies.
Here are the salient figures from the PFS completed almost two years ago and
the just-completed FS:
1) Oct-2016 PFS:
a) Post-tax NPV(8%) and IRR = US$891M and 25%, resp., assuming $7.50/pound
for nickel (not including any sulphate premium), $12/pound for cobalt and no
scandium production.
b) NPV and IRR increase to US$1233M and 30% with
scandium-oxide byproduct.
c) Capex: US$680M.
d) Mine life: 20
years.
2) Jun-2018 FS:
a)
Post-tax NPV(8%) and IRR = US$1392M and 19.1% assuming $8.00/pound for nickel
(including $1/pound sulphate premium), $30/pound for cobalt and 10-tpa of
scandium-oxide production.
b) NPV and IRR increase to US$1670M and 21% at
current spot prices for cobalt and nickel.
c) Capex: US$1495M
d)
Mine life: 25 years.
e) FID (Final Investment Decision) expected
early-2019, assuming that off-take agreements and financing are arranged before
year-end.
It is worth noting that in terms of tonnes, nickel production
is expected to be about 5-times cobalt production. However, in terms of dollar
value, at current metal prices the Sunrise project's nickel and cobalt
production would be roughly the same. Therefore, Sunrise is not a nickel project
with a cobalt by-product, it is a project with nickel and cobalt co-products.
With regard to construction financing, instead of trying to finance the
US$1.5B capex on its own we think it would make sense for CLQ to bring in a
partner that funds the construction in exchange for part ownership of the
project. Considering the existing business ties of the company's co-chairmen
(Robert Friedland and Jiang Zhaobai), we wonder if there is an opportunity for
CLQ to enter a JV with a large Chinese company.
When CLQ was added to the
TSI List our suggestion was to buy half a position at around A$1.03 (the price
at that time) and wait for the FS before deciding whether, and at what price, to
buy more. A decision can now be made.
Based on the FS results, CLQ's
project is not as valuable as we thought. Also, the economics of CLQ's project
are more leveraged to metal prices than we thought. The greater leverage will
begin to work in favour of CLQ when metal prices resume their bull markets, but
will work against CLQ while metal prices remain in correction mode.
The
upshot is that we think it makes sense to stay with half a position pending
evidence that the cobalt correction has run its course.
*Cobalt
27 Capital (KBLT.V) advised that it has completed its C$300M equity
financing (by issuing new shares at C$9.75/share) and its US$300M purchase of a
cobalt stream associated with the Voisey's Bay project. Despite the dilution
caused by the equity financing, this should turn out to be a very good deal for
the company IF the cobalt price is $35/pound (the current price) or higher when
metal deliveries occur (deliveries begin in January-2021).
The
combination of the heavily discounted financing price and an intermediate-term
correction in the cobalt market has resulted in a large decline in the KBLT
stock price over the past few weeks. This has created an exceptional buying
opportunity in KBLT shares, but bear in mind that the EV (Electric Vehicle)
Metals story is a marathon, not a sprint.
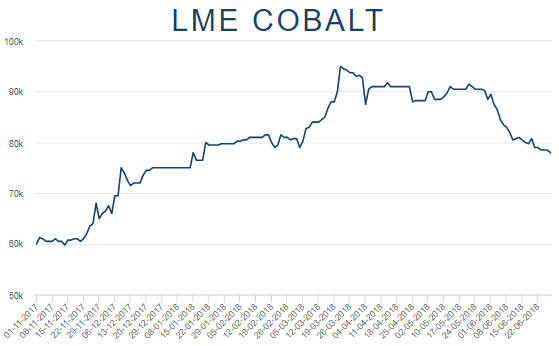
Regarding the aforementioned
cobalt correction, the following chart shows that the price peaked in March at
US$95,000/tonne (about US$43/pound) and has since dropped to US$77,500/tonne
(about US$35/pound). We don't have an opinion on when or at what price level the
correction will end.
*Nevsun Resources (NSU) announced the initial resource estimate
for the Timok Lower Zone (TLZ) copper-gold project in Serbia. The TLZ is a JV
between NSU and Freeport McMoran (FCX), with FCX being on the way to earning a
54% stake by funding all work up to the completion of a Feasibility Study.
The TLZ deposit is massive. The initial estimate is 31.5 billion pounds of
copper in the Inferred category at an average grade of 0.86% copper or 0.96%
copper-equivalent (including the gold byproduct). The deposit is also very deep,
so unlike the Timok Upper Zone there is a big question as to whether it will
make economic sense to mine it. This question won't be answered until FCX
completes a lot more exploration and engineering.
At the moment the TLZ
is classic optionality play and therefore should be assigned a low valuation. In
our NSU valuation we are being very conservative and assigning it a valuation of
ZERO, although the fact that FCX is spending a lot of money on the project
indicates that it is worth substantially more than zero.
*Premier
Gold (PG.TO) advised that development of the next two mines at its
South Arturo JV (40% PG, 60% Barrick) has been accelerated. This is good news in
that it should result in these mines having some production this year, although
it will also result in greater capital spending this year.
*Tinka
Resources (TK.V) is an exploration-stage zinc miner that was added to
the TSI List only three weeks ago. Its flagship asset is the 100%-owned Ayawilca
project in central Peru.
As noted in our initial write-up:
"The
Ayawilca project has both size and grade going for it. The current Inferred
resource estimate, which was completed in November-2017, is 42.7M tonnes grading
6% zinc or 7.3% zinc-equivalent (ZnEq). This implies 5.6 billion pounds of zinc."
And:
"Step-out drilling by TK is continuing to hit wide
intercepts of high-grade zinc outside the boundaries of the existing resource.
This guarantees that the already-large resource will grow."
The
company announced last Tuesday that step-out drilling had hit a wide intercept
of exceptionally high-grade zinc. Specifically, a recent hole intersected 10.4
metres of 44.0% (!!) zinc and also had shallower intercepts of 21.2 metres at
9.0% zinc and 6.5 metres at 11.0% zinc. Due to this hole being outside the
boundaries of the existing resource it constitutes a new discovery and suggests
the potential for substantial resource expansion.
As explained in TK's
press release:
"The new discovery opens up significant areas of
untested potential, both beneath and adjacent to the existing mineral resource.
Most of the previous drill holes at Ayawilca were stopped a few metres into the
phyllite, which had been considered to be 'basement'. A new interpretation of
the geology at West Ayawilca indicated that the favourable limestone unit could
be repeated under low angle 'thrust' faults, a concept that is now corroborated."
We are bullish on zinc, but TK's deposit is evolving in a way that could
cause it to become far more valuable over the coming 12 months even if the zinc
price doesn't go up.
List
of candidates for new buying
From within the ranks of TSI stock
selections the best candidates for new buying at this time, listed in
alphabetical order, are:
1) AAU (last Friday's closing price: US$0.72)
2) CNL.TO (last Friday's closing price: C$3.79)
3) KBLT.V (last
Friday's closing price: C$8.83)
4) PG.TO (last Friday's closing price:
C$2.61)
5) PRQ.TO (last Friday's closing price: C$1.01)
The above
list is limited to five stocks. It will sometimes contain less than five, but it
will never contain more than five regardless of how many stocks are attractively
priced for new buying.
New
TSI Stock Selection: Sabina Gold and Silver (TSX: SBB). Shares: 252M issued,
269M fully diluted. Recent price: C$1.52
In the 18th June Weekly
Update we wrote that SBB would be added to the TSI List as a trade with an
expected duration of 3-9 months if the stock price dropped to C$1.53. It traded
as low as C$1.51 on Thursday 28th June and has therefore been added.
SBB
has three significant assets. From most to least important (in terms of dollar
value), they are:
1) The Back River gold project in Nunavut, northern
Canada.
Back River has a 7.1M-oz gold resource (5.3M ounces M&I, 1.8M
ounces Inferred) and a completed FS that indicates economic viability down to
US$1000/oz for gold. At a gold price of US$1250/oz the after-tax NPV(5%) and IRR
are C$606M and 28.3%, resp.
The project is almost fully permitted (there
is one water permit outstanding) and is construction ready.
The plan is
to build a mine (actually, a combination of open-pit and underground mines) with
average annual production of 200K ounces over an initial 12-year life. The cost
to build the mine is estimated to be C$415M and first production is currently
expected in 2021.
2) A silver royalty associated with Glencore's Hackett
River zinc-silver project in Nunavut.
The royalty entitles SBB to the
cash equivalent of 22.5% of the first 190M ounces of silver production and 12.5%
of silver production thereafter. The 22.5% rate likely would translate into the
cash equivalent of 3M silver ounces per year.
This royalty will become
extremely valuable if Glencore decides to move the project into the construction
phase.
Furthermore, there is a milestone coming up in October-2018 that
could motivate Glencore to move the project into construction. We are referring
to the fact that if Glencore hasn't announced a production decision by
October-2018 then SBB will have the right to buy the project for what Glencore
has spent on it over the past few years.
3) Cash of around C$89M.
As illustrated by the following chart, SBB traded as high as C$2.70 in September
of last year. This was due to anticipation of a takeover. A takeover bid never
materialised, but an eventual takeover remains likely due to the Back River
project's robust economics and the potential value of the Hackett River silver
royalty. These are high quality assets.
We think that SBB stands a good
chance of returning to the C$2.50-C$2.70 range as long as the gold price moves
back above $1310/oz during the second half of this year.
New
TSI Stock Selection: Osisko Gold Royalties (NYSE: OR). Shares: 156M. Recent
price: US$9.47
In the 18th June Weekly Update we wrote that OR
would be added to the TSI List as a trade with an expected duration of 3-9
months if the stock price dropped to US$9.10. It traded as low as US$9.10 on
Thursday 21st June and has therefore been added.
OR is like a hedge fund
that invests in gold/silver royalties, gold/silver streaming deals, and the
equity or debt of junior gold/silver mining companies. It has a large and
complex mix of assets that we are not going to attempt to value.
We have
added an OR trading position to the TSI List based on the price chart and the
expectation that the gold-mining sector is within a few weeks of commencing a
multi-month rally. The chart (see below) shows that over the past few years the
stock price has oscillated between US$8.50-$9.00 and US$14.00, with each move
from low to high or high to low lasting 6-9 months. Buying near the bottom of
this range has worked well in the past and we think it will work well again.
OR has been added to the List at US$9.10 on the expectation that it will
rebound to around US$14 over the coming 6-9 months.
Chart Sources
Charts appearing in today's commentary
are courtesy of:
http://stockcharts.com/index.html
http://www.goldchartsrus.com/
Pacific
Exchange Rate Service
