|
-- Weekly Market Update for the Week Commencing 3rd May 2004
Big Picture
View (Most recent update: 12 January 2004)
Here is a summary of our big picture
view of the markets. Note that our short-term views may differ from our
big picture view.
Bond yields (long-term interest
rates) bottomed in June of 2003 at around 4.2% and will move considerably higher during
2004 and 2005.
The stock market rally that
began in October of 2002 will end during the first half of 2004. The October-2002
bottom (775 for the S&P500) will be tested during 2005.
The Dollar will make an intermediate-term
bottom during the first half of 2004 in the vicinity of its 1995 low (a Dollar Index value of around 80) and
then rally for at least 6 months, but a long-term bottom won't occur until
2008-2010.
Gold will make an intermediate-term
peak during the first half of 2004 and then consolidate for at least 6
months, but a long-term peak won't occur until 2008-2010.
Commodities, as represented
by the CRB Index, will make an intermediate-term peak during the first
half of 2004 and then consolidate for at least 6 months, but a long-term
peak won't occur until 2008-2010.
Copyright
Reminder
The commentaries that appear at TSI
may not be distributed, in full or in part, without our written permission.
In particular, please note that the posting of extracts from TSI commentaries
at other web sites or providing links to TSI commentaries at other web
sites (for example, at discussion boards) without our written permission
is prohibited.
We reserve the right to immediately
terminate the subscription of any TSI subscriber who distributes the TSI
commentaries without our written permission.
China and Commodities
Over the past few months the
People's Bank of China has taken measures to reduce the rate at which
credit is expanding and to bring China's economic growth rate down to a
more sustainable level. And additional measures might be necessary
because year-over-year M2 (money supply) growth and import growth are
currently running at around 20% and 40%, respectively. However, it is
unlikely that these measures will be so heavy-handed as to cause the
economy to grind to a standstill and in all likelihood China will
consume a lot more commodities this year than it did last year. So, why
have the prices of industrial metals tumbled over the past few months?
The problem, we think, is simply that prices moved too high too fast
due to speculators fully embracing the idea that surging demand from
China was soon going to create an acute shortage of metals. As is often
the case, speculative enthusiasm pushed prices way beyond where they
would otherwise have been and set the stage for a subsequent plunge.
The relationship between the 'China story' and the run-up in metals'
prices can be seen by comparing charts of the copper price and the
Shanghai Composite Index. Notice, on the below chart, that copper was
moving higher in steady fashion until last November when the price of
everything China-related (copper included) suddenly took off.
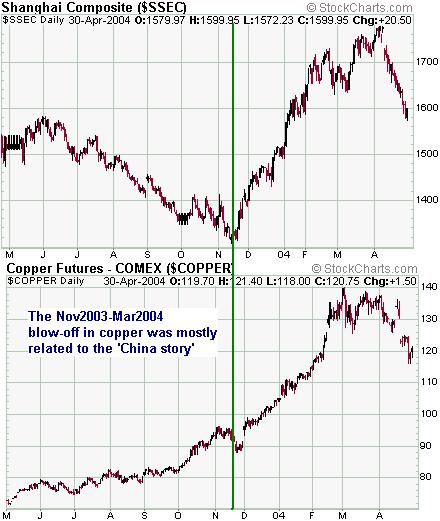
Prior to last
November the main driver of the commodity bull market appeared to be
US$ weakness. We say this because during the two years leading up to
last November commodity prices did not gain very much when measured in
terms of the European currencies.
As far as the future is concerned, we don't think we've seen the last
of US$ weakness or the strong growth in China's demand for commodities.
That is, once the speculative 'China trade' is fully unwound the
factors that underpinned the bull-run in commodities over the past few
years should re-emerge to push prices upward.
On a side note, the measures that are being taken to slow-down China's
growth rate are not bearish for gold in any way. Unlike the industrial
metals, gold is counter-cyclical -- it tends to perform best when real
growth is sub-par. Gold's recent weakness is, we think, related far
more to the market's assumption that the Fed is about to shift away
from its pro-inflation policy than it is to the goings-on in China.
This assumption by the market is most likely incorrect, but it gained
traction thanks to the large size of the speculative long position in
gold futures.
Bonds
From a technical
perspective bonds look bearish in both the short and long-term. The big
picture is that the upward drift since last August's bottom looks like
a bear-market consolidation and the post-1998 downward trend in bond
yields appears to have been broken, while the small picture is that the
bond price has broken below a short-term trend-line (refer to the
following chart). The only significant support between the current
price and the August-2003 bottom is situated at the early-January low.
From a fundamental
perspective the outlook for bonds is also bearish, but from a sentiment
perspective the short-term outlook is bullish because the 'dumb money'
is betting heavily that bond prices will fall (the net-short positions
of small traders in 5-year and 10-year T-Note futures are near 7-year
highs). This simply means that any bond-friendly news has the potential
to cause an upward spike in the bond price because it would catch the
small speculators leaning in the wrong direction. This coming week we
have an FOMC Meeting on Tuesday and the monthly employment report on
Friday, so it is certainly a week with the potential to provide some
market-moving news.
We view the bond situation as a major risk for the stock market, with
further substantial weakness in bonds likely to cause substantial
weakness in the stock market. However, due to the potential for a sharp
snapback rally in bonds at some point in the near future we don't view
the bond market as a particularly attractive short sale.
The Stock
Market
Current Market Situation
When we logged on to the internet on Saturday morning to check what had
happened in the US markets on Friday night (here in China we are 15
hours ahead of New York) one of the first things we saw was the Reuters
headline: "Stocks Fall on Interest-Rate Hike Fears".
We then observed that interest rates had actually FALLEN during the day
and that the more interest-rate sensitive sectors of the market -- the
groups that usually perform the worst when the market is worried about
higher interest rates -- had OUT-performed those sectors that are LESS
vulnerable to higher interest rates. In other words, stocks might have
fallen on Friday but the evidence suggested that fear of higher
interest rates wasn't the main driver of the decline. All of which
reminded us of why we go out of our way NOT to read the explanations
for market action contained in the mainstream financial press.
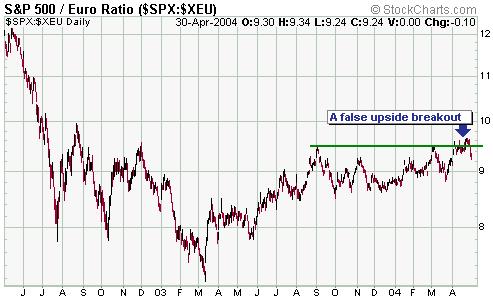
One thing the market did last week was provide some clarity by negating
some recent short-term bullish developments. For example, the
S&P500 fell enough and the euro rallied enough last week to mark
the previous week's upside breakout in the S&P500/euro ratio as a
'head fake'.
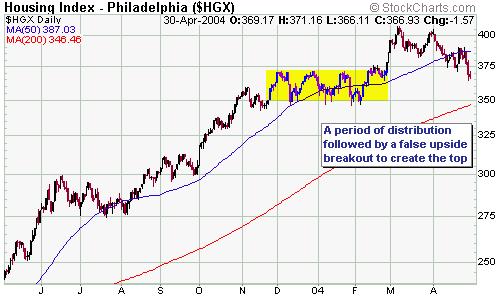
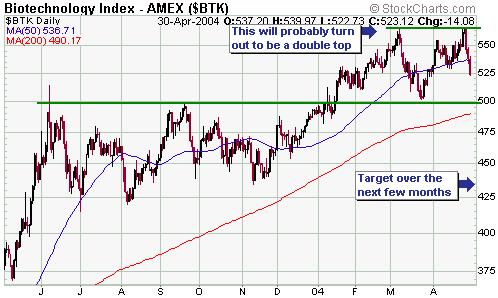
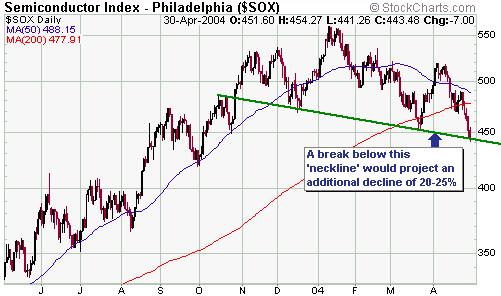
As we look through
the charts of a lot of stock sectors, three examples of which are
included below, we find that the majority appear to either be in the
process of topping or on the verge of breaking below important support.
The Housing Index (HGX), for instance, looks like it is following a
similar path to the one followed by Pan American Silver (PAAS) several
weeks ago and discussed in the 19th April Weekly Update.
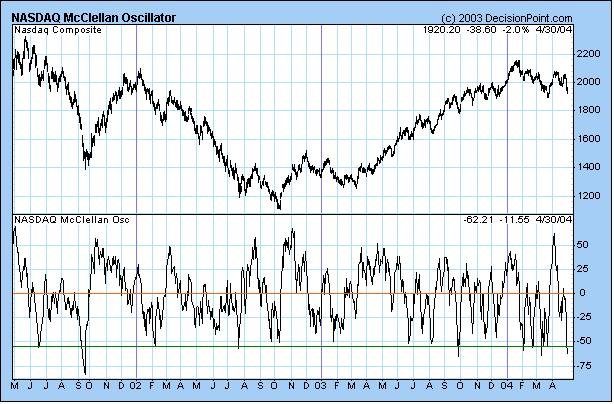
One thing to be wary
of is that on a short-term basis the market is very oversold. In
particular, the McClellan Oscillators for both the NYSE and the NASDAQ
closed at extremely low levels on Friday. We would downplay the
significance of the NYSE McClellan Oscillator (MO) right now because it
is being made to look worse than it really is by the fact that there
are such a large number of interest-rate sensitive stocks trading on
the NYSE (every time interest rates have ticked higher over the past
few months most of the rate-sensitive stocks have fallen and this has
caused the NYSE MO to reach extremely low levels). However, whenever
the NASDAQ MO (chart included below) has dropped to current levels over
the past three years the NASDAQ Composite Index has always been trading
higher 4 weeks later.
Further to the above,
we suspect that a short-term bottom will be put in place during the
first half of this week. Looking beyond the next few weeks, though, the
situation looks bearish. The sector and individual stock charts we have
reviewed suggest downside targets over the next few months that are, on
average, about 15% below current levels. This would equate to about
8700 for the Dow Industrials and 940 for the S&P500.
This week's
important US economic events
| Date |
Description |
Monday May 03
|
ISM Index
Construction Spending
|
| Tuesday May 04 |
FOMC Meeting
Factory Orders
|
| Wednesday May 05 |
ISM Non-Manufacturing Index
|
| Thursday May 06 |
Productivity and Costs
|
| Friday May 07 |
Employment Report
ECRI Future Inflation Gauge
Consumer Credit
|
Gold and
the Dollar
More thoughts on the US$ short position
In the 26th April Weekly Update we discussed the idea that there would
be the equivalent of a huge short-covering rally in the US$ due to US
individuals scrambling to pay-down their debts. Our conclusion was that
the idea didn't hold much water, primarily because the Fed's ability to
create new dollars is unlimited.
Bob Hoye provides another view on this interesting topic at http://www.gold-eagle.com/editorials_04/hoye040604.html. Mr Hoye's belief, which is based on hundreds of years of historical evidence, is that "following
a period of great financial recklessness all that is needed to make the
senior currency relentlessly strong is to have most of the debt
expanded during the boom to be contracted in the senior currency." Investors should therefore be aware that "the U.S. dollar can, despite policymakers opposing ambition, become chronically strong."
We agree with Mr Hoye's assessment that a sustained contraction of
credit (deflation) within the US would probably cause the US$ to
strengthen, but we remain long-term BEARISH on the US$ because we do
not think a sustained contraction of credit is at all likely. Our
reasoning is that in the past when persistent strength in the senior
currency followed a period of great financial recklessness the senior
central bank did not have anywhere near as much power in the field of
money/credit creation as today's Federal Reserve. This is because the
senior currency has, over the past few hundred years, generally been
convertible into gold and/or silver at a fixed rate, meaning that there
were stringent LIMITS on the senior central bank's ability to inflate.
But no such limits exist at the present time. Furthermore, we doubt
that the provider of the world's senior currency has ever been as
reliant on foriegn investment in-flows as the US is today.
Interestingly, My Hoye is long-term bullish on BOTH the US$ and gold,
once again based on the historical evidence. Once again, though, direct
comparisons with other bubble-bursts of the past few centuries might
not be appropriate because when the senior currency was officially tied
to gold then gold would naturally be a beneficiary of DEflation, rather
than INflation (as deflation pushed the relative value of the senior
currency higher it would also push the relative value of gold higher
due to the official link between the two). Under the current monetary
system, though, we would not be long-term bullish on gold unless we
were also long-term bearish on the US$.
Where we agree with Mr Hoye is that the belief in a 1970s-style
scenario became too popular during the final quarter of last year and
the first quarter of this year, leading to a speculative blow-off and
subsequent plunge in those investments that are perceived to benefit
from higher inflation. There are some similarities between the present
time and the first half of the 1970s, but for the record we are not
expecting the remainder of this decade to closely follow the path of
the 1970s. For one thing, the current bull market in the housing sector
-- housing is typically a major beneficiary of inflation -- would
almost certainly NOT survive a substantial rise in interest rates. For
another, the excesses have built up to such a level that it won't be a
matter of simply wheeling in a Volcker-like Fed Chairman at some point
later this decade to make the hard decisions and set the stage for the
next 20-year growth period. Instead, the end game this time around is
probably going to involve a complete revamping of the monetary system.
Current Market Situation
The Dollar
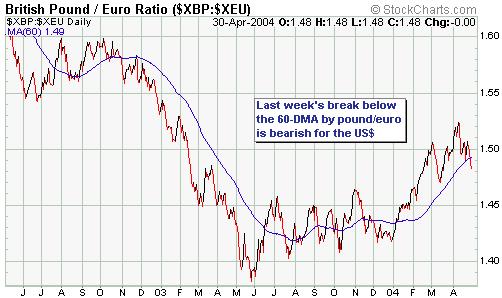
Below is a chart of the British Pound in terms of the euro. Prior to
last August pound/euro had been a reliable leading indicator of the
US$, but it made so many false moves between August and December of
2003 that we almost gave up on it. At the end of the day, though, the
final break above the 60-day moving average (the one that occurred in
early January) led the upturn in the Dollar Index by a few weeks, which
is exactly what it should do. And last week pound/euro broke back below
its 60-DMA, providing a signal that if a peak for the Dollar isn't
already in place it is not far away.
Below is a chart of
the Dollar Index. The recent price action looks similar to what
occurred when the US$ was peaking last August/September and is
therefore consistent with the message from the pound/euro ratio
discussed above. A short-term peak is probably in place for the US$.
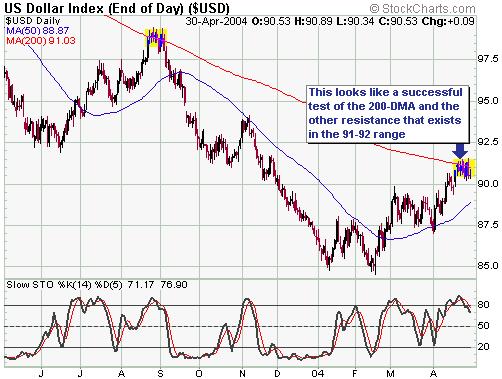
The Dollar Index
achieving two consecutive closes below its 50-day moving average would
provide additional evidence that a peak is in place. Even if this
happened, though, it wouldn't necessarily indicate that a major decline
was underway. As previously advised, we do not expect that long-term
support at around 80 on the Dollar Index will be breached this year.
Also, the recent break by the gold price to a new low for the year
suggests that we have not yet reached the point where another large
downward leg in the Dollar's bear market is about to begin. Rather, a
drop by the US$ to test its February low would appear to be the most
likely outcome over the next few months.
Gold
Before gold faked us out in March by rallying above $420, our
expectation was that a correction low would occur at $380 +/-$3. Our
reasoning, at the time, was that a) a significant move below 390 would
be needed to shakeout the weak hands and set the stage for the next big
advance, and b) the area just above the May-2003 peak was a logical
place for a low.
As can be seen on the following chart, gold achieved our original
target last week. However, because it rallied to a marginal new high
for the year in the mean time it is now in a technically weaker
position than it would have been had the drop to the 377-383 range
occurred during the first half of March.
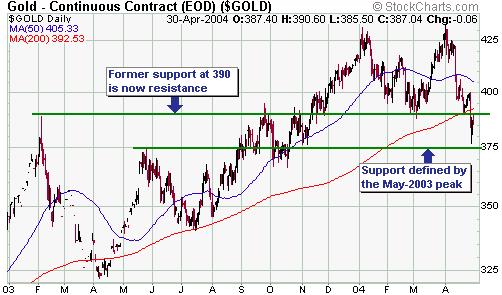
When gold broke below
390 it created a technical target of 350, but given the likelihood that
the US$ has just peaked we doubt that 350 will be seen in the near
future. On the other hand, we haven't yet seen strength in the gold
mining stocks relative to the bullion and this is something that
usually occurs prior to gold making a low. A test of last week's low
therefore looks likely. Ideally, gold will drop back to test last
week's low while gold stocks begin to advance.
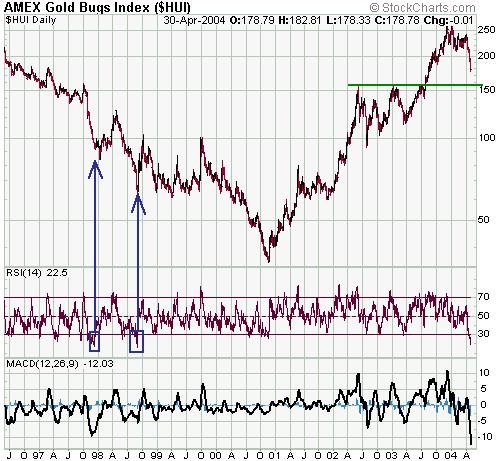
Gold Stocks
To say that the gold sector is presently 'oversold' would be an
understatement. In fact, the HUI's daily Relative Strength Index (RSI)
has only reached its current level on two other occasions in its
history (the HUI was created in mid 1996). As the below chart shows,
the prior two occasions when this happened occurred during the bear
market years of 1997 and 1998 and in both instances gold stocks
experienced a sharp rebound over the ensuing 1-3 months. The below
chart also shows that the daily Moving Average Convergence Divergence
(MACD) is now lower than it has ever been.
The HUI/Gold
Oscillator (the HUI/gold ratio divided by its 40-day moving average),
our own momentum indicator, is currently below where it was at the
October-2002 and March-2003 bottoms, but is still above where it was at
the July-2002 bottom.
The bottom line is
that the gold sector is about as oversold as it gets in either bull or
bear markets. This doesn't mean that it can't go lower in the
immediate-term (it is certainly possible for an extremely oversold
market to become even more oversold). It does mean, though, that
regardless of whether gold stocks are destined to trade much lower at
some point over the coming year (not our expectation, by the way), they
are likely to trade well above current levels at some point over the
coming 3 months.
As far as the next 1-2 weeks are concerned, we think the odds are
evenly matched as to whether the HUI commences a snapback rally
immediately or first drops to major support at around 160 and then
rallies. Whatever the case, the gold sector is probably close to its
low for the year. We certainly didn't anticipate a major low occurring
at this time, but it looks like we are going to get one.
Our longer-term view, which is supported by a mountain of fundamental
and technical evidence, is that gold and gold stocks are immersed in
bull markets that will extend through to the end of this decade.
On a side note, if you ever get yourself in a position where you NEED
the market to rally in order to sidestep a financial problem then you
must reduce your exposure regardless of what anyone thinks is going to
happen in the future. That is, you should always be in a position where
you can AFFORD to be wrong.
The above is just another way of saying that any trade/investment you
make must pass the "sleep test", meaning that if your exposure to the
market is so large that your sleep gets interrupted when the market
moves against you then you should reduce your position regardless of
what you, or anyone else, thinks is going to happen to the market in
the future. This is because you will only have a fighting chance of
consistently making the right decisions if you are able to approach the
markets with a relaxed and unemotional demeanor.
Update
on Stock Selections
 In
last week's commentary we said we would exit our position in USPIX (an
inverse index fund) with the aim of re-establishing a FULL position
following either a rally above 1600 or a technical failure by the NDX.
Last week's decisive close below 1450 constitutes a technical failure,
but given the high probability of a bounce in the market over the next
few weeks we have decided against re-purchasing a full position
immediately (if the market bounces then USPIX will trade lower).
Instead, we are going to once again build up a position in two or three
steps with the initial position being purchased at Monday's closing
price. The reason we want to buy an initial position now, as opposed to
waiting until the market moves higher, is that there is no guarantee
that the expected rally will materialise. In
last week's commentary we said we would exit our position in USPIX (an
inverse index fund) with the aim of re-establishing a FULL position
following either a rally above 1600 or a technical failure by the NDX.
Last week's decisive close below 1450 constitutes a technical failure,
but given the high probability of a bounce in the market over the next
few weeks we have decided against re-purchasing a full position
immediately (if the market bounces then USPIX will trade lower).
Instead, we are going to once again build up a position in two or three
steps with the initial position being purchased at Monday's closing
price. The reason we want to buy an initial position now, as opposed to
waiting until the market moves higher, is that there is no guarantee
that the expected rally will materialise.
We will continue to provide ideas at TSI on ways to potentially profit
from what will probably be a sizeable decline in the stock market over
the next six months, but as mentioned many times in previous
commentaries we think the best approach for most people is to simply
maintain a hefty cash reserve. In this way you ensure that you will be
in a position to take full advantage of the buying opportunity that
will emerge following a large decline but are not in a position where
an upward move in the market will cost you anything (there is no
CERTAINTY that the market will fall over the next several months, it's
just our assessment of the most LIKELY outcome).
 Corvis
Corp. (NASDAQ: CORV) released its March quarter financial report last
Friday. It was a good report -- generally better than expected and
proving that the company's business plan is coming together -- but
didn't do much for the stock price due to the weakness in the broad
market. We liked Corvis as an investment (not a trade) at $1.80 and we
like it even more in the 1.50s. Corvis
Corp. (NASDAQ: CORV) released its March quarter financial report last
Friday. It was a good report -- generally better than expected and
proving that the company's business plan is coming together -- but
didn't do much for the stock price due to the weakness in the broad
market. We liked Corvis as an investment (not a trade) at $1.80 and we
like it even more in the 1.50s.
Aquiline
Resource (TSXV: AQI) announced positive metallurgical test results for
its Calcatreu gold project on Friday. Importantly, the company also
confirmed that more drilling results and an updated resource
calculation would be announced within the next two weeks.
Chart Sources
Charts appearing in today's commentary
are courtesy of:
http://stockcharts.com/index.html
http://www.decisionpoint.com/

|