|
-- Weekly Market Update for the Week Commencing 3rd August 2009
Big Picture
View
Here is a summary of our big picture
view of the markets. Note that our short-term views may differ from our
big picture view.
In nominal dollar terms, the BULL market in US Treasury Bonds
that began in the early 1980s will end by mid-2010. In real (gold)
terms, bonds commenced a secular BEAR market in 2001 that will continue
until 2014-2020. (Last
update: 09 February 2009)
The stock market, as represented by the S&P500 Index, commenced
a secular BEAR market during the first quarter of 2000, where "secular
bear market" is defined as a long-term downward trend in valuations
(P/E ratios, etc.) and gold-denominated prices. This secular trend will bottom sometime between 2014 and 2020. (Last update: 22 October 2007)
A secular BEAR market in the Dollar
began during the final quarter of 2000 and ended in July of 2008. This
secular bear market will be followed by a multi-year period of range
trading. (Last
update: 09 February 2009)
Gold commenced a
secular bull market relative to all fiat currencies, the CRB Index,
bonds and most stock market indices during 1999-2001. This secular trend will peak sometime between 2014 and 2020. (Last update: 22 October 2007)
Commodities,
as represented by the Continuous Commodity Index (CCI), commenced a
secular BULL market in 2001 in nominal dollar terms. The first major
upward leg in this bull market ended during the first half of 2008, but
a long-term peak won't occur until 2014-2020. In real (gold) terms,
commodities commenced a secular BEAR market in 2001 that will continue
until 2014-2020. (Last
update: 09 February 2009)
Copyright
Reminder
The commentaries that appear at TSI
may not be distributed, in full or in part, without our written permission.
In particular, please note that the posting of extracts from TSI commentaries
at other web sites or providing links to TSI commentaries at other web
sites (for example, at discussion boards) without our written permission
is prohibited.
We reserve the right to immediately
terminate the subscription of any TSI subscriber who distributes the TSI
commentaries without our written permission.
Outlook Summary
Market
|
Short-Term
(0-3 month)
|
Intermediate-Term
(3-12 month)
|
Long-Term
(1-5 Year)
|
Gold
|
Neutral
(25-May-09)
|
Bullish
(12-May-08)
|
Bullish
|
US$ (Dollar Index)
|
Neutral
(27-Jul-09)
| Bullish
(25-May-09)
|
Neutral
(19-Sep-07)
|
Bonds (US T-Bond)
|
Neutral
(08-Jul-09)
|
Bullish
(08-Jun-09)
|
Bearish
|
Stock Market (S&P500)
|
Neutral
(27-Jul-09)
|
Bearish
(11-May-09)
|
Bearish
|
Gold Stocks (HUI)
|
Neutral
(20-May-09)
|
Bullish
(17-Jun-09)
|
Bullish
|
| Oil | Neutral
(27-Jul-09)
| Bearish
(25-May-09)
| Bullish
|
Industrial Metals (GYX)
| Neutral
(27-Jul-09)
| Bearish
(25-May-09)
| Bullish
|
Notes:
1. In those cases where we have been able to identify the commentary in
which the most recent outlook change occurred we've put the date of the
commentary below the current outlook.
2. "Neutral", in the above table, means that we either don't have a
firm opinion or that we think risk and reward are roughly in balance with respect to the timeframe in question.
3. Long-term views are determined almost completely by fundamentals,
intermediate-term views by giving an approximately equal weighting to
fundmental and technical factors, and short-term views almost
completely by technicals.
China, again
A good article
In last week's Interim Update we briefly touched on the burgeoning
economic problems in China. For example, we noted that the dramatic
expansion of credit engineered by China's government over the past few
quarters had led to bad loans being piled on top of bad loans and new
mal-investments being piled on top of earlier mal-investments, thus
creating distortions within an economy that was already labouring under
the distortions created by previous rampant credit expansion.
Shortly after we posted our brief discussion an article covering the same issues, but in far more detail, appeared at http://mises.org/story/3573. Here's an excerpt:
"...at the end of last
year, roughly 91 million square meters of apartment space lay empty
throughout China. This figure does not include the 587 million square
meters of apartment space that has been sold but left vacant over the
past five years or the millions more that are built but left off the
depressed market. More specifically, since 2006, roughly 152 million
square meters of commercial office space has been built in Beijing --
more than all of the office space in Manhattan -- yet 30 million square
meters is still vacant. And in Shanghai, the vacancy rate for
commercial space is estimated to have hit 25% at the end of last year.
However, as an
illustration of unintended consequences, during this new real estate
boom several investigations have discovered that real estate
developers, desperate to offload nonperforming properties, have dumped
mortgages onto state-run banks that are "facing enormous pressure from
Beijing to rapidly increase lending to boost the economy."
Thus, while market forces
would have reallocated unused property, pushing prices down, the
stimulus has catapulted markets such as Beijing and Shanghai into the
top 50 most expensive globally, despite that the average resident earns
a fraction of their industrialized peers."
Do you have a trade deficit with China, and, if so, is it a problem?
Chances are, most of our readers buy China-made products and don't sell
anything to China. If this applies to you then you run a trade deficit
with China. Does this trade deficit create an economic problem for you?
In particular, do you think that your government should intervene to
correct this imbalance of trade by, for example, pushing-up the prices
of Chinese products to the point where you will be prompted to buy
products made elsewhere? Or is it actually in your own interest to keep
buying Chinese products as long as these products offer the best value,
regardless of whether or not this results in a larger "trade imbalance"
between you and the Chinese manufacturers of the stuff you buy?
The trade deficit that many of us run with China doesn't really seem
like a problem, does it? And if it isn't a problem at an individual
level then why is it a problem at a group level?
The truth is that a trade deficit or imbalance is never a problem, in
and of itself. In fact, the words "deficit" and "imbalance" create a
false impression because trade is never really in deficit or
imbalanced. What happens is that people trade goods for money and money
for goods. The sellers of goods favour the money over the goods whereas
the sellers of money favour the goods over the money. As long as people
are mostly free to act in their own interest, the trade between people
will always be in balance.
But while a "trade deficit" is never a problem per se (read: something
that needs to be fixed), it can be symptomatic of a problem that should
be addressed. For example, US$ inflation (a huge problem) is one of the
main reasons that the US ran such a large trade deficit for so long.
Currency manipulation by China's government (another problem, but not
in the same league as US$ inflation) is another reason.
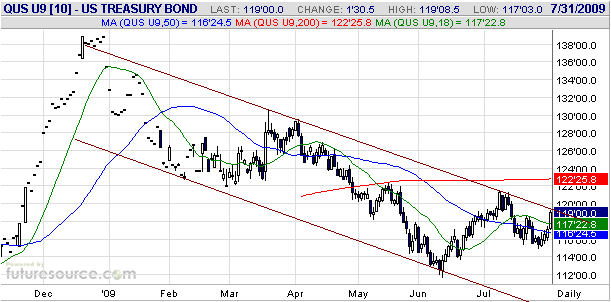
Bond Market Update
T-Bond futures were very strong on Friday, a possible sign that the
second upward leg in the rally that began in June is underway. Also on
the bullish side of the ledger is that sentiment towards T-Bonds is
quite constructive. In particular, the large speculative net-short
position in T-Bond/T-Note futures means that there is plenty of
short-covering fuel available to propel this market to higher levels.
However, while we continue to think that the T-Bond market looks
bullish on an intermediate-term basis, we aren't bullish with regard to
the next couple of months. The main reasons are:
1. We doubt that the T-Bond market will be able to make substantial
upward progress in the absence of another deflation scare, and a
deflation scare is unlikely over the next two months.
2. The September T-Bond contract has risen for 4 days in a row, but the
following chart shows that this rebound has done no more than take the
price back to the top of its downward-sloping channel.
3. Friday's strong up-move was not confirmed by the currency and equity
markets. What we mean is that a bond market rally with staying power
should occur alongside US$ strength and stock market weakness, but on
Friday the US$ plunged and the US stock market rose.
With regard to item 3 above, the lack of confirmation from
inter-related markets does not mean that Friday's sharp gain in the
bond market was a false signal. It could, for example, turn out to be
the dollar's plunge that was the false signal. The lack of inter-market
confirmation just increases the risk that Friday's bond surge won't be
sustained.
The Stock
Market
Current Market Situation
The US stock market edged a little higher last week. As a result, the
market is in roughly the same position now as it was a week ago.
One new development over the past week is illustrated by the following
chart of the NASDAQ Composite Index and the NASDAQ's McClellan
Oscillator (MO). The chart shows that the NASDAQ rose to a new high for
the year last week while its MO declined. This is a bearish divergence
because it means that the index's rise was not confirmed by broad-based
strength.
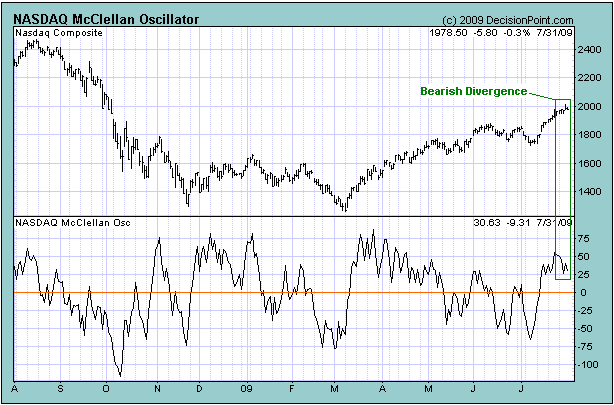
The divergence shown
above increases the risk that there will be a significant pullback over
the coming 1-3 weeks, but this pullback (assuming it occurs) will
probably be followed by another rally to new highs for the year.
The Long-Term Trend
The following long-term chart shows the 20-year upward trend in the
SPX/gold ratio that ended during 1999-2001 and the subsequent downward
trend. Based on the history of secular bear markets, it is reasonable
to expect that the downward trend will last 13-20 years.
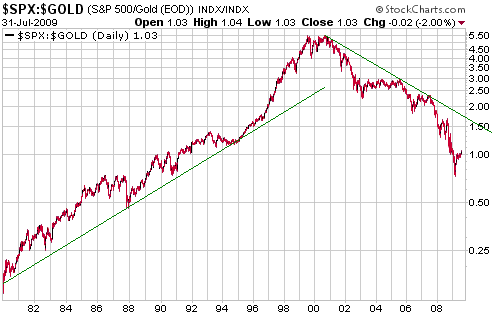
During its secular
bull market the SPX/gold ratio moved back to near its long-term trend
line every few years, but notice that there was a blow-off move during
1997-1999. This 3-year blow-off took the ratio a long way above its
trend line and completed the bull market.
As was the case with the preceding bull market, the current bear market
is likely to end with a blow-off move that takes the ratio a great
distance from its trend line. Furthermore, the bear market blow-off is
likely to be shorter and sharper than the bull market blow-off because
it will be driven by the combination of fear and greed rather than
greed alone. Some gold enthusiasts believe that such a move is already
underway, but we seriously doubt it because it would mean that the gold
bull market was into its final 12 months. This is very unlikely because
it would also mean that the bear market in equities was almost complete
(the long-term gold bull market and the long-term equity bear market
are inextricably linked). A more likely outcome is that the SPX/gold
ratio will spend the next 12 months 'chopping' back and forth.
The gold sector of the stock market usually trends in the opposite
direction to the SPX/gold ratio, but note that the gold sector still
has a lot of catching up to do because the HUI is at roughly the same
level now as it was two years ago -- when SPX/gold was twice as high.
There is no telling when the gold sector will make its inevitable
catch-up move; we are simply making the point that gold stocks, as a
group, currently have a lot more upside potential than gold bullion due
to their relative under-valuation.
This week's
important US economic events
| Date |
Description |
Monday Aug 03
| ISM Index
Construction Spending
| | Tuesday Aug 04 | Personal Income and Spending
Pending Home Sales
| | Wednesday Aug 05
| Factory Orders
ISM Services
| | Thursday Aug 06
| No important events scheduled
| | Friday Aug 07
| Monthly Employment Report
Consumer Credit
|
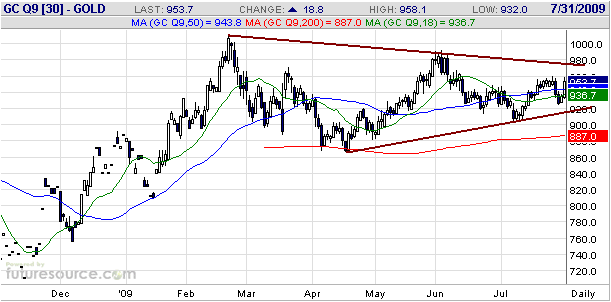
Gold and
the Dollar
Gold
The following daily chart of August gold futures shows that the gold
market has been consolidating since February of this year. This year's
consolidation is part of a longer-term consolidation that began in
March of last year.
Last week's back-and-forth action was consistent with this year's
pattern. A minor breach of support during Tuesday-Wednesday was quickly
retraced and the gold price finished the week within $3 of where it
began.
Above the current price there is some resistance at $960 and more
important resistance at around $980, whereas support lies at around
$920. Our guess is that resistance at $980 will hold if tested over the
next two weeks, but a solid break above $980 should be respected
because it would suggest that the longer-term consolidation had ended
or was about to end.
Gold Stocks
It was an extraordinary week for the gold sector with the first HUI
testing resistance in the low-360s and then plunging to the low-330s
before quickly returning to the aforementioned resistance.
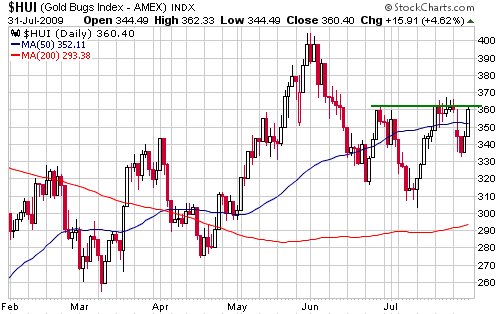
This is not the time
of year when the gold sector normally makes SUSTAINED upside breakouts;
rather, this is the time of year when upside breakouts tend to be
followed in short order by downward reversals. We would therefore be
sceptical of the staying power of any break above 362-365 that occurred
over the coming few days.
Seasonality is just one of many considerations and this year could, of
course, be different, but if you were under-exposed then the time to
have done some buying was last Wednesday-Thursday. If the gold sector
follows its seasonal bull-market pattern then there will be some
additional back-and-forth consolidation -- including, perhaps, a test
of last week's low -- during the first half of August, and then a rally
into the first half of September.
Currency Market Update
The Dollar Index plunged on Friday and ended the week at important
support defined by its December-2008 and June-2009 lows. The Dollar's
precarious situation is illustrated below.
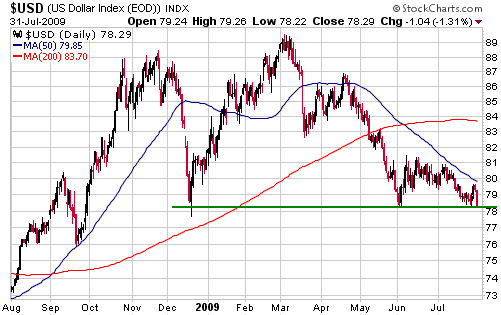
As mentioned earlier
in today's report, Friday's sharp decline in the Dollar Index was not
confirmed by the bond market. This is one reason to seriously consider
the possibility that the US$ will either immediately begin to rebound
or that a breach of support during the first half of this week will be
quickly negated by an upward reversal. Another reason is that it has
taken the Dollar Index almost 5 months to retrace the gains it made
during a 2.5-month period earlier this year. This demonstrates
resilience. A third reason is that the entire decline from the
March-2009 peak to last Friday's low has not yet been confirmed by the
gold market (the gold market has been in consolidation mode throughout
this period). This is potentially significant because gold has a habit
of leading the currency market at important turning points. A fourth
reason is that there is a substantial short position in the US$ that
will have to be covered at some point.
On a longer-term basis, the euro is now very over-valued relative to
the US$ on a purchasing power basis while Europe faces the same major
economic problems faced by the US. Specifically, over the years ahead
Europe's economy will have to deal with excessive debt, insolvent
financial institutions, massive non-funded government liabilities, and
the disastrous consequences of bailouts and Keynesian policies.
Having said all that, we've learned the hard way that breakouts through
intermediate-term support and resistance levels in the currency market
should be respected unless/until they prove to be 'fakeouts'. Many
large speculators will pile into a trade based solely on technical
considerations, which can result in the market moving contrary to the
underlying fundamentals for an inconveniently long time (inconveniently
long, that is, if you happen to be betting the other way). We therefore
wouldn't take speculative positions based on the assumption that a US$
breakout to the downside will be quickly reversed.
Gold would likely be the main beneficiary of a US$ breakdown that was
not quickly reversed. The growth-oriented markets (equities and
industrial commodities) have 'enjoyed' US$ weakness up until now, but
that's only because the weakness has not been widely perceived as a
problem. In other words, in the unlikely (in our opinion) event that
the Dollar Index breaks below 78 and begins to accelerate downward we
expect that some of the inter-market correlations that have been so
strong over the past year will come to an end.
Update
on Stock Selections
(Note: To review the complete list of current TSI stock selections, logon at http://www.speculative-investor.com/new/market_logon.asp
and then click on "Stock Selections" in the menu. When at the Stock
Selections page, click on a stock's symbol to bring-up an archive of our comments on the stock in question)
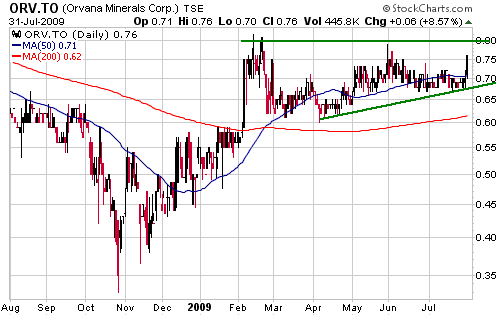
 New stock selection: Orvana Minerals (TSX: ORV). Shares: 115M issued, 118M fully diluted. Recent price: C$0.76 New stock selection: Orvana Minerals (TSX: ORV). Shares: 115M issued, 118M fully diluted. Recent price: C$0.76
ATW Gold has pulled
out of the battle for control of Kinbauri Gold (TSXV: KNB), leaving ORV
as the likely winner. Assuming that ORV's C$0.75/share bid for KNB
proves to be successful it will add the El Valle gold project in Spain
to its stable of assets.
ORV was previously discussed in the 15th and 22nd July Interim Updates. As explained in our 15th July commentary:
"El Valle...is scheduled
to enter the mine construction phase in the near future and to be in
production about 12 months later. Based on a Scoping Study completed
earlier this year, El Valle should produce about 100K ounces of gold
and 9.3M pounds of copper per year at a cash cost of around
US$360/ounce (accounting for copper as a byproduct). The initial
capital cost is expected to be less than US$60M and the project has
very good economics (at gold and copper prices of $910/ounce and
$1.50/pound, resp., the Internal Rate of Return is estimated to be more
than 60%).
Once in production at the
design parameters a project such as El Valle (100K oz/year gold with
relatively low costs in a politically secure location) would be worth
at least US$250M."
US$250M, or C$270M at the current exchange rate, equates to around
C$2.30 per ORV share. This is ORV's upside potential at current metal
prices based only on bringing El Valle into production in accordance
with the engineering studies completed by KNB. ORV has other assets,
but our primary interest is El Valle. Also, ORV has US$96M of cash, but
we are assuming that all of this cash will be used to purchase KNB
shares and to construct the El Valle mine.
We were hoping for the opportunity to add ORV to the TSI List at a
lower price, but given the stock's large upside potential and that
downside risk is mitigated by the company's large stash of cash we will
'bite the bullet' and add it at Friday's closing price of C$0.76. If
the overall gold sector remains in consolidation mode (quite likely, in
our opinion) then ORV could become available at around 10% lower at
some point over the next two weeks, but at the current price the
risk/reward is good enough.
The chart displayed below shows that ORV has significant resistance at around C$0.80. Support lies in the high-C$0.60s.
Golden Queen Mining (TSX: GQM). Shares: 88M issued, 92M fully diluted. Recent price: C$0.58
We last mentioned GQM in late May, after it had just run up to the C$0.70s. At that time we wrote:
"...although GQM remains
very under-valued we would not deem it a good candidate for new buying
unless it were to pull back to near former resistance (now support) at
C$0.50.
GQM's stock price will
probably rise to a much higher price level when the company finally
receives the remaining permit for its Soledad Mountain gold project in
California. The permit could be issued as soon as next month, but we'll
believe it when we see it."
The stock subsequently traded as low as C$0.53, providing a reasonable
opportunity to do some buying for those with patience. A lot of
patience is required here because the permit issue continues to drag
on...and on...and on.
It would be OK to accumulate some GQM near the current price (the
mid-to-high C$0.50s). As evidenced by the following chart, the stock is
nearer the bottom than the top of its multi-month range. Also, it is
interesting that the company completed a small non-brokered private
placement of shares at C$0.65 last week. The buyers of these shares
must be confident that something will happen with the permit in the
not-too-distant future.
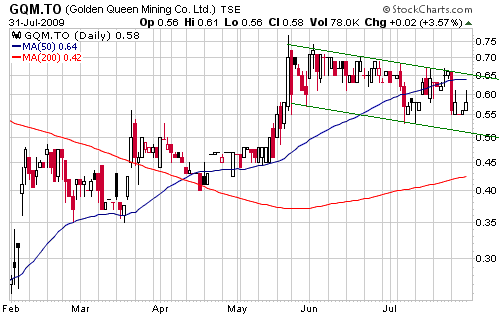
Chart Sources
Charts appearing in today's commentary
are courtesy of:
http://stockcharts.com/index.html
http://www.futuresource.com/
http://www.decisionpoint.com/

|
