|
-- Weekly Market Update for the Week Commencing 3rd November 2003
Big Picture
View
Here is a summary of our big picture
view of the markets. Note that our short-term views may differ from our
big picture view.
Bond yields (long-term interest
rates) reached a major low in June of 2003 and will trend higher until
at least mid 2004.
The US stock market will reach
a major bottom (well below the October-2002 low) during 2004.
The Dollar commenced a bear
market in July 2001 and will continue its decline during 2003 and 2004.
A bull market in gold stocks
commenced in November 2000 and will continue during 2003 and 2004.
Commodity prices, as represented
by the CRB Index, will rally during 2003 and 2004 with most of the upside
occurring in 2004.
Inflation
versus Inflation Expectations
For a few years now the US Treasury
has been issuing what are commonly known as TIPS (Treasury Inflation-Protected
Securities). The idea behind these securities is to offer investors a way
to buy US Government bonds without the need to take on the risk that the
bond will fall in value due to inflation. And this supposed 'inflation
protection' is achieved by regularly adjusting the principle amount of
each bond based on changes in the CPI. For example, if you buy one of these
inflation-protected bonds and the CPI increases by 3% during the ensuing
12 months then the principle amount of the bond -- the amount that would
be due to you at the eventual repayment date -- would be increased by 3%.
Furthermore, future interest payments would be based on the revised principle
amount.
The thing is, TIPS aren't really inflation-protected
because the CPI is not inflation or a proxy for inflation. It is not even
an accurate representation of the effects of inflation. The CPI
is simply a number that is concocted by the government each month in such
a way as to minimise inflation expectations and social security payments
(most social security payments are linked to the CPI). However, because
most people do incorrectly associate the CPI with inflation the performance
of 'inflation-protected' securities relative to the performance of non-inflation-protected
securities can provide us with useful information.
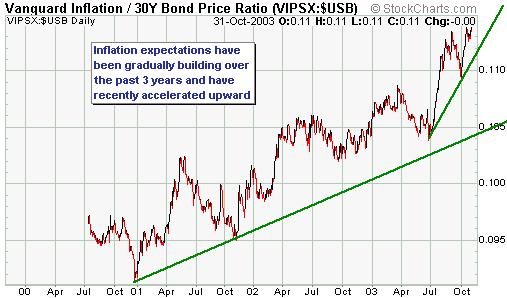
Below is a chart showing the ratio
of the Vanguard Inflation-Protected Securities Fund (VIPSX) and the US
30-year T-Bond. The line on this chart rises when the TIPS -- represented
here by the VIPSX -- are out-performing the regular government bonds. Out-performance
by TIPS is, in turn, an indication that investors are becoming more concerned
about inflation. Obviously, the market is a lot more concerned about inflation
than the Fed pretends to be.
The US
Stock Market
Current Market Situation
Over the recent past our commentaries
have been heavily loaded with discussion on gold, gold stocks, and currencies,
with only scant attention being paid to the overall stock market. This
is because we tend to devote the most space in each TSI commentary to the
markets that are presently the most interesting. In this context, "interesting"
means trending strongly or appearing to be close to an important trend
change.
The US stock market has recently been
anything but interesting. In fact, the market has essentially gone nowhere
since early June; a lethargic performance that is reflected in the multi-year
low just posted by the Volatility Index. Now, a long period of inactivity
in the market is invariably followed by a period of dramatic action and
the current situation will not be an exception in this regard. In other
words the current tedium will be followed by a period of considerable excitement,
most likely as a result of a decline that starts out looking like 'nothing'
and ends up causing widespread panic as one support level after another
gives way.
Sentiment is currently overtly bullish
and valuations are generally at bubble-peak levels. This means that market
risk is extremely high, but it doesn't mean that a large decline is necessarily
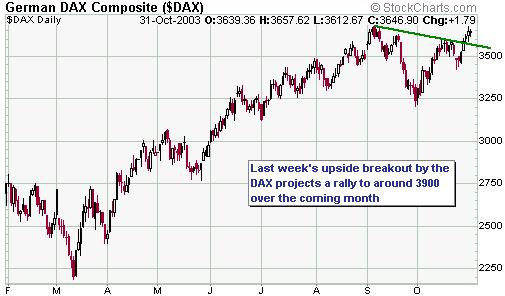
going to get underway during the next few weeks. In fact, last week's upside
breakout by the German stock market (see chart below) shifts the odds in
favour of new recovery highs being seen in the US stock market over the
coming month.
Natural Gas Stocks
In the 22nd September Weekly Update
we mentioned that the Natural Gas Index (XNG) was precariously positioned
near its channel bottom. This, in itself, wasn't a problem, but a break
below the channel bottom would have been a warning that a sizeable correction
was underway.
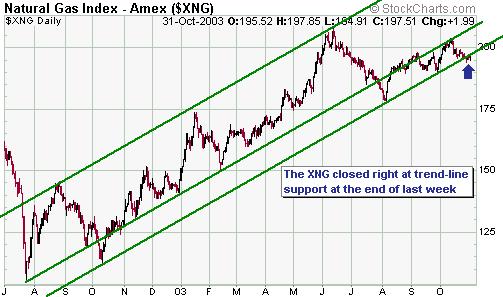
From a technical perspective the situation
is unchanged because the XNG has remained in an upward trend but is once
again testing trend-line support (see chart below).
The stocks of natural gas companies
have a stronger positive correlation with the overall stock market than
with the natural gas price so the ability of the XNG to remain within its
upward-sloping channel will be determined, to the greatest extent, by what
happens to the overall market. Furthermore, the ability, or otherwise,
of the XNG to hold above trend-line support in the short-term will give
us a clue as to what to expect from the overall market. For example, a
rebound in the XNG over the coming week would have short-term bullish implications
for the overall market.
This week's important economic events
| Date |
Description |
| Monday Nov 03 |
Construction Spending
ISM Index |
| Tuesday Nov 04 |
No significant events |
| Wednesday Nov 05 |
Factory Orders
ISM Non-Manufacturing Index |
| Thursday Nov 06 |
Q3 Productivity and Labour Costs |
| Friday Nov 07 |
Employment Report
Consumer Credit
ECRI Future Inflation Gauge |
 Click
here to read the rest of today's commentary Click
here to read the rest of today's commentary

|
