|
-- Weekly Market Update for the Week Commencing 4th May 2009
Big Picture
View
Here is a summary of our big picture
view of the markets. Note that our short-term views may differ from our
big picture view.
In nominal dollar terms, the BULL market in US Treasury Bonds
that began in the early 1980s will end by mid-2010. In real (gold)
terms, bonds commenced a secular BEAR market in 2001 that will continue
until 2014-2020. (Last
update: 09 February 2009)
The stock market, as represented by the S&P500 Index, commenced
a secular BEAR market during the first quarter of 2000, where "secular
bear market" is defined as a long-term downward trend in valuations
(P/E ratios, etc.) and gold-denominated prices. This secular trend will bottom sometime between 2014 and 2020. (Last update: 22 October 2007)
A secular BEAR market in the Dollar
began during the final quarter of 2000 and ended in July of 2008. This
secular bear market will be followed by a multi-year period of range
trading. (Last
update: 09 February 2009)
Gold commenced a
secular bull market relative to all fiat currencies, the CRB Index,
bonds and most stock market indices during 1999-2001. This secular trend will peak sometime between 2014 and 2020. (Last update: 22 October 2007)
Commodities,
as represented by the Continuous Commodity Index (CCI), commenced a
secular BULL market in 2001 in nominal dollar terms. The first major
upward leg in this bull market ended during the first half of 2008, but
a long-term peak won't occur until 2014-2020. In real (gold) terms,
commodities commenced a secular BEAR market in 2001 that will continue
until 2014-2020. (Last
update: 09 February 2009)
Copyright
Reminder
The commentaries that appear at TSI
may not be distributed, in full or in part, without our written permission.
In particular, please note that the posting of extracts from TSI commentaries
at other web sites or providing links to TSI commentaries at other web
sites (for example, at discussion boards) without our written permission
is prohibited.
We reserve the right to immediately
terminate the subscription of any TSI subscriber who distributes the TSI
commentaries without our written permission.
Outlook Summary
Market
|
Short-Term
(0-3 month)
|
Intermediate-Term
(3-12 month)
|
Long-Term
(1-5 Year)
|
Gold
|
Neutral
(04-May-09)
|
Bullish
(12-May-08)
|
Bullish
|
US$ (Dollar Index)
|
Neutral
(23-Mar-09)
| Neutral
(16-Feb-09)
|
Neutral
(19-Sep-07)
|
Bonds (US T-Bond)
|
Bearish
(06-Apr-09)
|
Bearish
(22-Sep-08)
|
Bearish
|
Stock Market (S&P500)
|
Neutral
(27-Apr-09)
|
Neutral
(02-Feb-09)
|
Bearish
|
Gold Stocks (HUI)
|
Bullish
(12-Jan-09)
|
Bullish
(12-May-08)
|
Bullish
|
| Oil | Bullish
(17-Nov-08)
| Neutral
(22-Sep-08)
| Bullish
|
Industrial Metals (GYX)
| Neutral
(27-Apr-09)
| Neutral
(22-Sep-08)
| Bullish
|
Notes:
1. In those cases where we have been able to identify the commentary in
which the most recent outlook change occurred we've put the date of the
commentary below the current outlook.
2. "Neutral", in the above table, means that we either don't have a
firm opinion or that we think risk and reward are roughly in balance with respect to the timeframe in question.
3. Long-term views are determined almost completely by fundamentals,
intermediate-term views by giving an approximately equal weighting to
fundmental and technical factors, and short-term views almost
completely by technicals.
Central planning is back in vogue
At the root of central
planning ideology is the belief that a group of well-meaning government
officials and/or experts is more capable than the unrestrained free
market of allocating resources for the betterment of society. However,
whenever and wherever central planning of the economy has been
attempted it has always been a failure, with the magnitude of the
failure generally being proportional to the breadth of the central
planning experiment (small-scale attempts to centrally plan have tended
to create relatively minor problems whereas efforts to centrally plan
the majority of economic activity have led to total disaster). It
always fails because the market process is so complex, and yet so
smooth, that any attempt by the government to control it will 'throw a
spanner into the works'. But unfortunately, each new generation seems
to operate under the assumption that the only reason central planning
has never worked in the past is because the right people haven't been
in charge.
Powerful (we say irrefutable) arguments can be made against central
planning on both theoretical and empirical grounds, but we must invest
based on the way things are as opposed to the way they should be; and
right now there is a very strong trend towards increased government
control of economic activity. We would rather not delve into politics
when writing these commentaries, but we no longer have any choice in
the matter because politics is coming to totally dominate the financial
markets and the investing landscape.
Ironically, one of the primary drivers of today's relentless shift
towards greater government control of the economy is the set of
problems caused by governments' earlier attempts to control the
economy. As Ludwig von Mises observed many decades ago, government
intervention in the economy inevitably creates problems that provide
the justification for more intervention. It helps, of course, that when
government intervention leads to a crisis the finger of blame is
invariably pointed at the free market, a mistake made possible by the
fact that most people, including most economists, fail to understand
that neither the 'cartelised' banking system of today nor the symbiotic
relationship that exists between some large private corporations and
the government has anything to do with Capitalism.
As has often been the case in the past, the focal point of the current
batch of central planners is the energy industry. If you control energy
production, energy-related investment and energy consumption then you
exert considerable influence over the entire economy, especially if you
already have total control over money and banking.
Displaying either a remarkable ignorance of history or a total
disregard for the lessons of history, the latest generation of US
central planners, led by a charismatic president, have decided to push
the US energy industry in the direction that they believe will create
the optimum mix of economic growth and clean air (and, of course, gain
the most votes). If we are lucky then the havoc they cause will be no
greater than the havoc caused by "Project Independence" during the
1970s and 1980s, but chances are we won't be so lucky.
At this point it's worth briefly reviewing the history of "Project
Independence", particularly since some aspects of this earlier attempt
by the US government to steer the energy industry in a politically
desirable direction are similar to current plans.
"Project Independence" was introduced in 1973 by an earlier generation
of central planners with the goal of making the US independent of
foreign oil by 1980. It had many facets, including the provision of
subsidies to synthetic fuel manufacturers, increased oil tariffs,
conservation schemes, and increased government spending on mass transit
systems. Later in the decade the government also imposed a "Windfall
Profits Tax" on oil companies (the more things change...). Ironically
-- the word "ironically" is often appropriate when discussing the
effects of government intervention -- the various measures implemented
by the US government with the aim of creating energy independence
actually made America MORE dependent on oil from unstable regions such
as the Middle East. They did so because they misdirected energy-related
investment and crimped the abilities of US oil companies to increase
production.
The US Government's efforts to promote the production of synthetic
fuels under the banner of "Project Independence" amount to a classic
example of how schemes designed to circumvent the market often pan out.
As explained by Thomas DiLorenzo in his book "How Capitalism Saved
America":
"In 1979 the federal
government created a Synthetic Fuels Corporation...that would make
low-interest loan guarantees to companies developing synthetic fuels.
As with all government programs, however, the indirect subsidies were
distributed according to whichever members of Congress had the most
clout and could funnel the subsidies into their home districts or
states, not according to whatever firms held the most promise in
developing synthetic fuels. In other words, it was a giant political
pork barrel.
The government promised
to be producing 500,000 barrels of synthetic fuel per day by 1987, but
it never supplied more than 10,000 barrels. Moreover, the loan
guarantees were limited to those companies that had such poor prospects
that they could not obtain private funding. In other words, only the
most unprofitable companies qualified.
There is even evidence
that the Synfuels Corporation IMPEDED the development of synthetic
fuels. Energy industry analyst Milton Copulos explains that "virtually
all lending [by investment banks] for alcohol fuel plant construction
came to a halt as the banking community waited to see what the federal
programs would eventually include." As a result, says Copulos,
"construction of alcohol plants came to a virtual halt." Thankfully,
the whole program was scrapped in 1986."
Energy independence is still a policy goal, but the main thrust of the
US government's current efforts to centrally plan the energy industry
is Global Warming (GW). In the hope of arresting the GW trend the Obama
Administration has already committed to spending hundreds of billions
of dollars, and will probably end up spending trillions of dollars, to
promote methods of power generation that emit less carbon. It will also
be taking steps to increase the cost of energy sources that are
presently far more economical, but are perceived to be less
environmentally friendly. These actions will impose huge direct and
indirect costs on the US economy even if the Climate Alarmists are
right and the global warming trend that began around 1980 was primarily
driven by an increase in human-generated carbon emissions. It will
impose still greater costs if, as we suspect, the trend was part of a
natural cycle that has already run its course. In other words, the
unshakable belief in the Global Warming threat is providing the
justification for government action that could cripple an economy that
is already in a severely weakened state. As an aside, we have singled
out the US Government but it should be noted that the governments of
most developed-world countries are headed down the same poorly chosen
path.
As the government becomes increasingly involved in deciding how
resources are allocated, the overall economy and the average standard
of living will be losers. Based on the historical tendency for the
actual effects of government intervention to be the opposite of the
intended effects, the environment will probably also be a loser. There
will, however, be winners, and as mentioned earlier in this discussion
we must invest based on the way things are as opposed to the way they
should be. Amongst the most likely winners are the alternative --
alternative, here, meaning renewable and/or "green" -- energy companies
that will benefit directly from the government's largesse and forced
redirection of resources. In fact, there is a reasonable chance that
"alternative energy" will be one of the next decade's investment
bubbles. The uranium industry is also a likely winner because uranium
is the only relatively-clean energy source that can be applied on a
large scale and that will be economically feasible within the ranks of
the world's developing nations.
The Stock
Market
Current Market Situation
The S&P500 Index traded in a narrow range and eked out an 11-point
gain over the course of the past week (it ended the week at 877). Our
view is that the 200-day moving average in the mid-900s defines the
short-term upside potential while the 50-day moving average at around
800 defines the short-term downside potential.
Uranium and Alternative Energy Stocks
As mentioned above, government policy could be setting the stage for an
alternative energy investment bubble. With central banks dedicated to
providing abundant liquidity and politicians intent upon steering
investment towards various alternative energies, the right ingredients
for such a bubble are certainly being added into the mix.
As also mentioned above and in last week's Interim Update, the uranium
industry is another potential beneficiary from the "climate change"
hysteria driving government policy. And uranium has the advantage of
being an economically viable alternative to fossil fuels without
government support.
Here are quick updates on our current uranium and alternative energy stock selections, beginning with uranium.
The tide appears to have turned for the uranium-mining sector of the
stock market. It was the first industrial-commodity sector to peak and
it could well be the first to enter a new bull market. For some uranium
stocks the short-term risk/reward has become skewed towards risk due to
the large gains achieved over the past several weeks, but we think the
intermediate-term outlook is bullish.
There are three uranium stocks in the TSI List -- one mid-tier producer
(UUU.TO) and two small exploration/development-stage miners (EFR.TO and
KRI.TO). Below is a chart of each stock along with a few comments.
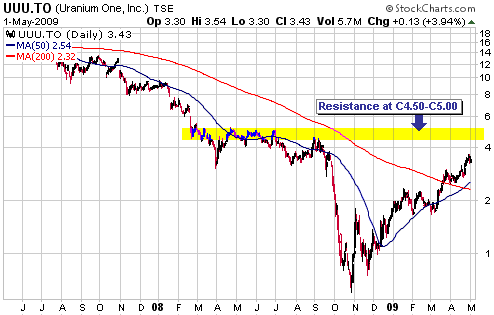
1. Uranium One (TSX: UUU). Recent price: C$3.43
We think UUU is now fully valued based on the current spot uranium
price of US$44/pound, but remains under-valued based on the current
contract price of US$70/pound. A rise to resistance in the
C$4.50-C$5.00 range would create a short-term selling opportunity,
whereas a pullback to around C$2.50 would create a short- and
intermediate-term buying opportunity.
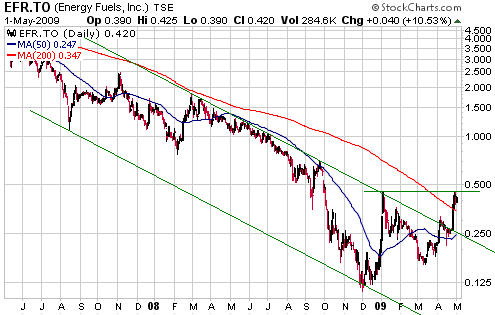
2. Energy Fuels Inc. (TSX: EFR). Recent price: C$0.42
EFR has minimal political risk (its assets are in the US), near-term
production capability, and a reasonable balance sheet. It is extremely
under-valued and has huge upside potential, but the stock's volatility
and the fact that a higher uranium price will be required to justify
bringing its mines into production make it unsuitable for widows and
orphans. In a nutshell, at its current price it is a highly leveraged
speculation on the uranium price.
It recently broke out from a long-term downward-sloping channel and has
moved above its 200-day moving average for the first time in more than
two years. It is presently testing resistance at C$0.45. Above C$0.45
there is minor resistance at C$0.70 (the September rebound peak) and
then 'round number' resistance at C$1.00.
EFR is so under-valued that selling should be based solely on money
management considerations. New speculative buying would be appropriate
in the C$0.30-C$0.45 range.
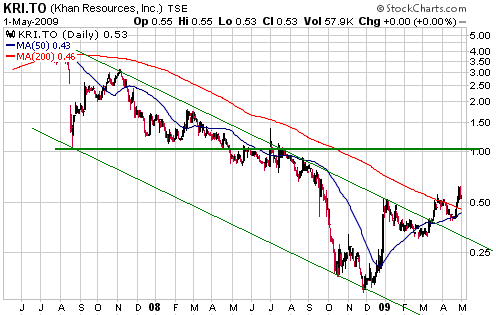
3. Khan Resources (TSX: KRI). Recent price: C$0.53
The Dornod project has an indicated uranium resource 64.3M pounds,
KRI's share of which is 44M pounds. 52.9M pounds of this resource is in
the reserve category (KRI's share of the reserve is 36M pounds).
A Feasibility Study
completed earlier this year determined a net present value of US$339M
for the Dornod project (KRI's share: US$234M) based on a 10% discount
rate and a uranium price of US$70/pound. So, what value is the stock
market currently assigning to KRI's Dornod stake? Very little given
that KRI has no debt and about C$0.35/share of cash in the bank (the
company's enterprise value is presently about US$8M).
There are two reasons for KRI's absurdly low valuation. One, the
two-year bear market in the uranium sector led to the widespread
mispricing of in-ground uranium. Two, the Dornod project is located in
Mongolia.
The country risk is substantial, but KRI is an interesting speculation
at its current price because its assets are trading at such a huge
discount to their potential value.
Chart-wise, KRI is in a similar position to EFR; and like EFR it is so
under-valued that selling should be based solely on money management
considerations. New speculative buying would be appropriate in the
C$0.40-C$0.55 range.
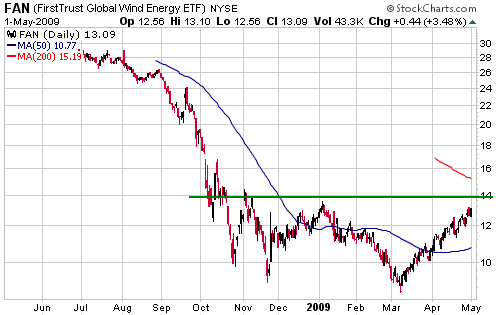
Moving along to
renewable energy, our sole representative at this stage is the Wind
Energy ETF (NYSE: FAN). With reference to the following chart, FAN has
resistance at US$14. A move up to US$14-$15 at some point over the next
few weeks would create a short-term selling opportunity, whereas a
pullback to near the 50-day moving average would create a short- and
intermediate-term buying opportunity.
Natural Gas Stocks
Natural gas stocks are generally down a long way from last year's
highs, but have rebounded strongly from this year's lows and are mostly
now 'overbought' on a short-term basis. Furthermore and as discussed
last week, they are now expensive relative to the price of natural gas.
We therefore think that traders who bought positions in natgas stocks
over the past few months should be locking-in some gains and/or
tightening their stops. It is probably also wise for investors with
substantial exposure to the natgas sector to do some selling into the
current strength, even if their positions are still well underwater.
Here is an interesting article containing figures on US natural gas reserves, production, drilling, and consumption:
http://seekingalpha.com/article/134574-natural-gas-is-cheap-volatility-is-here-to-stay?source=yahoo
And here is a quick chart-based update of some of the natgas positions
in the TSI Stocks List. Most of our natgas stocks look overbought on a
short-term basis and will not be suitable for new buying until they
drop back to near their 50-day moving averages.
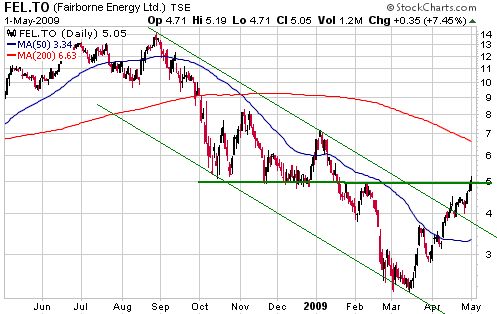
1. Fairborne Energy (TSX: FEL). Recent price: C$5.05
When FEL was trading at C$2.55 in mid March we said that a fair
valuation for the stock in the current depressed natgas environment
would be C$4.65, and that it was a good candidate for new buying in
anticipation of a rebound to resistance at C$4.50-C$5.00 (and to much
higher levels when the natgas market eventually recovers).
FEL ended Friday's session at C$5.05. Its current valuation is still
low based on where we think natgas will be trading in 12 months time,
but it is now fully valued based on the current natgas price and, as
evidenced by the following chart, is poised at intermediate-term
resistance.
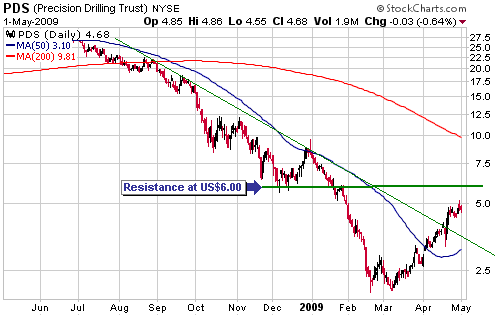
2. Precision Drilling Trust (NYSE: PDS, TSX: PD.UN). Recent price: US$4.68
Although PDS remains very under-valued, it has experienced an
uninterrupted rise since bottoming in March and is now 'overbought' on
a short-term basis. At the same time, there is still a significant gap
between the current price and the next meaningful resistance level at
US$6.00.
In the TSI Stocks
List there are two PDS positions -- a longer-term holding that sits at
a substantial loss and a trading position that sits at a healthy
profit. We have been running a trailing stop on the trading position
and it would be reasonable to keep doing so, particularly as long as
the stock price is well below resistance at US$6.00. On the other hand,
making at least a partial exit now would ensure that we do not give
back a chunk of the gains achieved to date if there is a downward
reversal.
When running a portfolio we can scale into and out of positions, but
with the TSI Stocks List we don't have that option because it is not
designed to be a portfolio. With the TSI Stocks List a stock is either
100% in or 100% out. That is, we don't have the option of making a
partial exit from the PDS trading position.
To protect the gains achieved to date we have decided to exit the PDS
trading position at Friday's closing price of US$4.68. After adjusting
our entry price for the sale of the rights issued to unit-holders on
1st May (the rights closed at US$0.34 on Friday), the profit on this
trade was 117%.
We remain bulls on PDS, but it will probably take a long time for the
stock to recoup all the ground it lost between July of 2008 and March
of 2009. This is because the overall stock market is likely to remain
weak for the foreseeable future and because PDS has issued a lot of new
units at low prices over the past few months to shore-up its balance
sheet.
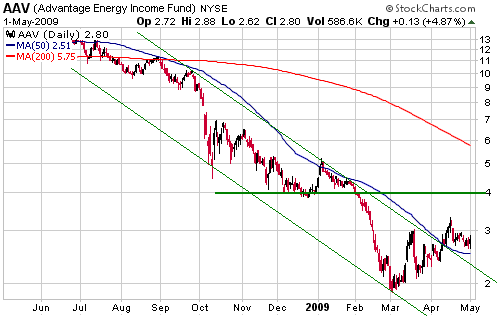
3. Advantage Energy Trust (TSX: AVN.UN, NYSE: AAV). Recent price: US$2.80
Amongst the natural gas plays included in the TSI Stocks List, AAV has
been the worst performer over the past few months. One reason for the
relatively poor performance is management's decision to change from a
trust structure to a growth-oriented company structure. This change in
structure could well be the right move, but it put short-term downward
pressure on the unit price because it meant that anyone holding AAV for
income purposes had to sell.
Thanks to its relative weakness, AAV is not far above its 50-day moving
average and is certainly not 'overbought'. It would have to move up to
near resistance at US$4.00 to be a candidate for selling.
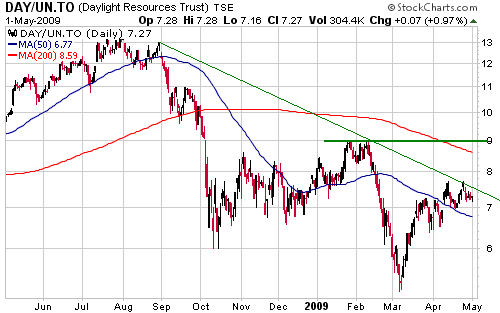
4. Daylight Resources Trust (TSX: DAY.UN). Recent price: C$7.27. Current yield: 13.2%.
DAY's progress in the stock market has been hampered over the past
couple of weeks by news of an equity financing and the acquisition of a
private gas producer. Also, it has come up against some psychological
resistance in the form of the downward-sloping trend-line drawn on the
following chart.
Although it is not helping matters in the here and now, we like the
fact that DAY's management is attempting, via acquisitions, to take
advantage of the low valuations at which small natgas producers are
currently trading.
DAY is presently not far above its 50-day moving average and would only
be a candidate for partial selling if it rose to near resistance at
C$9.00.
5. Peyto Energy Trust (TSX: PEY.UN). Recent price: C$9.34. Current yield: 15.4%
PEY has pulled back after moving well above its 50-day moving average.
It would be a candidate for partial selling at around C$11 and a
candidate for new buying at around C$8.00.
This week's
important US economic events
| Date |
Description |
Monday May 04
| Pending Home Sales
Construction Spending
| | Tuesday May 05 | ISM Non-Manufacturing Index
| | Wednesday May 06
| No important events scheduled
| | Thursday May 07
| Q1 Labour Productivity and Costs
Consumer Credit
| | Friday May 08
| Monthly Employment Report
|
Gold and
the Dollar
Gold and Silver
The gold market has gone very quiet. The reason, we think, is that a
semblance of confidence has returned to the financial world, prompting
large speculators to direct their collective attention away from safe
havens such as gold and towards growth-oriented markets such as
industrial commodities, general equities and high-yield debt
securities.
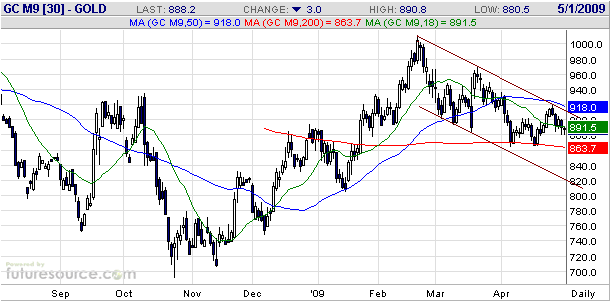
Last week's downward drift in the gold market led to a Friday close
below $890. This close below a minor support level is not a bearish
signal and does not tell us much, if anything, about gold's likely
direction over the coming weeks. However, it does cancel-out the
bullish signal generated during the preceding week. Since this bullish
signal was the sole reason for upgrading our short-term outlook from
"neutral" to "bullish", we have returned to "neutral".
A daily close above $925 would probably take us back to a short-term
"bullish" stance, as would a decline to the $850s. A daily close above
$925 would break the market out of the downward-sloping channel drawn
on the following daily chart of June gold futures, while a decline to
the $850s would reduce the short-term downside potential to around 5%
(we think the low-$800s defines gold's short-term downside risk).
One of our concerns continues to be that gold's downward correction has
not yet put a dent in the public's (the dumb money's) gold-related
optimism, even though the correction has just entered its third month.
The very high premiums to their net asset values at which CEF and GTU
presently trade is evidence that the public remains stubbornly bullish
despite the price decline.
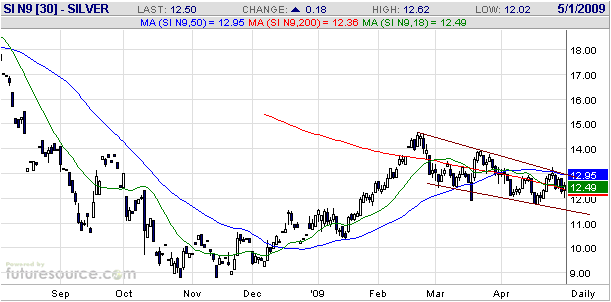
With reference to the
following daily chart of July silver futures, the silver market is in a
similar situation to the gold market in that it has been drifting lower
since late February. As is the case with gold, silver's slide since its
February peak has the look of a correction within a continuing
intermediate-term upward trend.
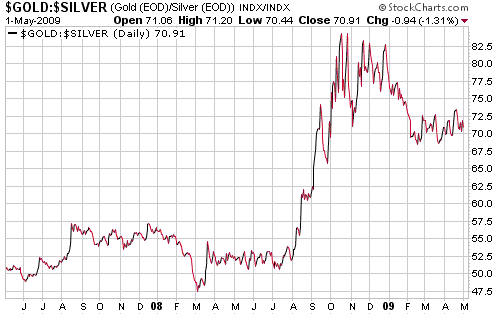
A chart of the gold/silver ratio is displayed below.
The gold/silver ratio soared during August-October of last year, which
is exactly what it is supposed to do during a financial-market panic
(because gold's price is driven almost totally by monetary/investment
demand whereas silver's price is driven by a combination of industrial
and monetary demand). It has since pulled back as panic has subsided,
although it hasn't fallen by as much as we would have expected given
what has happened in other markets. In particular, we would have
expected silver to show significant strength relative to gold in
parallel with the strong rallies in stock markets and industrial
commodities over the past 6 weeks, but the gold/silver ratio has,
instead, moved sideways within a narrow range. We don't know, yet, what
to make of this.
Gold Stocks
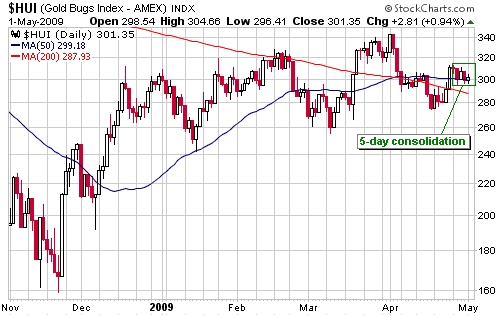
The HUI's price action over the past two weeks was more bullish than
gold's price action. This probably eventuated because strength in the
broad stock market lent some support to gold stocks and because some
gold-mining companies benefit from rising base-metal prices. Whatever
the reason, last week's decline in the HUI did no damage to the
technical picture and at this stage looks like a routine consolidation
within a short-term upward trend.
As noted in last week's Interim Update, the HUI would have to close
below support defined by its mid-April low (274) to completely negate
the idea that a rally to the channel top (the 350s) or higher had
begun.
Currency Market Update
Below is a daily chart of June euro futures.
The euro spent about 4 weeks retracing the 2-day surge of 18-19 March
and has since been working its way higher. It achieved a mini upside
breakout last Wednesday and looks set to strengthen further in the near
future. However, we continue to believe that this currency's upside
potential, and the Dollar Index's corresponding downside potential, is
no more than a few percent.
We expect that the
current short-term trends in the foreign exchange market will reverse
at around the same time the stock market reaches a short-term peak. In
particular, we think that peaks in the commodity currencies (the A$ and
the C$) and the euro, and troughs in the safe-haven currencies (the US$
and the Yen), will roughly coincide with a peak in the global stock
market rebound.
Update
on Stock Selections
(Note: To review the complete list of current TSI stock selections, logon at http://www.speculative-investor.com/new/market_logon.asp
and then click on "Stock Selections" in the menu. When at the Stock
Selections page, click on a stock's symbol to bring-up an archive of our comments on the stock in question)
 Gold-Ore Resources (TSXV: GOZ). Shares: 82M issued, 89M fully diluted. Recent price: C$0.59 Gold-Ore Resources (TSXV: GOZ). Shares: 82M issued, 89M fully diluted. Recent price: C$0.59
The gold sector was in consolidation mode during the final two days of
last week, and yet GOZ, a junior gold stock with an operating mine in
Sweden (the Bjorkdal Mine), gained about 30% over that 2-day period on
higher-than-usual volume. The catalyst for the move was the quarterly
report issued by the company after the close of trading last Wednesday.
This report confirmed that things are finally coming together for GOZ
after a lengthy development phase at Bjorkdal. Specifically, it noted
that Bjorkdal had reached commercial production and had generated
C$0.06/share of cash flow during the first three months of this year.
0.06/share during one quarter implies 0.24/share on an annual basis,
which, in turn, implies that GOZ is trading at only a little more than
2-times annual cash flow. Production and cash flow could be slightly
lower during the current quarter due to scheduled maintenance, but
after that the ramp up from the present 40K oz/yr production rate is
expected to continue.
Our long-standing valuation-based target for GOZ has been C$2/share.
This was our target a year ago when the stock was trading at around
C$0.70, it was our target when the stock traded as low as C$0.12 during
the height of the Q4-2008 panic, and it remains our target today (and
is certainly supported by the Q1-2009 results). The valuation is what
it is; it doesn't change just because the stock market goes crazy.
With reference to the following chart, last week's surge took GOZ to
the lower boundary of intermediate-term resistance in the C$0.60-C$0.70
range. A sharp rise to an important resistance level often creates a
short-term selling opportunity, but only on the first rise to the
resistance. For example, GOZ's surge to C$0.60 during February created
a short-term selling opportunity, but in our opinion last week's rise
did not because the second test of an important resistance level is
more likely to be followed in the near future by an upside breakout.
We won't be surprised if GOZ soon breaks above resistance at C$0.60,
but we also won't be surprised if it spends some time consolidating in
the C$0.48-C$0.60 range before breaking out. A move below C$0.48 would
be a surprise and would probably require a large sector-wide decline,
which is not expected.
New buying would be appropriate between the high-0.40s and the high-0.50s.
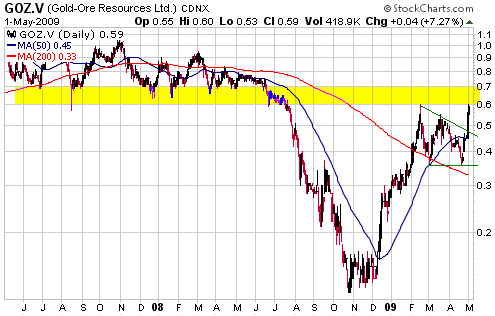
Chart Sources
Charts appearing in today's commentary
are courtesy of:
http://stockcharts.com/index.html
http://www.futuresource.com/

|

