|
-- Weekly Market Update for the Week Commencing 4th June 2007
Big Picture
View
Here is a summary of our big picture
view of the markets. Note that our short-term views may differ from our
big picture view.
Bonds commenced a secular BEAR market in
June of 2003. (Last
update: 22 August 2005)
The stock market, as represented by the S&P500 Index, commenced a secular BEAR market during the first quarter of 2000. The rally
that
began in October of 2002 will end during the first half of 2007. The ultimate bottom of
the secular bear market won't occur until the next decade. (Last update: 02 October 2006)
The Dollar commenced a secular BEAR market during the final quarter of 2000. The
first major downward leg in this bear market ended during the first
quarter of 2005, but a long-term bottom won't occur until 2008-2010. (Last update: 28 March 2005)
Gold commenced a
secular bull market relative to all fiat currencies, the CRB Index,
bonds and most stock market indices during 1999-2001. The first major
upward leg in this secular bull market ended in December of 2003, but a
long-term peak won't occur until at least 2008-2010. (Last update: 13
February 2006)
Commodities, as
represented
by the CRB Index, commenced a secular BULL market in 2001. The first
major upward leg in this bull market ended during the second quarter of
2006, but a long-term
peak won't occur until at least 2008-2010. (Last update: 08 January 2007)
Copyright
Reminder
The commentaries that appear at TSI
may not be distributed, in full or in part, without our written permission.
In particular, please note that the posting of extracts from TSI commentaries
at other web sites or providing links to TSI commentaries at other web
sites (for example, at discussion boards) without our written permission
is prohibited.
We reserve the right to immediately
terminate the subscription of any TSI subscriber who distributes the TSI
commentaries without our written permission.
Outlook Summary
Market
|
Short-Term
(0-3 month)
|
Intermediate-Term
(3-12 month)
|
Long-Term
(1-5 Year)
|
Gold
|
Neutral
(16-May-07)
|
Bearish
(21-May-07)
|
Bullish
|
US$ (Dollar Index)
|
Neutral
(04-Jun-07)
| Bullish
(31-May-04)
|
Bearish
|
Bonds (US T-Bond)
|
Neutral
(26-Mar-07)
|
Bearish
(26-Mar-07)
|
Bearish
|
Stock Market (S&P500)
|
Bearish
(16-May-07)
|
Neutral
(26-Mar-07)
|
Bearish
|
Gold Stocks (HUI)
|
Neutral
(16-May-07)
|
Bearish
(21-May-07)
|
Bullish
|
| Oil | Neutral
(12-Mar-07)
| Neutral
(25-Sep-06)
| Bullish
|
Industrial Metals (GYX)
| Neutral
(15-Jan-07)
| Neutral
(26-Mar-07)
| Bullish
|
Notes:
1. In those cases where we have been able to identify the commentary in
which the most recent outlook change occurred we've put the date of the
commentary below the current outlook.
2. "Neutral", in the above table, means that we either don't have a
firm opinion on which way the market will move or that we expect the
market to be trendless during the timeframe in question.
3. Long-term views are determined almost completely by fundamentals,
intermediate-term views by giving an approximately equal weighting to
fundmental and technical factors, and short-term views almost
completely by technicals.
The industrial metals relative to gold
...as
long as the demand for credit is strong enough to keep short-term
interest rates in a rising trend and investors, as a group, remain
confident about the prospects for global growth, the industrial metals
markets should do fine.
We've included two charts below that highlight the main difference
between gold and the industrial metals. The difference we are talking
about can be described as follows:
Gold is not money anymore in the true meaning of the word (gold is not
the general medium of exchange), but in many respects it acts as if it
were still money. In particular, when economic growth is slowing and
economic confidence is falling the demand for money tends to rise, as
does the demand for gold, while the demand for credit tends to fall.
(Note that rising demand for credit indicates rising demand for the
things that people want to buy with borrowed money; it does not
indicate rising demand for money.) In theory, therefore, gold should do
well relative to the industrial (non-monetary) metals when short-term
interest rates are falling and when growth-oriented investments are
faring poorly, and vice versa. The following charts show that this is,
in fact, exactly what happens.
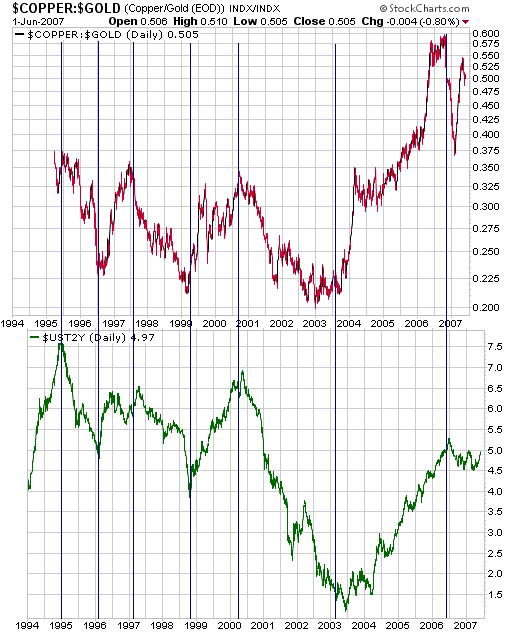
The first of our charts is a comparison between the copper/gold ratio
and the yield on a 2-year Treasury Note, with copper/gold lagged by 6
months. The chart's message is that trends in the copper/gold ratio
have, over the past 13 years, followed trends in short-term interest
rates with monotonous regularity. Specifically, when short-term
interest rates begin to trend higher then about 6 months later copper
begins to trend higher relative to gold; and when short-term interest
rates begin to trend lower then about 6 months later copper begins to
trend lower relative to gold (gold begins to out-perform).
It is quite possible that new intermediate-term trends got underway
last year when a downward reversal in the 2-year interest rate in May
was followed, about 6 months later, by a downward reversal in the
copper/gold ratio. However, the 'global growth theme' appears to have
got its second wind in March of this year, causing the 2-year interest
rate and the copper/gold ratio to move back to near last year's highs.
If the 2-year interest rate moves above last year's high -- something
that will probably only happen if the stock market rally continues for
another 1-2 months -- then new highs in the copper/gold ratio should
follow. On the other hand, a move below 4.5% by the 2-year interest
rate would suggest that we had entered a multi-year period of strength
in gold relative to copper.
The second of our
charts compares the BSE/gold ratio (the Indian stock market in gold
terms) with the GYX/gold ratio (the Industrial Metals Index divided by
the gold price). The Indian stock market is being used here as a proxy
for the global growth theme.
The chart's message is that when investors are bullish on global growth
the industrial metals will out-perform gold (the GYX/gold ratio will
trend upward), but gold will become relatively strong during periods
when growth expectations are receding.
To summarise: as long
as the demand for credit is strong enough to keep short-term interest
rates in a rising trend and investors, as a group, remain confident
about the prospects for global growth, the industrial metals markets
should do fine. However, the downside risk in the non-monetary metals
will increase exponentially once stock markets around the world
commence their next intermediate-term corrections.
Interest Rates
Bonds
The following weekly chart shows that T-Bond futures broke below their
January low last week and closed at their lowest level since last
August. Importantly, the breakdown in the US bond market was confirmed
by a similar breakdown in the Japanese bond market.
Last week's action suggests that the June-2006 bottom will be tested within the next few weeks.
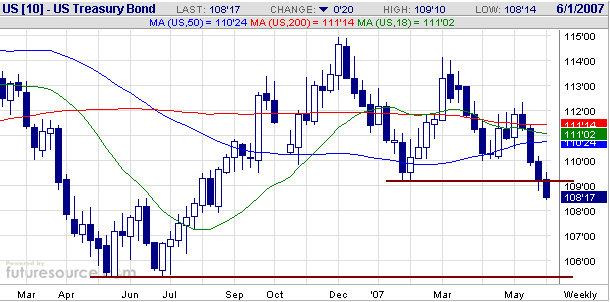
In summary: we are anticipating an upward reversal this month, but the reversal will probably occur at a lower level.
Short-Term Interest Rates
The recent breakdown in long-dated bonds was interesting and
potentially significant, but the action at the short-end of the market
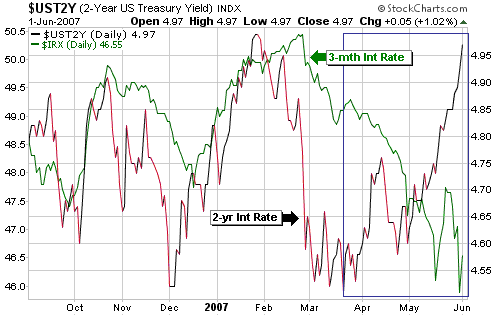
has been even more interesting. What we are referring to is the
extraordinary divergence since mid March between the yield on a 3-month
T-Bill and the yield on a 2-year T-Note, with the 3-month yield falling
from 4.85% to 4.55% in parallel with a rise in the 2-year yield from
4.55% to 4.97%. The following chart illustrates the divergence.
We are confident that the Federal Reserve is not the driving force
behind the recent strange decline in the 3-month interest rate. The way
we see it, the Fed is concerned that the 'inflation genie' could soon
escape from the bottle and would almost certainly prefer the 3-month
yield to be where it would normally be: near the Fed Funds rate target
(currently 5.25%).
For its part, the Fed has been doing what it needs to do to keep the
effective Fed Funds rate near the official target rate -- adding
reserves to the banking system whenever the actual rate moves above the
target rate and removing reserves from the banking system whenever the
actual rate falls below the target rate -- and is, we suspect, a little
miffed that the market has pushed the 3-month interest rate down to the
point where it is trading at a 70 basis-point discount to the Fed Funds
rate.
In other words, we don't think the Fed is fighting its own monetary policy.
We are also confident that the market's anticipation of Fed rate cuts
is not the reason for the 3-month interest rate being at such a low
level relative to the Fed Funds rate. This is because the December-2007
Fed Funds Futures contract is currently priced as if there were almost
no chance of an official rate cut before year-end. In fact, as the
3-month T-Bill yield has declined from 4.85% to 4.55% over the past 2.5
months the December-2007 Fed Funds Futures contract has gone from
discounting two 25 basis-point rate cuts to discounting no rate cuts.
So if the T-Bill discrepancy is not the result of meddling by the Fed
or the market's anticipation of future Fed rate cuts, then what's
causing it?
One explanation worth considering is that T-Bill yields have been
pushed downward in response to a temporary supply shortage, which, in
turn, has stemmed from higher-than-expected tax revenues (the higher
the tax revenue the lesser the quantity of new T-Bills issued by the
Treasury). That is, an unexpected fall in T-Bill supply due to the
actions of the US Treasury could theoretically have caused T-Bill
prices to rise and T-Bill yields to fall. We don't favour this
explanation, though, because we suspect that under such a scenario
there would be temporary downward pressure on the yields on all
short-dated Treasury securities, not just T-Bills.
In our opinion, the Yen carry trade is the most plausible explanation
for the recent anomalous decline in T-Bill yields (and many of the
other strange happenings in the financial world over the recent past).
We doubt that it's a coincidence, for example, that the dramatic
divergence between 3-month and 2-year interest rates since mid March
has been accompanied by a relentless slide in the Yen. With credit
spreads having shrunk to almost nothing, perhaps carry traders have
begun to direct a greater proportion of their Yen borrowings toward one
of the world's lowest-risk and most liquid markets -- the market for
3-month US Treasury Bills.
The Stock
Market
Current Market Situation
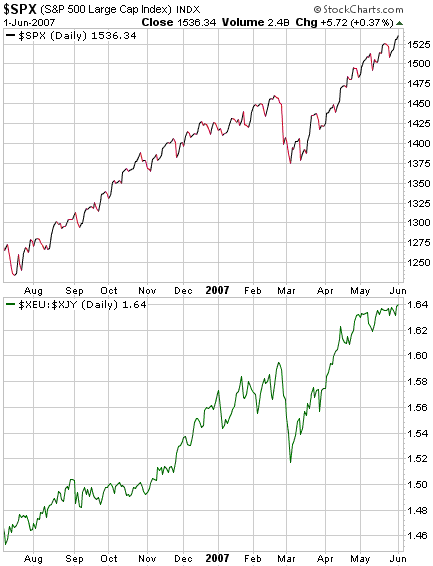
We have again included a chart comparison of the S&P500 Index and
the euro/Yen exchange rate in today's report (see below), because as
far as the stock market's short-term trend is concerned it continues to
seem as if euro/Yen is the only thing that really matters. This past
week, for example, the euro hit a new high relative to the Yen, thus
enabling the S&P500 to ignore a sharp correction in China's stock
market and end the week at a new high of its own.
One of the reasons we can't embrace the stock market's relentless
advance is that we expect the Yen to soon reverse course against both
the euro and the US$. But at the same time, we aren't keen to step in
front of this fast-moving train.
Betting against the stock market's advance doesn't interest us at this
time because there is no evidence that a downward reversal has occurred
or is imminent, but in our opinion the downside risk is high relative
to the upside potential. We therefore think it is a good time to be
hedged -- either by holding a larger-than-usual cash reserve (our
preference) or by purchasing some put options. As discussed in a
previous commentary, there's a big difference between betting that the
market is going to decline and taking out some insurance in case it
does decline.
A risk facing the
stock market that we've mentioned quite regularly over the past few
months is the risk of a breakdown in the bond market. The stock market
ignored last week's move to new 9-month lows by bond futures, but
falling bond prices always have an adverse effect on stock prices in
the end; at least, they always have in the past.
Another risk -- one that was 'brushed off' last week -- is that China's
stock market bubble will soon burst. China's Government has sent a
clear message that it will do whatever it takes to halt the stock
market's parabolic rise, so we can be sure that if last week's small
(0.2%) increase in the tax on share transactions doesn't work then
something else will be tried. A large decline in China's stock market
would take a toll on the US stock market, although it would probably
take a bigger toll on emerging market equities and industrial metals.
This week's
important US economic events
| Date |
Description |
Monday Jun 04
| Factory Orders
|
| Tuesday Jun 05 | ISM Services
| | Wednesday Jun 06
| Q1 Productivity
| | Thursday Jun 07
| Consumer Credit
| | Friday Jun 08
| Trade Balance
|
Gold and
the Dollar
Reactions to economic news
One of our tenets is that trends never change in response to economic
news, but the way a market reacts to news can provide useful
information about its underlying trend.
Taking the topical example of the Monthly US Employment Report, a
strong jobs-growth number is generally perceived to be supportive for
the US$ because it supposedly puts upward pressure on US interest
rates. A US$ bounce in the wake of an employment report that revealed a
stronger-than-expected increase in payrolls would therefore be 'par for
the course' and would tell us very little about the dollar's underlying
trend. However, failure by the US$ to bounce in the wake of good news
on the job front would be evidence that the dollar was in a downward
trend. Along similar lines, if the US$ were to move higher in the wake
of a much weaker-than-expected employment number it would be a sign
that the dollar was in an upward trend.
The most recent US Employment Report was released last Friday and
showed a larger-than-expected increase in non-farm payrolls. However,
the US dollar's reaction to this bullish news -- irrelevant news,
actually, but as noted above a strong US jobs-growth number is
generally PERCEIVED to be 'dollar bullish' -- was unimpressive in that
the knee-jerk gain in response to the news was quickly given-up. This
suggests to us that the dollar's short-term trend has not yet reversed
direction (from down to up).
We turned short-term bullish on the US$ in late April because we
thought that a) the downside risk was small, and b) an upward reversal
would probably happen within the ensuing few weeks. We still think the
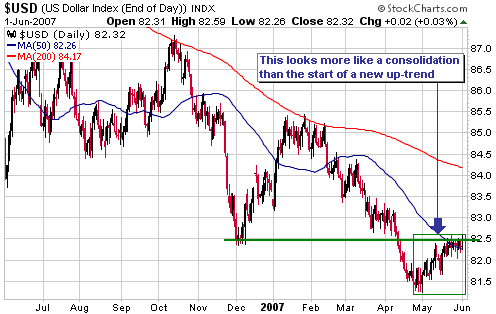
downside risk is quite small (2-3 points), but prior to Friday the
rebound from the late-April low already looked suspiciously like a
consolidation within a downtrend rather than the initial rally in a new
up-trend. The Dollar Index had, for instance, laboured for about 5
weeks just to get back to its 50-day moving average and the first line
of lateral resistance (refer to the following chart for details). Then
came Friday's failure to sustain an advance in response to bullish news.
Further to the above, the Dollar Index is still trading like it is in a
downward trend. We don't perceive much downside risk, but we can no
longer justify a short-term bullish view.
Gold Stocks
Re-visiting the late-60s model
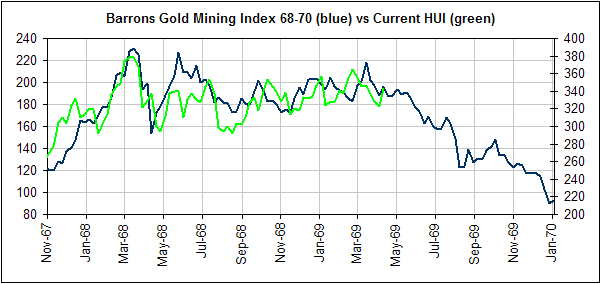
Below is an updated version of our chart comparing the Barrons Gold
Mining Index (BGMI) of the late-1960s with today's AMEX Gold BUGS index
(HUI). The chart lines up the March-1968 peak in the BGMI with the
May-2006 peak in the HUI, and suggests that we are now at the
equivalent of April-1969. If this model is valid then the HUI will
trade in the 325-355 range over the coming few weeks and then commence
a major decline during July.
Note that our
intermediate-term bearish outlook for the gold sector is not based on
the late-60s model. However, the model is consistent with our outlook,
and, as previously discussed, we think the overall financial
environment at this time is analogous to the late-1960s in a number of
ways.
We will potentially be able to use the model as a roadmap assuming an
intermediate-term bearish scenario actually does play out. We will also
be able to use it as an indicator that something other than an
intermediate-term bearish scenario is playing-out. With regard to this
latter use, a daily close by the HUI above its April-2007 high at any
time over the next few months would represent a definitive departure
from the late-60s model. We would interpret such an event as evidence
that the gold sector had commenced a new upward leg in its long-term
bull market.
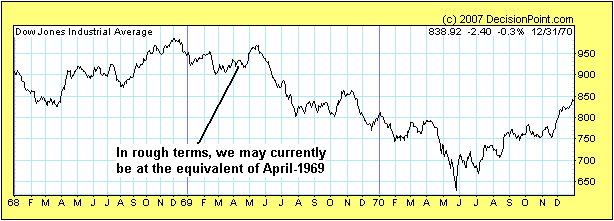
For interest's sake and because today's financial scene resembles the
late-1960s, we thought we'd take a look at how the US stock market
performed during 1968-1970.
The following chart shows that the Dow Industrials Index was strong
from March of 1968 through to May of 1969, but then embarked on a major
correction lasting 12 months. If we are presently at the equivalent of
April-1969, as the above BGMI-HUI comparison suggests, then the US
stock market will commence a large decline in July.
Current Market Situation
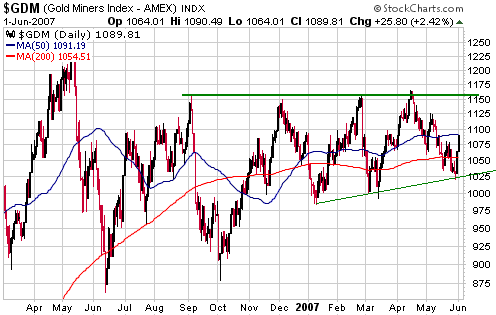
With reference to the daily chart of the AMEX Gold Mining Index (GDM)
included herewith, notice that the rally from early October through to
the beginning of December last year has been followed by 6 months of
back-and-forth trading within a narrowing range. 6 months of
essentially going nowhere has undoubtedly caused many gold share
investors to become frustrated, especially since other sectors of the
stock market have been in strong upward trends over the same period.
The feelings of frustration would have eased slightly during the second
half of last week because the gold sector, which had become very
oversold, rebounded on Thursday and Friday the way a beach-ball held
underwater would rebound upon removal of the force holding it down. We
think this will prove to be a counter-trend rebound, but if we are
wrong then the market will let us know by taking GDM and the other gold
stock indices above their April highs. The April highs are less than
10% above Friday's closing levels, so the indices won't have to do much
to negate the bearish scenario.
There's little to be gained and potentially a lot to be lost by
fighting for the first 10% of a major rally, particularly in a case
like this where a decidedly bearish intermediate-term scenario could be
brewing. Let the other guy have the first 10%.
Gold
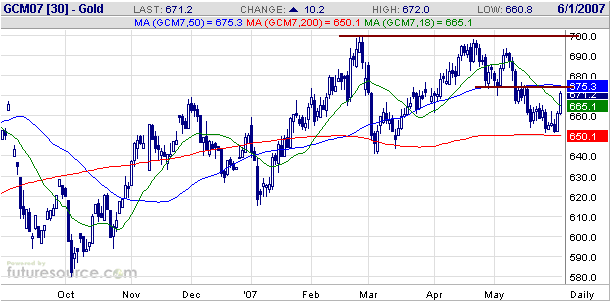
As evident on the following daily chart of June gold futures, the gold price rebounded during the final two days of last week.
News that the ECB
doesn't intend to sell any more gold between now and September might
have contributed to last week's rebound. However, we think the gold
selling conducted by the ECB under the Washington Agreement is vastly
over-rated in terms of its effects on the gold price (it draws a lot
more attention than it deserves).
The ECB sold significantly less gold last year than it was entitled to
sell under the Washington Agreement and has also parted with
significantly less gold this year than it could have done had it
maintained the run-rate implied by the Agreement (about 40 tonnes per
month). Based on Friday's announcement it seems that the pace of
selling is going to be reduced even further, however this is not the
sort of development that will have a meaningful impact on gold's price
trend. There will invariably be knee-jerk reactions to news such as
this, but gold's trend is not determined by, or even strongly
influenced by, the ECB's bullion-related operations.
Our intermediate-term outlook for gold turned bearish a couple of weeks
ago for the reasons outlined in the 21st May Weekly Update. Based on
the evidence as we see it, we strongly believe that a sombre
intermediate-term view of the gold market is appropriate at this time;
however, if we are wrong it will probably be because the inevitable
ill-effects of the past year's massive monetary inflation -- the
supplies of 18 of the world's top 20 currencies are expanding at
double-digit rates -- rise to the surface earlier than expected.
Our short-term outlook, on the other hand, is less certain, and the
bounce during the final two days of last week has unfortunately not
added any clarity.
Last week's rebound began from above the March low, meaning that gold
hasn't yet made a lower low to 'lock-in' a downward reversal in its
short-term trend. Also of note is that a typical counter-trend rebound
will retrace about half the preceding decline, which as far as June
gold is concerned would involve a move up to around $675 (a level that
happens to coincide with some lateral resistance and the 50-day moving
average). At this stage, therefore, gold's rebound from the 650s to the
low-670s has not done anything to negate the possibility that the
short-term trend has reversed downward.
As is the case with the gold stock indices, the most important nearby
resistance for gold bullion lies at the April high ($700 for the June
contract). A break above the April high would be a powerful signal that
a large advance was in its early stages, but as is also the case with
the gold stock indices there is little to be gained at this time by
anticipating such a breakout.
Update
on Stock Selections
(Note: To review the complete list of current TSI stock selections, logon at http://www.speculative-investor.com/new/market_logon.asp
and then click on "Stock Selections" in the menu. When at the Stock
Selections page, click on a stock's symbol to bring-up an archive of our comments on the stock in question)
 Western Goldfields (OTC: WGDF, TSX: WGI). Shares: 108M. Recent price: US$2.07 Western Goldfields (OTC: WGDF, TSX: WGI). Shares: 108M. Recent price: US$2.07
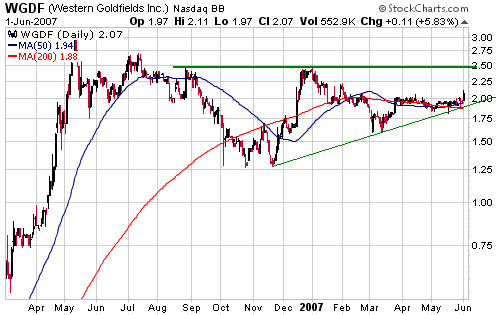
WGDF has spent almost the entire time since late-March oscillating
between US$1.90 and US$2.00, but on Friday it finally broke upward from
this narrow range.
Based on the 3.87M-ounce measured-and-indicated resource at the
company's Mesquite gold mine in California and the likelihood that the
mine will be producing gold at the annual rate of 165K ounces by this
time next year, we think WGDF would be fairly valued at around
US$3.00/share. In other words, we perceive upside potential of around
50% based on valuation.
From a technical perspective a move up to around US$3 (the May-2006
peak) also looks feasible, although there is significant resistance at
US$2.50 and WGDF's ability to rally will obviously be influenced by the
overall market for gold shares.
WGDF is in the TSI
Stocks List as a trade and could still be purchased for a trade -- with
an anticipated holding period of 1-3 months -- at the current price. As
noted above, the upside potential is significant and risk can be
managed be placing a protective stop at US$1.85 (an increase from our
initial $1.58 stop).
 Nevsun Resources (TSX and AMEX: NSU). Shares: 114M issued, 143M fully diluted. Recent price: US$2.39 Nevsun Resources (TSX and AMEX: NSU). Shares: 114M issued, 143M fully diluted. Recent price: US$2.39
Our last mention of NSU was at the end of February when the stock was
trading at US$2.04. At that time we concluded that some 'nibbling'
might be appropriate given the stock's under-valuation and its close
proximity to intermediate-term support.
It has since moved a bit higher, despite more bad news related to the
company's Tabakoto gold mine in Mali. Since being put into production
this mine has performed far worse than predicted in the feasibility
analysis. In fact, even with the gold price in the US$650-$700 range
NSU loses money on every ounce of gold it produces at Tabakoto. The
market was therefore able to shake-off last week's news that the mine
would have to be closed for a while due to a water shortage.
In any case, NSU's speculative appeal has always revolved around the
poly-metallic Bisha project in Eritrea. The location (Eritrea) is
non-ideal to say the least, but the project's size and grade make it a
world-class asset.
Sweden's Lundin Mining apparently offered to pay $5/share for NSU in
negotiations with NSU's management last year, an offer that NSU's
management rejected. Based on what has subsequently transpired, the
rejection of Lundin's offer was clearly a monumental blunder. However,
that a company of Lundin's stature was prepared to make such an offer
in the first place highlights the potential value of the Bisha project.
The upside potential offered by Bisha continues to interest us, but we
don't want to hold NSU through Bisha's construction phase if NSU's
current management remains in charge. It is therefore likely that we
will exit the stock within the next few months, preferably in response
to corporate activity (a takeover).
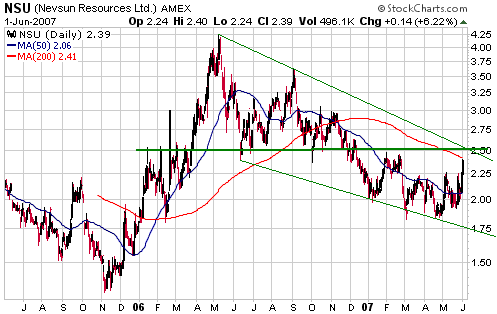
Technically, there is substantial resistance at US$2.50 (see chart
below) and a close above this resistance would indicate that an
intermediate-term bottom was put in place earlier this year.
We don't think NSU is
well suited to investors who are looking for stocks to add to a
long-term 'core' position in the gold sector. However, it has some
short-term speculative merit and could be purchased as a trade
following a pullback to around US$2.25 or following a daily close in
the US$2.55-2.65 range.
Chart Sources
Charts appearing in today's commentary
are courtesy of:
http://stockcharts.com/index.html
http://www.futuresource.com/
http://www.decisionpoint.com/

|

