


--
Weekly Market Update for the Week Commencing
4th June 2018
Big Picture
View
Here is a summary of our big picture
view of the markets. Note that our short-term views may differ from our
big picture view.
The BULL market in US Treasury Bonds
that began in the early 1980s ended in mid-2016, but there will be many years
of topping action in bond prices and bottoming action in bond yields before
major new trends get underway. A major decline in government bond prices will
unfold during the 2020s. (Last update: 11 September 2017)
The stock market, as represented by the S&P500 Index,
commenced
a secular BEAR market during the first quarter of 2000, where "secular
bear market" is defined as a long-term downward trend in valuations
(P/E ratios, etc.), gold-denominated prices and inflation-adjusted prices. This secular trend will bottom
in 2020 or later.
(Last update: 11 September 2017)
A cyclical BEAR market in the
US
Dollar
began in 2016-2017.
(Last
update: 11 September 2017)
Gold commenced a
secular bull market relative to all fiat currencies, the CRB Index,
bonds and most stock market indices during 1999-2001.
This secular trend will peak in 2020
or later.
(Last update: 11 September 2017)
Commodities,
as represented by the CRB Index, commenced a
secular BULL market in 2001 in nominal dollar terms. The first major
upward leg in this bull market ended during the first half of 2008, but
a long-term peak won't occur until 2020 or later.
(Last
update: 11 September 2017)
Copyright
Reminder
The commentaries that appear at TSI
may not be distributed, in full or in part, without our written permission.
In particular, please note that the posting of extracts from TSI commentaries
at other web sites or providing links to TSI commentaries at other web
sites (for example, at discussion boards) without our written permission
is prohibited.
We reserve the right to immediately
terminate the subscription of any TSI subscriber who distributes the TSI
commentaries without our written permission.
True
Fundamentals Summary
[Notes:
1) The date shown next to the current True Fundamentals Model (TFM) signal is
when the most recent change occurred. 2) Charts of the Gold and Equity
TFMs are included in the "Charts and Indicators" section of the TSI web
site]
|
Market |
True Fundamentals Model (TFM) |
|
Gold (US$ Price) |
Bearish (12 Jan 2018) |
|
US Equity (SPX) |
Bearish (25 May 2018) |
|
Currency (Dollar Index) |
Bullish (27 Apr 2018) |
|
Commodities (GNX) |
Bearish (01 Jun 2018) |
Last week's posts at the TSI Blog
Why
it's different this time
Summary of current
thinking/positioning
1) The Dollar Index and the euro
may have just competed multi-month counter-trend moves (up for the DX,
down for the euro), but more evidence is required to confirm this.
2) Gold has broken out to the upside in euro terms, but in US$ terms it
has not yet negated the 15th May downside breakout. This creates
uncertainty regarding the bullion market's short-term prospects.
3)
The SPX likely will make a new all-time high by the end of this month. The
risk/reward is not bullish, though, because a move to well above the
January high is unlikely and because there is a realistic chance of a
large decline during the second half of 2018.
4) There is no
evidence that the Swiss Franc has bottomed against the US$, but taking a
3-6 month view this currency's risk/reward looks very attractive.
5) New lows in bond prices (new highs in bond yields) are likely before
year-end, but the T-Bond price should have an upward bias over the coming
2-3 months.
6) Holding a cash reserve of around 30%.
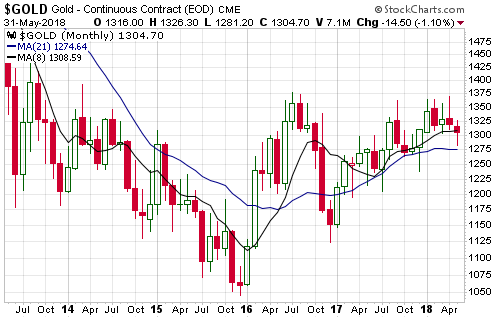
Monthly Closing
Prices
The monthly closing prices for
May didn't signal any changes, but did provide useful information. For
example, by rebounding to end the 31st May session comfortably above
critical support the euro kept alive the possibility that it's recent
decline was just a sharp correction within a multi-year upward trend.
Apart from the euro, the monthly closes of greatest interest to us were
the US$ gold price, the T-Bond price and the SPX/euro ratio (the US stock
market in euro terms).
When gold is in a bull market, short-term
corrections within intermediate-term upward trends generally hold the
8-month MA (on a monthly closing basis) and intermediate-term corrections
generally hold the 21-month MA (on a monthly closing basis). However, when
gold is in a bear market or a long-term basing pattern these monthly
moving averages will tend to either act as resistance or be less
significant.
The following monthly chart shows that since making a
long-term bottom in December-2015 the US$ gold price has oscillated around
its 8-month and 21-month MAs. It also shows that the 31st May close was
below the 8-month MA and above the 21-month MA. This is consistent with
our view that gold is immersed in a long-term basing pattern, not a bull
market.
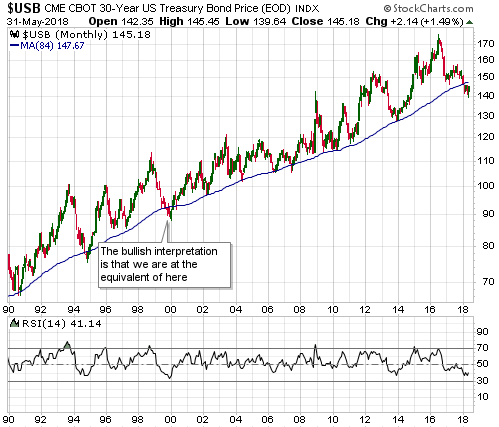
The 30-year T-Bond just achieved another monthly close below its
84-month MA, which means that another piece of evidence supporting the new
long-term bear market scenario has been added to the pile. However, bond
bulls could still argue that the T-Bond's current position is similar to
late-1999.
A rebound followed by a decline to below the May-2018
low would be the final nail in the bond bull market's coffin.
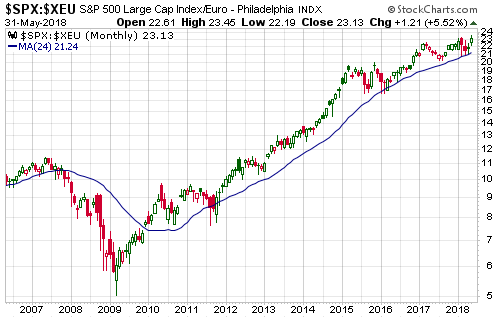
A monthly close by the SPX/euro ratio below its 24-month MA should
provide a reliable and timely signal that an equity bear market has begun.
For example, such a signal was generated in November-2007 -- one month
after the start of the last equity bear market.
Such a signal was
not generated during the 2015-2016 decline and also was not generated
during the H1-2018 decline. Furthermore, SPX/euro traded above its
January-2018 high during May-2018. This indicates that an equity bear
market has not begun.
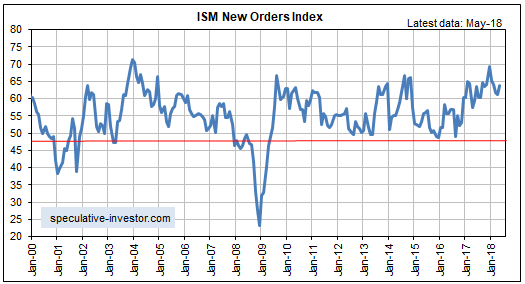
US Recession
Watch
As regular TSI readers would
know, the three leading indicators of US recession that we care about are
the ISM New Orders Index (NOI), Real Gross Private Domestic Investment
(RGPDI) and the yield curve. It's still the case that not one of these
indicators is close to giving a recession warning.
The NOI, for
instance, has pulled back since making a 13-year high in December-2017,
but remains far above the level that it would have to drop below (the red
line on the following chart) to warn of a recession. Furthermore, the
latest data revealed an uptick for May.
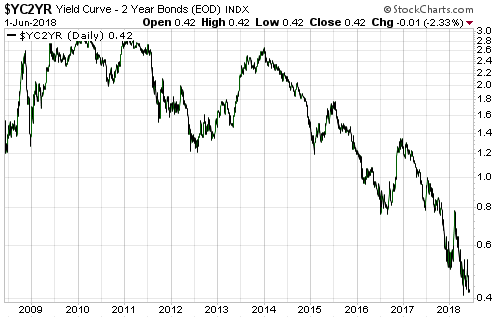
The next quarterly calculation of RGPDI won't be available until
late-July, but the yield curve constantly updates and at the end of last
week it was near its flattest in more than 10 years. This is evidenced by
the following chart of the spread between the 10-year yield and the 2-year
yield. Therefore, we are yet to witness the trend reversal in the yield
curve from flattening to steepening that generally PRECEDES a recession.
Refer to last week's Interim Update for an explanation of why the yield
curve reverses course in this way prior to a recession.
Based on the latest data, our rough estimates of recession start-time
probabilities are unchanged from a month ago. Here they are:
-
Q2-2018: 0%
- Q3-2018: 10%
- Q4-2018: 30%
- Some time in 2019:
>80%
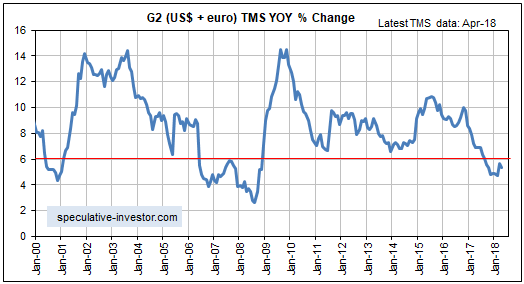
As previously explained, the main reason for our high 2019
recession probability estimate is the decline in the G2 (US plus
euro-zone) monetary inflation rate. It appears that the G2 monetary
inflation rate has fallen far enough to bring the artificial boom to an
end, with the only unknown being the timing of the boom-bust transition.
What to expect
from the T-Bond rebound
It was late April when we
started speculating that the T-Bond was close to a multi-month bottom and
it was one week ago that we identified 18th May as the date of the bottom.
It was also one week ago that we mentioned lateral resistance at 147 as an
upside target for a short-term T-Bond rebound. We guessed that this target
would be reached within three months, but thanks to the 'flight to safety'
prompted by Italy's political situation the target was almost reached
within two days.
The 29th-30th May spike up to near resistance at
147 likely created a top that will hold for at least two weeks, but at the
same time it probably means that the ultimate top for the rebound will be
above 147.
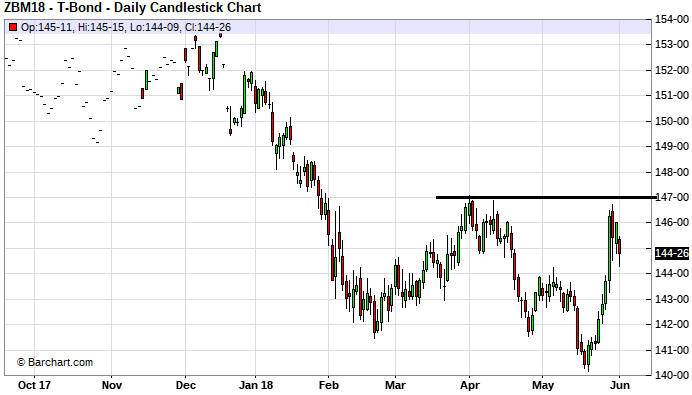
The COT data also suggest that the T-Bond's rebound will extend beyond
147. We are referring to the fact that despite the quick rebound in the
Treasury market, the latest COT report shows that speculators increased
the size of their collective bearish bet in 10-year T-Note futures to a
new all-time extreme.
We now have 149-150 in mind as an upside
target for the T-Bond rebound.
The Stock Market
Last week we wrote that in the
short-term the stock market would be helped by a pullback in market
interest rates, but that the upside would be limited because the monetary
backdrop was tight and likely to get tighter as the Fed ramped up the pace
of its balance-sheet reduction (its QT program).
Referring to an
article posted
HERE
and the Fed's portfolio
HERE, we also wrote that an immediate impact of the Fed's QT program
should be felt on the days when a large quantity of the Fed's holdings are
scheduled to mature. We pointed out that the last such date was 15th May,
when there was a sharp decline in the T-Bond and a 20-point decline in the
SPX, and that the next such date was 31st May.
With regard to the
SPX's performance a similar effect occurred on 31st May (there was a
20-point decline), but there was no noticeable adverse effect on the bond
market. Also, the 31st May decline was more than fully offset by the 1st
June advance, so it seems that if the Fed's balance-sheet reductions are
having an immediate and direct effect then the effect lasts only one day.
The next three big maturity dates for the Fed's bond holdings are 30th
June, 31st July and 15th August.
Turning to the recent price
action, a week ago we wrote:
"We won't be surprised if the NDX
tests its 2018 high during the first two trading days of this week, but we
will be surprised if it makes a solid break into new-high territory within
the next two weeks. Our guess is that more choppiness lies in store over
the coming fortnight."
The NDX didn't test its 2018 high last
week, but it has a good chance of doing so this week given that it broke
upward from a 3-week sideways consolidation last Friday.
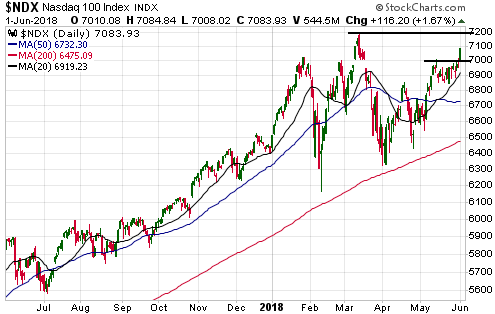
Indications are that the US stock market will maintain an upward bias
for at least another month, but we suspect that downside volatility will
re-emerge during the third quarter.
This week's
significant US economic events
[Notes:
1) The most important events
(to the markets) are shown
in bold. 2) A list of global economic events can be found
HERE]
| Date |
Description |
|
Monday Jun-04 |
Factory Orders |
|
Tuesday Jun-05 |
ISM Non-Mfg Index |
|
Wednesday Jun-06 |
International Trade Balance |
|
Thursday Jun-07 |
Consumer Credit |
|
Friday Jun-08 |
No important events scheduled |
Gold and the Dollar
Gold
No Bull
Displayed below is a weekly
chart of the gold/SPX ratio. The blue line on the chart is the 200-week MA and
the rectangle drawn on the chart covers the period from the December-2015 low.
This is when the gold price made a multi-year low in US$ terms.
It's
possible that the December-2015 low will turn out to be the bear-market bottom
in nominal dollar terms, but whether or not gold is in a bull market isn't
determined solely by its performance in terms of fiat currency. It's also
determined by its performance relative to industrial commodities and financial
assets, with the S&P500 Index (SPX) being the best proxy for financial assets.
Gold's performance relative to the SPX makes it clear that a gold bull
market did not begin in December-2015. In SPX terms, the bearish trend that
began in 2011 appears to be intact.
A solid break by gold/SPX above its
200-week MA will provide confirmation of a major trend reversal. This is likely
to happen during the first year of the next cyclical gold bull.
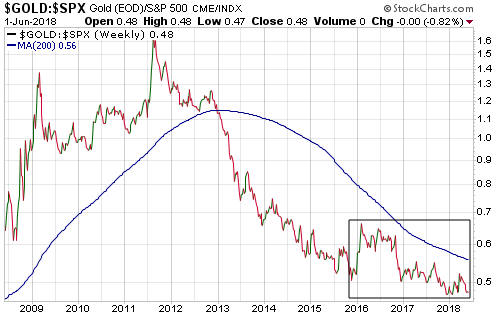
At the moment we appear to be in the midst of either a long-term basing
pattern or a multi-year rebound within a bear market.
Current Market Situation
Despite some
wild action in the bond and currency markets, the gold market was quiet last
week. The price was down a few dollars over the course of the week.
With
regard to the recent performance of gold in US$ terms, what we have is a
downside breakout on 15th May followed by a rebound to 'test' the breakout. At
this stage the test has been successful, meaning that former support (now
resistance) has limited the rebound.
As previously advised, preliminary
evidence that gold has made a sustainable turn to the upside would be a daily
close above the 200-day MA while decisive evidence of such a turn would be a
weekly close above the 200-day MA. The 200-day MA now coincides with important
lateral resistance at $1309, so gold must achieve a weekly close above $1309 to
indicate that its short-term trend has changed from down to up.
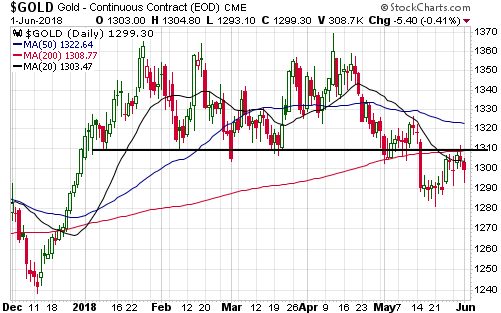
The sentiment backdrop (as indicated by the COT data) remains slightly
supportive while the fundamental backdrop remains bearish. However, it likely
would take only a modest amount of additional strength in the T-Bond price to
shift the fundamental backdrop in gold's favour.
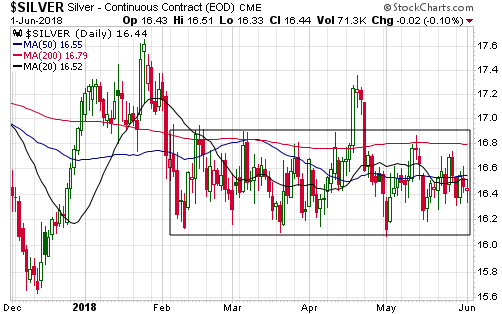
Silver
Apart from a 3-day period in April when there was a failed upside breakout
attempt, the silver price has now spent 4 months oscillating between $16.10 and
$16.90. This is remarkable stability for a market that tends to be volatile.
Sentiment remains neutral and as far as we can tell there is no basis for a
prediction about the direction of the coming breakout from the $16.10-$16.90
range. What we can say is that a downside breakout from the 4-month horizontal
range could establish a much more constructive sentiment backdrop and thus set
up a good buying opportunity.
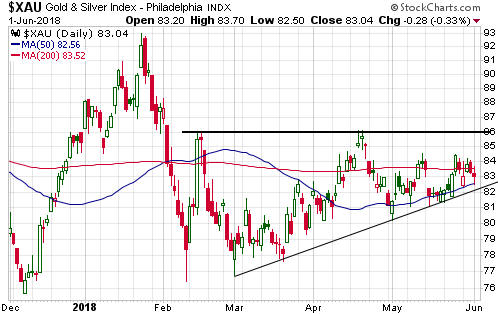
Gold Stocks
The gold-mining indices and ETFs have been
in consolidation mode since early last year. As if that wasn't enough to lull
speculators to sleep, they have also been consolidating on a short-term basis.
Recently, volatility in the gold-mining sector has been about as low as it ever
gets.
For the XAU, there is some resistance at 84.5 but the first
important resistance is at 86. Going the other way, there is trend-line support
at 82 and then lateral support at 80.
We therefore view the short-term
consolidation range as 82-86. A daily close above 86 would suggest that the
index was on its way to at least 92 (near the top of the intermediate-term
consolidation range) and to possibly as high as 115 (the 2016 peak).
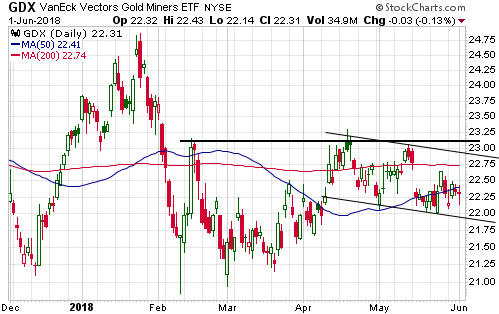
For
GDX, a "flag" pattern has developed over the past 6 weeks. This pattern suggests
resistance at $22.90 and support at $21.90 for the coming week. A breakout from
this range would be an early warning of the likely direction of a much larger
move.
We
suspect that a quick and sizable move in the gold-mining sector will begin this
month, but the price action is not yet providing clues about the direction of
the move. The gold-bearish fundamental backdrop suggests that the direction will
be down, but at this point it wouldn't take much to turn our gold model from
bearish to bullish. It's likely that a rise in the T-Bond price to around 146
(on a weekly closing basis) combined with a modest amount of weakness in the
stock market would do it. In any case, while a gold-bullish fundamental backdrop
is a prerequisite for a substantial multi-quarter upward trend, it isn't
essential for a 1-2 month surge.
Due to the high probability of a sizable
short-term move combined with the lack of clues regarding the likely direction
of the move, it would be reasonable for option traders to simultaneously buy
out-of-the-money calls and puts on a gold-mining ETF such as GDX. This was
discussed in last week's Interim Update. The subsequent two days of sideways
trading obviously haven't changed anything.
Investors with substantial
current exposure to the gold-mining sector already have the short-term rally
scenario covered and could consider doing some hedging in case the short-term
plunge scenario plays out. For example, they could buy some GDX September put
options or raise some cash.
The Currency Market
The Euro
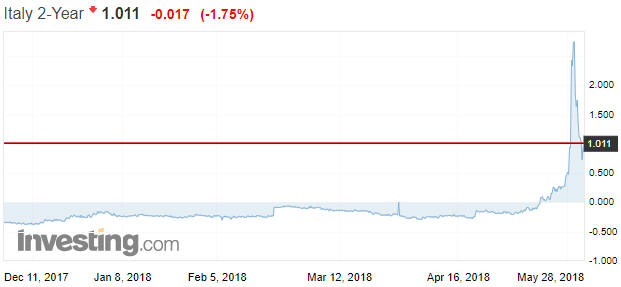
The euro plunged last Tuesday
(29th May) due to the perception that it was facing another existential threat.
The threat emanated from Italy, where for a brief time it seemed like the
country would be forced back to the polls for an election that in effect would
be a referendum on remaining within Europe's monetary union.
The fear
that Italy could be on its way out of the monetary union caused Italian
government bonds to crash on Tuesday, driving bond yields sharply higher across
the curve. The most dramatic action occurred at the short end of the curve, with
the yield on the 2-year Italian government bond rocketing up from around 0.3% to
2.8% within the space of several hours.
The threat dissipated over the
rest of the week, though, as Italy's political situation appeared to stabilise.
This caused Italian government bond yields to plunge, although the 2-year yield
still ended the week well above where it began the week.
Here's a picture
showing last week's dramatic turn of events. Notice that Italy's 2-year
government bond yield was drifting along in NEGATIVE territory until mid-May.
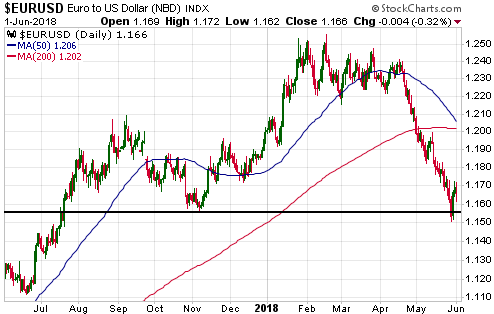
From last week's Interim Update:
"If the euro closes below 1.156
on either Thursday or Friday of this week, and especially if it closes below
1.156 on both Thursday and Friday, the odds will shift in favour of the euro's
2017 rally being an intermediate-term upward trend within an on-going bear
market. Alternatively, if the euro manages to avoid a weekly and monthly close
below 1.156, as appears likely at this time, then the market action during the
first half of this week could turn out to be the climax of a multi-month
correction."
The euro broke below critical support on Tuesday but
then recovered to end both the month and the week comfortably it. Therefore, at
this stage it looks like Italy's political situation resulted in a euro selling
climax and a bottom that will hold for at least a few weeks.
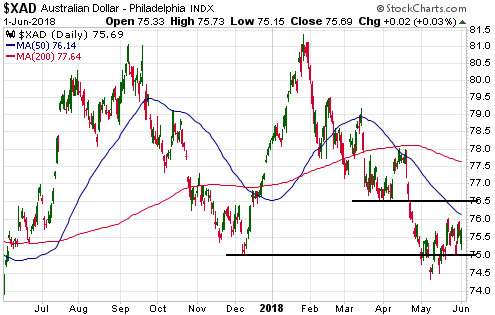
The Australian Dollar (A$)
The A$
generated a bullish signal in the form of a false downside breakout in early
May, but it hasn't yet confirmed that a short-term bottom is in place. Such
confirmation will require a daily close above the 50-day MA (currently at 76.1)
and lateral resistance at 76.5.
Updates
on Stock Selections
Notes: 1) To review the complete list of current TSI stock selections, logon at
http://www.speculative-investor.com/new/market_logon.asp
and then click on "Stock Selections" in the menu. When at the Stock
Selections page, click on a stock's symbol to bring-up an archive of
our comments on the stock in question. 2) The Small Stock Watch List is
located at http://www.speculative-investor.com/new/smallstockwatch.html
 Company
news/developments for the week ending Friday 1st June 2018:
Company
news/developments for the week ending Friday 1st June 2018:
[Note: AISC = All-In Sustaining Cost, FS = Feasibility Study, FY = Financial
Year, IRR = Internal Rate of Return, ISR = In-Situ Recovery, MD&A = Management
Discussion and Analysis, M&I = Measured and Indicated, NAV = Net Asset Value,
NPV(X%) = Net Present Value using a discount rate of X%, NSR = Net Smelter
Return, P&P = Proven and Probable, PEA = Preliminary Economic Assessment, PFS =
Pre-Feasibility Study]
*Alio Gold (ALO) reported
the final set of results from the surface drill program at its Ana Paula gold
project in Guerrero, Mexico. The 3,800m program was initiated in January 2018
and consisted of six drill holes of 600 to 700 metres each targeting the complex
breccia extension below the proposed open-pit. Additionally, two 300m holes were
drilled into the near surface hydrothermal breccia to test its southern
extension.
Overall, these latest results were neutral at best. The
intercepts from the near-surface, low-grade hydrothermal breccia were positive,
but the intercepts from the below-pit, high-grade breccia were disappointing.
ALO has been performing poorly on the ground and in the stock market.
However, we expect that it will rebound strongly in response to a sector-wide
rally during the second half of this year, providing a much better opportunity
to exit.
*Almaden Minerals (AAU) reported the
assay results from holes drilled 1.2 kms from the PFS pit at its Ixtaca
gold-silver project. The results included an intercept averaging 0.83-g/t gold
over 89.5m and suggest the potential for significant resource expansion. This is
good news.
Our continuing interest in AAU is due to it being a very
under-valued junior gold miner that likely will attract a takeover bid after
completion of the Ixtaca FS late this year.
*Cobalt 27
Capital Corp. (KBLT.V) published its financial results for the
March-2018 quarter.
A week ago, we wrote: "At current metal prices and
taking into account the HIG [streaming] deal, our estimate of KBLT's net asset
value (NAV) is C$14.50-$15.00. Our estimated NAV will rise to C$17.00-C$17.50 if
the deal with the two local Ramu stakeholders is completed as mentioned above."
Based on the balance sheet included with the latest quarterly financial
results, KBLT's NAV prior to the HIG streaming deal was C$10.70/share. Adding
the value that we estimate is contributed by the streaming deal takes the NAV to
C$14.50/share, so our earlier calculation was close to the mark.
A stock
such as this would normally trade at a 10%-30% premium to NAV, but KBLT is
presently trading at a 15% discount. This most likely reflects market concerns
about the reliability of the cash flow that the streaming deal will generate.
*Energold Drilling (EGD.V) published its financial
results for the March-2018 quarter.
Revenue for the quarter was about
C$24M, which constitutes a 26% improvement on a year-over-year basis. It was the
highest quarterly revenue in 4 years, indicating that the improvement in EGD's
business that began during the March quarter of 2017 continues.
EGD's
top-line improvement hasn't yet resulted in bottom-line profitability, in that
the company reported a net loss of C$1.9M for the quarter. Importantly, however,
about C$6M was added to the balance sheet, with working capital rising from
C$51.5M to C$57.5M while long-term debt remained the same.
Near its
current low price of C$0.38/share, EGD is a relatively low-risk way to obtain
leveraged exposure to the prices of metals and oil.
*Golden
Arrow Resources (GRG.V) published its financial report for the
March-2018 quarter. The report shows working capital of C$12.9M at 31st March,
down by C$3.4M since the end of the preceding quarter.
GRG's financial
position remains strong for a company of its size, but it will have to raise
additional money within the coming 6 months to fund its share of the capex for
the Chinchillas silver mine in Argentina. We previously thought it would have to
raise about C$10M, but the amount required may be closer to C$15M.
The
Pirquitas-Chinchillas project is owned 25% by GRG and 75% by SSR Mining. It is
expected to have average annual production of 6.1 million ounces of silver, 35
million pounds of lead and 12.3 million pounds of zinc.
List
of candidates for new buying
From within the ranks of TSI stock
selections the best candidates for new buying at this time, listed in
alphabetical order, are:
1) ALK.AX (last Friday's closing price: A$0.28)
2) CLQ.AX or CLQ.TO (last Friday's closing price: A$1.03)
3) EGD.V
(last Friday's closing price: C$0.38)
4) PG.TO (last Friday's closing
price: C$2.70)
5) PRQ.TO (last Friday's closing price: C$1.22)
The
above list is limited to five stocks. It will sometimes contain less than five,
but it will never contain more than five regardless of how many stocks are
attractively priced for new buying.
EV&V
Stocks Table
"EV&V" stands for Electric Vehicle and Vanadium,
and "EV&V Stocks" are stocks that provide exposure to the commodities that will,
we think, experience a substantial increase in demand due to the proliferation
of electric vehicles or growth in the use of Vanadium Redox Batteries (VRBs).
One way or another we are currently covering nine such stocks.
For ease
of reference, here is a table of the EV&V stocks that we are covering in some
way (this is an update of the table that was originally included in the 7th
March 2018 Interim Update). In the table we have noted the specific EV&V-related
commodity exposure provided by each stock and whether the stock is a member of
the TSI Stocks List or the
Small
Stocks Watch List (SSWL). To give an indication of company size, we have
also noted the current market cap.
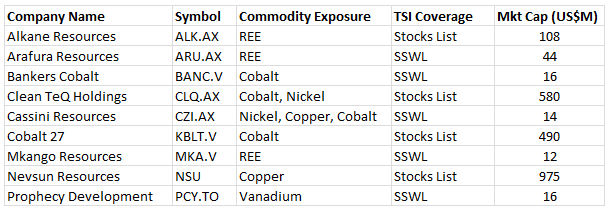
Two of the SSWL stocks included in the above table had important news within
the past three weeks.
First, Arafura Resources (AUR.AX)
reported on 14th May that it had received environmental approval from the
Australian Government for its 100%-owned Nolans Neodymium-Praseodymium (NdPr)
project in the Northern Territory. This was the final step in the project's
environmental approval process.
Completion of the Nolans project FS is
the next major milestone for ARU. This is scheduled for December-2018.
Note that NdPr is used to make the permanent magnets that go into EV motors.
Regardless of how battery technology evolves, NdPr should remain an essential EV
material.
Second, Prophecy Development Corp. (PCY.TO)
published the results of a PEA for its Gibellini vanadium project in Nevada. The
plan is to develop Gibellini into an open-pit, heap leach mine.
The
Gibellini deposit is low grade (the average vanadium pentoxide (V2O5) grade of
the estimated resource is less than 0.30%) and the average metallurgical
recovery is low at around 60%, but on the plus side the strip (waste/ore) ratio
is very low at 0.17 and the mine plan is straightforward.
According to
the PEA, at anywhere near the current V2O5 price it would be possible to develop
Gibellini into a very profitable mine that paid back its US$116M initial capex
in quick time. For example, at $12.73/pound for V2O5 (about 10% below the
current market price) it is estimated that the Gibellini mine would have a
post-tax NPV(7%) of US$338M, a post-tax IRR of about 51% and a payback period of
1.7 years.
The above NPV compares very favourably with PCY's current
sub-US$20M market cap.
Chart Sources
Charts appearing in today's commentary
are courtesy of:
http://stockcharts.com/index.html
http://www.investing.com/
http://www.barchart.com/
