


-- Weekly Market Update for the Week Commencing
4th July 2016
Big Picture
View
Here is a summary of our big picture
view of the markets. Note that our short-term views may differ from our
big picture view.
The BULL market in US Treasury Bonds
that began in the early 1980s ended in early-2015, but there will be many years
of topping action in bond prices and bottoming action in bond yields before
major new trends get underway. (Last update: 29 June 2015)
The stock market, as represented by the S&P500 Index,
commenced
a secular BEAR market during the first quarter of 2000, where "secular
bear market" is defined as a long-term downward trend in valuations
(P/E ratios, etc.) and gold-denominated prices. This secular trend will bottom sometime between 2018 and 2020.
(Last update: 29 June 2015)
A secular BEAR market in the
US
Dollar
began during the final quarter of 2000 and ended in July of 2008. This
secular bear market will be followed by a multi-year period of range
trading.
(Last
update: 09 February 2009)
Gold commenced a
secular bull market relative to all fiat currencies, the CRB Index,
bonds and most stock market indices during 1999-2001.
This secular trend will peak sometime between 2018 and 2020.
(Last update: 29 June 2015)
Commodities,
as represented by the CRB Index, commenced a
secular BULL market in 2001 in nominal dollar terms. The first major
upward leg in this bull market ended during the first half of 2008, but
a long-term peak won't occur until 2018-2020.
(Last
update: 29 June 2015)
Copyright
Reminder
The commentaries that appear at TSI
may not be distributed, in full or in part, without our written permission.
In particular, please note that the posting of extracts from TSI commentaries
at other web sites or providing links to TSI commentaries at other web
sites (for example, at discussion boards) without our written permission
is prohibited.
We reserve the right to immediately
terminate the subscription of any TSI subscriber who distributes the TSI
commentaries without our written permission.
Outlook Summary
Market
|
Short-Term
(1-3 month)
|
Intermediate-Term
(6-18 month)
|
Long-Term
(2-5 Year)
|
|
Gold
|
N/A |
Neutral
(27-Jun-16) |
Bullish
|
|
US$ (Dollar Index)
|
N/A |
Bullish
(29-Feb-16) |
Neutral
(19-Sep-07) |
|
US Treasury Bonds (TLT)
|
N/A |
Bearish
(19-Oct-15)
|
Bearish |
|
Stock Market
(DJW)
|
N/A |
Neutral
(04-Jul-16) |
Bearish
|
|
Gold Stocks
(HUI)
|
N/A |
Neutral
(04-May-16) |
Bullish
|
|
Oil |
N/A |
Neutral
(26-Oct-15) |
Bullish
|
|
Industrial Metals
(GYX)
|
N/A |
Bullish
(04-July-16) |
Bullish |
Notes:
1. Our short-term expectations are discussed in the commentaries, but except in
special circumstances we won't attempt to assign a "bullish", "bearish" or
"neutral" label to these expectations.
2. The date shown below the current outlook is when the most recent outlook change occurred.
3. "Neutral" means that we think risk and reward are roughly in balance with respect to the timeframe in question.
4. Long-term views are determined almost completely by fundamentals and intermediate-term views
are determined by a combination of fundamentals, sentiment and technicals.
Last week's posts at the TSI Blog
The Masters of the Universe Fallacy
Gold
has peaked for the year
Summary of current
thinking/positioning
1) Concerned about short-term
downside risk in gold, silver and the associated mining stocks, but
comfortable maintaining substantial 'core' exposure in anticipation of
large additional gains over the next two years. Continuing to pick away at
'special situations' -- small/illiquid gold stocks that could generate
large gains independently of sector-wide performance.
2)
Maintaining relatively small exposure to non-gold commodity-related stocks
and hedged against short-term weakness via XME put options, but getting
more bullish about intermediate-term prospects. Looking for opportunities
to boost exposure to base-metal miners.
3) Thinking that the US
stock market is rolling over into a multi-week decline and betting (via
QID call options) on short-term weakness, although betting less
aggressively now than two weeks ago by virtue of having sold some QID
calls during the Brexit mini-panic.
4) Thinking that industrial
commodities (oil, copper, platinum, etc.) and the main commodity
currencies (A$, C$) made long-term bottoms during Q1-2016, but that the
bottoms could be tested during the second half of this year as part of a
basing process.
5) Thinking that something will soon have to give,
because 'risk' assets have rebounded strongly following the Brexit drama
while the highest-profile 'safe haven' assets (T-Bonds and gold) have
stayed strong.
6) Anticipating a tradable decline in the T-Bond and
averaging into TBT call options in an effort to profit from the decline.
7) Maintaining an unusually-large cash reserve of around 50% in
recognition of the downside risk in almost all equities.
Money Matters
Post-Brexit Monetary
Support
As far as we can tell, the most important central
banks ended up doing very little in the days immediately following the
Brexit 'shock'.
The BOE promised that it would inject up to 250B
Pounds into the financial system, but it appears to have injected only a
few billion to date. However, it has increased the frequency of its
liquidity injections (from monthly to weekly) and will probably soon
announce additional measures to boost the money supply. It has also
strongly hinted that an interest-rate cut is coming, as if cutting the
official interest-rate target from the current level of 0.50% to 0.25% or
0% could possibly do any good.
The Fed appears to have done almost
nothing, as the balance-sheet item called "Central Bank Liquidity Swaps"
rose by only $2B (from zero) during the latest week.
Monetary Inflation Update
With the ECB having just got
around to updating its monetary data for May it's a good time for us to
present a couple of monetary inflation charts.
The first chart
shows that the year-over-year (YOY) rate of growth in US True Money Supply
(TMS) continues to oscillate in very narrow range around 8%. The US
monetary inflation rate has now essentially flat-lined for 2.5 years,
which is something it has never done before.
Just to be clear, this
doesn't mean that the US money supply has been stable; it means that the
rate of increase in the supply of US dollars has been stable at a
relatively (by long-term historical standards) high level. Since the Fed
hasn't made a net addition to the US money supply since the end of QE3
about 20 months ago, this means that the commercial banks have been
lending enough new money into existence to keep US monetary inflation at a
fairly robust rate.
The second chart shows what we call G2 (US plus euro-zone) monetary
inflation. The G2 monetary inflation rate appears to be the most important
influence on the global boom-bust cycle, with a decline to below 6%
creating the conditions for a bust (severe economic recession and/or
financial crisis) to begin within 12 months.
The ECB's aggressive
money-pumping during 2014-2015 probably delayed the onset of the next bust
phase, but the rate of money creation in the euro-zone has begun to slow
and the result is that the G2 monetary inflation rate is now in a downward
trend. It hasn't yet fallen to levels that exposed the mal-investments in
2000-2001 and 2007-2008, but it's possible that the structural economic
damage done by the unprecedented central-bank intervention of the past
several years will cause the next bust to begin in parallel with a higher
monetary inflation rate.
T-Bond Update
The 30-year T-Bond hasn't yet
closed above the spike high reached on 24th June in the immediate
aftermath of the Brexit news, but it made a new intra-day high on Friday
1st July and there is no evidence that its upside blow-off is complete.
Sentiment, price action and inter-market relationships all suggest
that a multi-month top will soon be in place.
The Stock Market
The US
Short Term
The "Brexit" news
prompted a sharp 2-day sell-off that was fully retraced over the
subsequent 4 trading days. We noted last week that this news did not in
any way lower the value of the US stock indices and was therefore not a
good reason for lower prices, but that there were other reasons to expect
a tradable price decline.
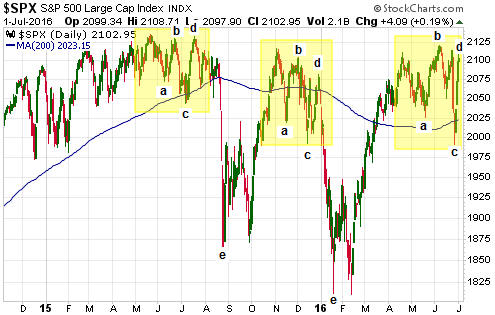
With regard to the price action, not much
has changed. In fact, even with the extreme volatility of the past 2 weeks
the SPX's price pattern over the past two months looks similar to its
price pattern during the two months leading up to the large declines that
occurred in August-2015 and January-2016.
We've attempted to
highlight the similarities on the following chart. The message we are
trying to convey by labeling the turning points is that the market's
current position could be akin to its position in mid-July and
late-December of last year. If so, there will be a sizable decline within
the next five weeks.
However, it's always important to take into account the differences as
well as the similarities. With regard to short-term risk/reward, the
biggest difference we know of is the market's current internal strength.
This can be measured in multiple ways and is measured on the following
chart by the numbers of individual stocks making new 52-week highs and
lows. If time permits, in this week's Interim Update we'll show another
useful way of measuring internal strength that is sending the same
message.
As illustrated by the middle section of the chart, there
are presently a lot fewer individual NYSE-traded common stocks making new
lows and a lot more making new highs than there were just prior to the
large declines that got underway in July and December. And as illustrated
by the bottom section of the following chart, the 10-day MA of the
high-low differential is in a much stronger position today than it was
just prior to the starts of the large declines that got underway in July
and December.
This is evidence that if a multi-week decline soon
begins, it will not be as severe as the August-2015 and January-2016
episodes.
The bottom line is that the short-term downside risk is still greater
than the upside potential, but the risk/reward isn't as skewed towards
risk as it was on previous occasions over the past 12 months when the SPX
was near its current price (around 2100).
Intermediate Term
The evidence in
support of our view that a US equity bear market began during May-July of
last year is not as strong as it should be. Let's put it this way: 12
months into a bear market the evidence of the bear's existence should be
clear-cut, which it presently isn't.
The price action has been
non-committal. It will still be consistent with a bear-market scenario if
-- and only if -- there is a significant decline during the month of July,
but, as mentioned above, the market internals are positive.
Also
worth noting is that although an equity bear market doesn't necessarily
require an economic recession, it is rare for an equity bear market to
unfold in the absence of a recession. Currently, the three most reliable
indicators are saying that the US economy is not in recession and is
unlikely to enter a recession within the next three months.
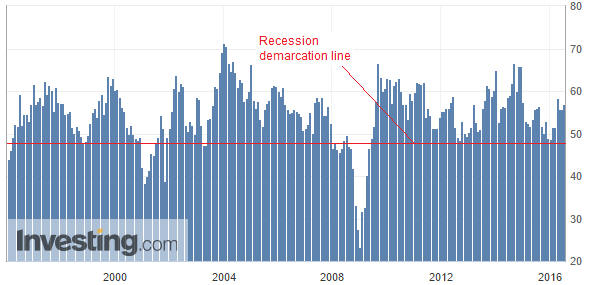
One of
these indicators is the monthly ISM Manufacturing New Orders Index, the
latest update of which happened last Friday. As shown below, the New
Orders Index moved a little higher in June and is comfortably above the
level that would signal imminent recession.
The other two recession indicators worth paying attention to are Real
Gross Private Domestic Investment, which is currently non-committal, and
the
Yield Curve, which is not yet warning of recession.
That the
evidence in support of the bear-market scenario is not as forceful as it
should be suggests that we should give more credence to the view that the
decline from the 2015 peak to the February-2016 bottom was a bull-market
correction. We are doing exactly that, which is why our intermediate-term
stock market outlook has shifted from "bearish" to "neutral". Hopefully
there will be enough evidence pointing one way or the other by the end of
July to justify a more definitive outlook.
Note that if the
stock-market weakness of 2015-2016 was a correction within a continuing
bull market then commodity-related stocks will probably be among the
leaders to the upside over the coming 12 months.
Europe
The European banking industry is the current focal point of systemic
risk.
The Europe 600 Banks Index (FX7) bounced off long-term
support at 120 last week (120 coincides with the bottom reached during the
sovereign debt crisis of 2011-2012), but the bounce has been unimpressive
to date. This could be part of the reason that safe-haven assets such as
gold and T-Bonds are still strong.
We wonder how much weaker the
European banking industry will have to get before the ECB ends its
destructive negative interest-rate policy.
This week's
significant US economic events
[Notes:
1) The most important events
(to the markets) are shown
in bold. 2) A list of global economic events can be found
HERE]
| Date |
Description |
|
Monday July 04 |
US markets closed for public
holiday |
| Tuesday
July 05 |
Factory Orders |
|
Wednesday July 06 |
Trade Balance
ISM Non-Mfg Index
FOMC Minutes |
|
Thursday July 07 |
No important events scheduled |
|
Friday July 08 |
Monthly Employment
Report
Consumer Credit |
Gold and the Dollar
Gold
The Fundamentals
Thanks to relative
weakness in bank stocks and the on-going downward trend in the real US interest
rate (the 10-year TIPS yield made a new 3-year low last week), gold's true
fundamentals remain bullish.
Today's gold-bullish fundamental backdrop
has a lot to do with the expected actions of the Fed. This is because in
addition to influencing inflation expectations and nominal bond yields, the
Fed's expected moves on the interest rate front now directly affect the relative
strength of the banking sector (bank stocks now get a boost when the expected
level of the Fed Funds (FF) rate rises due to the fact that the Fed now
implements hikes in the Funds rate by increasing the interest rate it pays the
banks on their reserves).
The expected actions of the Fed have undergone
an extraordinary change since early-June. Since then not only has the market
given up on a Fed rate hike over the remainder of 2016, it now expects that the
Fed will essentially be on hold until at least 2018! We know this because the
following chart of the January-2018 Fed Funds Futures (FFF) contract shows that
the expected level of the FF rate in January-2018 is 0.51% (the FF rate implied
by the futures contract is 100 minus the futures price), which is only about
0.13% above the current FF rate. To put it another way, the market currently
thinks that there is no chance of a Fed rate hike over the remainder of 2016 and
that there will, at MOST, be a single 0.25% rate hike during the course of 2017.
What makes the change in the expected actions of the Fed so extraordinary is
that it happened in parallel with no net change in the stock market and no
significant deterioration in the economy (the economy is lacklustre, but no more
so today than a month ago). The fact that there appears to be minimal
justification for the change of the past few weeks means that there is the
potential for a quick change in the opposite direction. All it would possibly
take to set such a change in motion is a stronger-than-expected employment
report (the next monthly employment report will be published on Friday 8th July)
or an upside breakout by the S&P500 Index.
We therefore view the
fundamental backdrop as currently being skewed in gold's favour, but in such a
way that it would take a relatively small change in the data to tip the balance
from bullish to bearish.
The COT
Not surprisingly considering the post-Brexit price surge, gold's Commitments of
Traders (COT) data became even more extreme during the latest week. As at 28th
June, the total speculative net-long position in COMEX gold futures was at a new
all-time high.
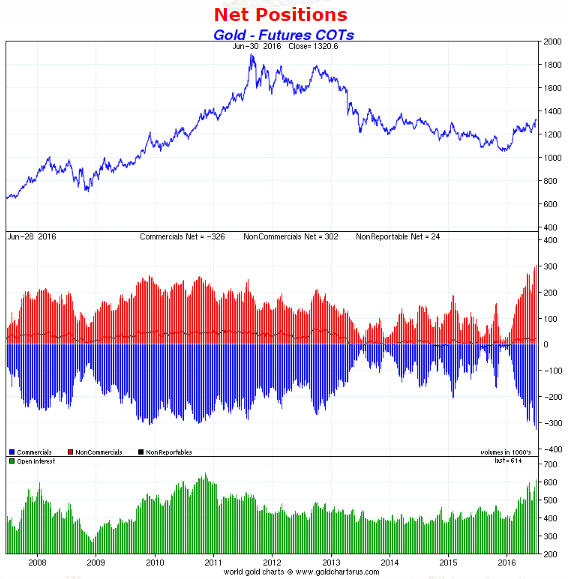
We had fully expected that the speculative net-long position would reach a
new all-time high within the first two years of a new gold bull market, but we
are stunned that it has happened only 7 months from the bear-market low and with
the gold price still about $600 below its 2011 peak.
The COT situation
will never be the reason for a trend reversal. Like other sentiment indicators
it just creates potential energy. The problem for gold will come when the trend
reverses downward for reasons that have nothing to do with the COT positioning
and the largest speculative net-long position in history has to quickly get
unwound.
The Price Action
The US$
gold price ended the week above the top of its 4.5-month channel. In momentum
terms it is only slightly 'overbought' and retains the potential for continuing
rally to around $1400.
Former resistance at $1308 should now be viewed as
critical support. A daily close below this support would be evidence that a
short-term top was in place while a weekly close below this support would be
evidence that an intermediate-term top was in place.

Silver
Silver is worth singling out again because it
broke above its 2015 high last Thursday and followed through to the upside on
Friday. It has therefore confirmed gold's earlier breakout.

With regard to our own money management, exposure to gold is mostly obtained via
gold-mining stocks while exposure to silver is mostly obtained via physical
silver. There are two reasons for this. The first is that the world of silver
mining stocks is small and contains few good choices, with the few good choices
tending to be over-valued relative to their gold-mining counterparts. The second
reason is that silver's price is sufficiently volatile that we feel no need to
own relatively-high-risk derivatives in order to obtain satisfactory reward
potential.
A consequence is that we trade our gold exposure far more
regularly than we trade our silver exposure. We steadily accumulate silver when
it is very cheap relative to gold and very 'oversold' in dollar terms. We then
do some selling when the opposite situation arises. This means that it is not
uncommon for a year to go by without us doing a single silver-related trade,
whereas we typically do more than 50 gold-related trades per year due to scaling
into and out of 15-20 gold-mining stocks.
The question we asked ourselves
after silver broke out to the upside last Thursday was: If the breakout prompts
a surge to at least $22 during the first half of July (a realistic possibility),
will it be appropriate to sell some silver bullion?
The reason we gave
some thought to making a partial exit is that almost regardless of what happens
to the silver price over the next few weeks there is a decent chance that it
will fall to $15 or lower during the subsequent correction. Therefore, if the
silver price moves into the low $20s the downside risk will be significant.
The answer we came up with was no.
Although silver's short-term
downside risk is high and getting higher by the day, it is too soon in what
could be a new multi-year trend to lose part of our position. Leveraged
speculators in silver futures are dangerously optimistic about short-term
prospects and unlike the gold market the silver market is short-term
'overbought' momentum-wise (note the daily RSI on the above chart), but on a
long-term basis the silver market is not yet close to being 'overbought' in
dollar terms and by historical standards the silver price is still low relative
to the gold price.
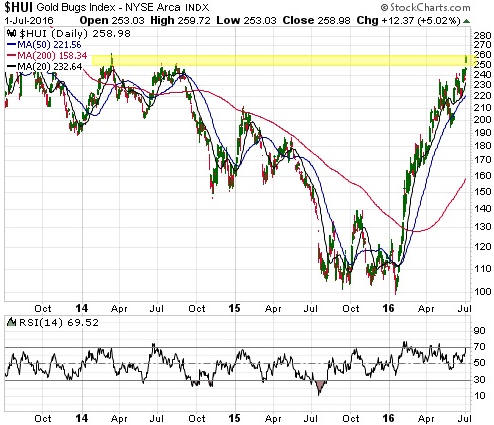
Gold Stocks
We weren't betting
on it, but over the past few weeks we've regularly noted that a surge by the HUI
to 250-260 was a realistic near-term possibility. The top of this price range
was reached last Friday and at the same time a bearish divergence between the
HUI and the HUI/gold ratio was eliminated. So, what's likely to happen now?
There could be a downward reversal as soon as this week, but the correct
answer is: we don't know. The HUI and most of the individual gold stocks we
follow have already reached or exceeded the upside targets we had in mind for
the whole of 2016.
If the gold-mining sector continues to make new highs
for the year beyond the first half of July then in terms of price action the
only historical parallel would be the bear-market rally of 1982-1983 (there is
no historical case of the first intermediate-term rally in a new gold-mining
bull market going further than this year's rally has already gone). We might
therefore do a chart comparison of the 1982-1983 rally and this year's rally in
one of the next two TSI commentaries.
The Currency Market
The Dollar Index
The US$ has a lot
going for it right now, such as the increasingly obvious economic, political and
banking-system problems in Europe, the blatant stupidity and recklessness of the
ECB, and, most importantly, the relative strength of the US stock market. Given
all of these positives it was strange and possibly significant that the Dollar
Index was unable to confirm the start of a new intermediate-term advance by
closing above its May high last week.
The Dollar Index has broken above
the top of its 7-month downward-sloping channel, but, as mentioned above and
illustrated below, has not yet managed to achieve a weekly close above its May
high. On the other hand, it also hasn't done anything to suggest that it's about
to move a lot lower.
Perhaps the market reaction to the US employment
report on Friday 8th July will provide more information regarding the dollar's
short- and intermediate-term prospects.
The Commodity Currencies
The A$ and the
C$, the main commodity currencies, entered correction mode in late April. The
corrections are probably not complete, although the currencies have had an
upward bias since late-May.
To signal the resumption of its correction,
the C$ will have to close below 76. A close below 76 would suggest a short-term
target of 72.
For
the A$, nearby support lies at 73.0-73.5. A daily close below 73 would point to
a test of the January low at around 69.
The
downturn in the commodity currencies is the main reason we are concerned about
short-term downside risk in the industrial metals and oil. More specifically,
the declines in the commodity currencies created a divergence that pointed to
significant short-term weakness in the commodity indices. However, if instead of
breaking below the afore-mentioned support levels the commodity currencies break
above their April highs, then the divergence will have been eliminated in a more
improbable way.
Updates
on Stock Selections
Notes: 1) To review the complete list of current TSI stock selections, logon at
http://www.speculative-investor.com/new/market_logon.asp
and then click on "Stock Selections" in the menu. When at the Stock
Selections page, click on a stock's symbol to bring-up an archive of
our comments on the stock in question. 2) The Small Stock Watch List is
located at http://www.speculative-investor.com/new/smallstockwatch.html
 Company
news/developments for the week ending Friday 1st July 2016:
Company
news/developments for the week ending Friday 1st July 2016:
*Asanko Gold (AKG), a former TSI stock selection, was the
victim last week of a very negative report (http://www.asankoreport.com/)
published by a hedge fund that is short the stock. The report contains a lot of
detail and concludes that AKG has downside potential of 90% due primarily to
having a massively overstated resource at the recently-commissioned first phase
of its Asanko gold mine in Ghana. We don't know the extent to which the negative
analysis is valid, although similar concerns about Asanko's resource were
expressed by Brent Cook late last year.
Peter Breese, AKG's CEO,
countered the negative report on his company in the most meaningful way -- by
purchasing $500K of shares on the market.
Our view is that AKG is now a
very expensive stock even if the current resource estimate is accurate.
*Endeavour Mining (EDV.TO) announced that it held a
ground-breaking ceremony at the Hounde project site in Burkina Faso. The
ceremony was attended by senior members of the Burkina Faso government,
including the president and the prime minister.
Hounde is on schedule to
begin production in the final quarter of 2017, which probably means that it will
reach commercial production during the first quarter of 2018. The project is
expected to deliver average annual gold production of 190K ounces at an AISC of
US$709/oz over its initial 10-year mine life and to deliver annual production of
235K ounces at a very low AISC of US$610/oz during its first four years of
operation.
*Evolution Mining (EVN.AX) announced
preliminary results for the June quarter and the 2016 Financial Year (FY), which
in Australia is the period from 1st July of one year to 30th June the next. The
announcement was made to enable the company to discuss its recent performance at
an "Investor Day".
EVN has achieved its production and cost guidance for
the latest quarter, enabling it to pay off an additional A$115M of debt. This
means that it has paid off more than A$300M of debt over the past 10 months and
is now in a stronger financial position, although it won't be until August that
we get the next look at its balance sheet.
Guidance for the 2017 FY is
for production of 800K-860K ounces at an AISC of A$985-A$1045/oz
(US$740-US$780/oz at an exchange rate of 0.75). Expenditure on exploration and
major capital investments is expected to add A$160-$200/oz to this figure.
We estimate that achieving the above-mentioned guidance would enable EVN to
generate free cash-flow of around US$300M assuming an average gold price of
US$1300/oz. If so, a share price north of A$3.00 would be justifiable within 12
months.
Most interestingly (because it wasn't expected), EVN announced
that it is doubling its dividend amount from 2% of revenue to 4% of revenue. The
dividend yield will still be small (it would be 3.5c-4.0c/share assuming 800K
ounces of production and an average gold price of A$1700/oz), but it's good that
management is demonstrating a willingness to pay more money to shareholders in
this way.
*Ramelius Resources (RMS.AX) reported
high-grade gold intercepts from drilling carried out within 3.6km of the
processing plant at the company's Mt Magnet operation in Western Australia,
including 2m of 32.2-g/t gold and 4m of 21.5-g/t gold. These good results
confirm the potential to extend the mine-life at Mt Magnet.
*Resolute
Mining (RSG.AX) announced the results of the FS for its 80%-owned Syama
Underground gold project in Mali. This is an expansion of the existing Syama
gold mine and is one of RSG's three current production-growth projects. We
briefly discussed the other two growth projects (the Ravenswood Extension in
Queensland and the Bibiani project in Ghana) last week.
Up until now,
Syama has been an open-pit operation with the bulk of the 200K-oz/yr production
coming from sulphide ore, but the open-pit mining of sulphide ore ended last
year. This year Syama's output has come from sulphide stockpiles and the
relatively small-scale mining of oxide ore, meaning that without the Underground
expansion the rate of production would soon be ramping down. With the
underground expansion the production rate should increase to 250K ounces/year
for at least the next 12 years (beginning in 2017). The post-expansion AISC is
estimated to be US$881/oz -- a per-ounce cost that would enable substantial
cash-flow generation as long as the gold price is at least US$1200/oz.
The expansion will cost about US$100M, which the company says will be funded
with current financial resources and future operating cash flows. In other
words, RSG is capable of completing the expansion without issuing new debt or
equity.
This is good news. Like many gold-mining stocks RSG has
experienced a massive upward re-rating in the stock market (it is up by 450%
since the beginning of the year) and is extremely 'overbought', but unlike many
other 200K+ oz/year gold producers its stock price is still at a level that
offers significant valuation-related upside at the current gold price.
*Timmins Gold (TGD) was a beneficiary on Friday 1st July of the
increasingly-indiscriminate buying of junior gold-mining stocks (the stock
priced gained 27% on the day), although in this case the buying makes sense.
There are two reasons. First, as a marginal and unhedged producer TGD benefits
immediately and substantially from gains in the gold price. Second, TGD still
offers reasonable value at the current gold price. In other words, TGD is a
stock that offers genuine leverage to gold that hasn't yet been bid up to an
unrealistic level.
However, in many cases the buying makes no sense. A good example is
International Tower Hill Mines (THM), an exploration-stage gold-mining stock
that gained 44% last week and is up by around 400% since the beginning of the
year. THM is reputed to be a highly-leveraged play on gold, but the reality is
that its leverage to gold is precisely zero. This is because the economic
studies completed to date reveal that its gold project will never be
economically viable. A gold project that has no chance of ever being developed
into a mine offers no genuine leverage to the gold price.
Base
Metal Stocks
As recently noted, we are becoming increasingly
bullish on copper in particular and base metals in general. The only current
exposure to these metals in the TSI List is via one stock (IVN.TO) and one ETF
(COPX), so we are on the lookout for new stock selections that fit the bill.
Ideally, the companies will have healthy balance sheets and current production
or projects at an advanced stage of exploration.
We have some preliminary
ideas, but we haven't settled on anything yet. In the meantime, both IVN and
COPX could be averaged into.
Special
Situations
In the 6th June Weekly Update we wrote that until the
gold market completed a significant correction or gold-related investments
became 'oversold', any new purchases of gold-mining equities for our own
accounts would probably be limited to 'special situations' -- very small stocks
that for company-specific reasons could generate large returns regardless of
what happens to the gold price.
We also wrote that the most interesting
'special situations' were tiny companies involved in joint ventures (JVs) with
much larger mining companies at very promising exploration-stage gold projects.
In such cases, continuing good results on the exploration front will often
prompt the larger company to buy its smaller partner.
We mentioned
Carlisle Gold, a stock that was written-up at TSI during June-August of last
year and was taken over at a huge premium (despite the lousy market at the time)
by its JV partner (Alamos Gold) in October, as a good example from recent
history. We also mentioned two current examples, both of which were added to the
TSI Small
Stocks Watch List. One was the Australia-listed Emmerson Resources (ERM.AX),
which is involved in a JV with Evolution Mining at a gold project in Australia's
Northern Territory, and the other was the Canada-listed Sarama Resources
(SWA.V), which is involved in a JV with Acacia Mining at a gold project in
Burkina Faso.
SWA was considered to be the riskier of the two, partly
because it had burned through its cash and was therefore in need of raising
additional money. This short-term risk has since been eliminated via an equity
financing.
SWA's stock price is about 50% higher now than it was when we
mentioned it 4 weeks ago, but the valuation is still very low relative to the
upside potential assuming no further increase in the gold price. Near its
current price in the low-C$0.20s it could therefore still be a reasonable --
albeit small-scale -- speculation for the risk-tolerant and patient (patience
may be required because even if the exploration work continues to yield positive
results it could be a year or two before the inevitable buyout comes).
ERM's stock price has only gained a few percent since we wrote it up in the 30th
May Weekly Update. Also, there has been reasonable liquidity near the current
price of A$0.05. The lack of price movement and the higher trading volume
suggests that someone with a substantial position is using the increasing demand
for gold-mining stocks to reduce exposure, which is a short-term negative but
makes it easier to build a position without having to 'pay up'.
For ease
of reference we have included a copy of our 30th May ERM write-up below.
There are a couple of other early-stage micro-cap gold-mining stocks in which we
have recently taken positions, but we won't mention them at this time because
although they have 'blue-sky' potential they currently don't have assets with
quantifiable value. Also, despite the lack of quantifiable value they have been
bid-up aggressively over the past couple of weeks.
30th May comments on
ERM.AX:
"A couple of years ago EVN entered an agreement with a tiny
company called Emmerson Resources (ERM.AX) regarding exploration of ERM's
100%-owned Tennant Creek project in Australia's Northern Territory. EVN is
funding A$15M of ERM's exploration to earn a 65% stake in the project and can
boost its stake to 75% by spending an additional A$10M on the project.
Some interesting drilling results (5m averaging 27-g/t gold and 13m averaging
8.7-g/t gold) were recently reported from the project's Edna Beryl mine. This
news is not going to move the dial on a company of EVN's size, but it occurs to
us that ERM could now be a worthwhile speculation.
ERM has consolidated
ownership of 95% of the Tennant Creek Mineral Field (TCMF), a district with
historical production of 5.5M ounces of gold and 470K tonnes of copper. It also
owns the only gold mill in the region and an extensive geological database.
ERM's management believes that there is a lot of undiscovered high-grade
gold in potentially economic deposits within the TCMF. Importantly, EVN's
management obviously agrees.
At this stage we don't know much about ERM
and its exploration-stage assets. We certainly don't know enough to quantify the
company's value. However, with 378M shares outstanding and a share price of only
A$0.05, the current market cap is only A$19M and the current enterprise value is
only about A$14M (ERM has A$5M of cash). This means that ERM is being valued by
the stock market at less than the amount that EVN has committed to spend on its
project, which suggests to us that the market is assigning almost no probability
of success. Given the drill results achieved to date and the history of the area
being explored, this doesn't seem reasonable to us.
ERM is far too
speculative and illiquid to be considered for the TSI Stocks List, but we have
added it to the TSI Small Stocks Watch List. Mainly, we wanted to bring the
company to our readers' attention. Anyone who is interested can investigate
further.
We suspect that if the EVN-funded exploration program continues
to yield positive results then EVN will buy ERM."
Chart Sources
Charts appearing in today's commentary
are courtesy of:
http://stockcharts.com/index.html
http://www.barchart.com/
http://bigcharts.marketwatch.com/
http://www.sharelynx.com/
http://www.investing.com/
