|
-- Weekly Market Update for the Week Commencing
4th August 2014
Big Picture
View
Here is a summary of our big picture
view of the markets. Note that our short-term views may differ from our
big picture view.
In nominal dollar terms, the BULL market in US Treasury Bonds
that began in the early 1980s ended in 2012. In real (gold)
terms, bonds commenced a secular BEAR market in 2001 that will continue
until 2018-2020. (Last
update: 20 January 2014)
The stock market, as represented by the S&P500 Index,
commenced
a secular BEAR market during the first quarter of 2000, where "secular
bear market" is defined as a long-term downward trend in valuations
(P/E ratios, etc.) and gold-denominated prices. This secular trend will bottom sometime between 2014 and 2020.
(Last update: 22 October 2007)
A secular BEAR market in the Dollar
began during the final quarter of 2000 and ended in July of 2008. This
secular bear market will be followed by a multi-year period of range
trading.
(Last
update: 09 February 2009)
Gold commenced a
secular bull market relative to all fiat currencies, the CRB Index,
bonds and most stock market indices during 1999-2001.
This secular trend will peak sometime between 2014 and 2020.
(Last update: 22 October 2007)
Commodities,
as represented by the Continuous Commodity Index (CCI), commenced a
secular BULL market in 2001 in nominal dollar terms. The first major
upward leg in this bull market ended during the first half of 2008, but
a long-term peak won't occur until 2014-2020. In real (gold) terms,
commodities commenced a secular BEAR market in 2001 that will continue
until 2014-2020.
(Last
update: 09 February 2009)
Copyright
Reminder
The commentaries that appear at TSI
may not be distributed, in full or in part, without our written permission.
In particular, please note that the posting of extracts from TSI commentaries
at other web sites or providing links to TSI commentaries at other web
sites (for example, at discussion boards) without our written permission
is prohibited.
We reserve the right to immediately
terminate the subscription of any TSI subscriber who distributes the TSI
commentaries without our written permission.
Outlook Summary
Market
|
Short-Term
(1-3 month)
|
Intermediate-Term
(6-12 month)
|
Long-Term
(2-5 Year)
|
|
Gold
|
Bullish
(10-Jun-14) |
Bullish
(26-Mar-12) |
Bullish
|
|
US$ (Dollar Index)
|
Neutral
(10-Jul-14) |
Neutral
(10-Jul-14) |
Neutral
(19-Sep-07) |
|
Bonds (US T-Bond)
|
Bullish
(11-Dec-13)
|
Neutral
(18-Jan-12)
|
Bearish |
|
Stock Market
(DJW)
|
Bearish
(07-Apr-14) |
Bearish
(28-Nov-11) |
Bearish
|
|
Gold Stocks
(HUI)
|
Bullish
(10-Jun-14) |
Bullish
(23-Jun-10) |
Bullish
|
|
Oil |
Neutral
(02-Jun-14) |
Neutral
(31-Jan-11) |
Bullish
|
|
Industrial Metals
(GYX)
|
Neutral
(17-Feb-14) |
Bullish
(28-Apr-14) |
Bullish
(28-Apr-14) |
Notes:
1. The date shown below the current outlook is when the most recent outlook change occurred.
2. "Neutral", in the above table, means that we either don't have a
firm opinion or that we think risk and reward are roughly in balance with respect to the timeframe in question.
3. Long-term views are determined almost completely by fundamentals,
intermediate-term views by
fundamentals, sentiment and technicals, and short-term views by sentiment and
technicals.
Argentina's Default
Much has been written about Argentina's debt default. Before
briefly providing our thoughts on this issue and the current
situation in Argentina, it's important to understand that Argentina
hasn't defaulted; its government has. There are millions of
individuals and thousands of companies in Argentina with solid
balance sheets. None of them have defaulted.
The latest default by Argentina's government, which officially
occurred last week, has prompted a lot of biased commentary. Many
commentators have attempted to portray the Argentine government's
direct default on its debt as an economic disaster, while other
commentators have suggested that the US judge who brought matters to
a head by ruling against Argentina's government was incompetent or
unfair and that the hedge-fund bondholders (the so-called "vulture
funds") that were demanding full payment on their bonds were
behaving unreasonably. The first group is wrong because a direct
debt default by a government can never be the cause of a major
economic problem. Economic problems are caused by increased
government spending/intervention and indirect default via inflation,
whereas direct government debt default will tend to be more of an
economic positive than an economic negative. The second group is
wrong because the judge's decision was legally correct (refer to the
article at http://mises.org/daily/6825/Understanding-Argentinas-Coming-Default
to understand why) and because the so-called "vulture funds" are
simply demanding that Argentina's government do what it
contractually agreed to do when it originally issued the debt.
We suspect that some sort of deal will soon be done that takes the
Argentine government out of official default, but just as going into
official default did not constitute a major economic negative,
coming out would not constitute a major economic positive.
Regardless of what happens with the default status of the
government's debt, Argentina has a serious economic problem in the
form of rampant monetary inflation and its inevitable consequences
("price inflation" and mal-investment). However and as is not
uncommon in such cases, the inflation problem in Argentina is not
creating a bearish trend in the stock market. At least, it is not
yet doing so, although in US$ terms it is bound to do so in the
future.
As an aside, it's the real return of an investment that matters, so
it is important to measure investment performance in terms of a
relatively stable currency. For example, an equity portfolio
denominated in Argentine pesos would need to have risen by about 25%
per year over the past few years just to generate a break-even
result in real terms.
One of the likely reasons that Argentina's inflation problem is not
yet creating a bearish stock-market trend is that it was discounted
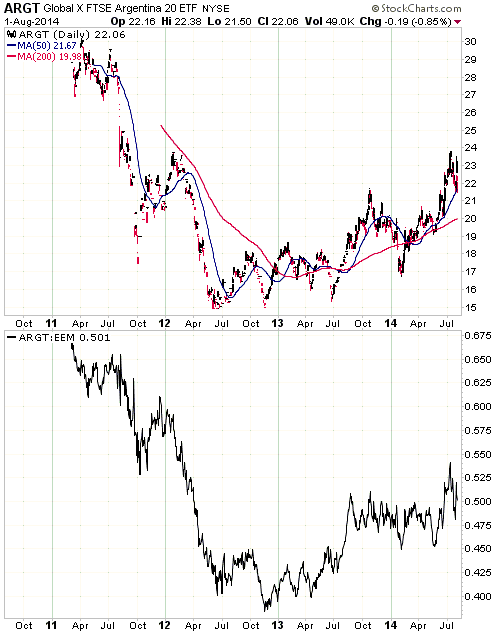
by the market more than 12 months ago. As evidenced by the following
chart, the Global X FTSE Argentina 20 ETF (ARGT), a US$-denominated
proxy for Argentina's most important equities, lost 50% of its value
during 2011-2012 and was also very weak relative to other "emerging
market" equities (the bottom half of the chart shows the relative
performance). Since its 2012 bottom ARGT has gained about 50%, which
means that it has recouped about half of its 2011-2012 loss. It has
also strengthened relative to the iShares Emerging Markets ETF (EEM).
Argentina's inflation problem constitutes a big risk for investors,
but we aren't totally averse to investing money in Argentina. There
will be risk wherever you invest. It's a matter of whether or not
the valuation is low enough and the reward potential high enough to
justify taking the risk.
US Economic Numbers Update
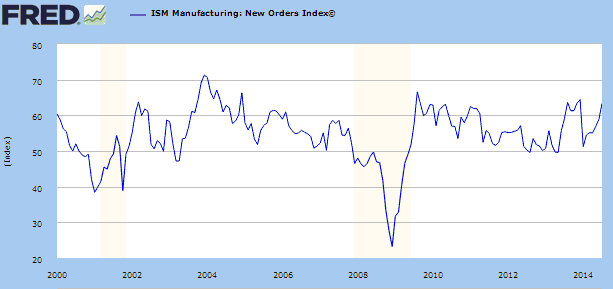
The ISM Manufacturing numbers for July were
reported last Friday, and they were strong. Of particular significance, the
following chart shows that the ISM New Orders Index, in our opinion the single
best indicator of the US economy's current and likely near-term performance, has
risen to near its highs of the past few years.
The latest monthly employment numbers were also reported last Friday. They were
apparently a little weaker than expected, but not by enough to affect the Fed's
actions.
As explained in previous commentaries, the only practical significance of the
employment numbers is the extent to which they influence the Fed. As indicators
of current or future economic performance they are useless because they are
inaccurate and backward-looking. In effect, the employment numbers provide an
inaccurate look at how the economy was performing a few months ago and provide
no information about likely future economic performance.
From a big picture perspective, the best LEADING indicator of US economic
performance we know of is Real Gross Private Domestic Investment. This is the
blue line on the following chart. If you look closely at this chart you should
be able to see that Real Gross Private Domestic Investment has reversed downward
at least a few months prior to the start of every official US recession since
1970. The same chart shows that employment (the red line) never reverses
downward until sometime after an official recession has begun.
Unfortunately, the Real Gross Private Domestic Investment number is only updated
quarterly with a lag of one month, which means that it can be up to four months
out of date. Furthermore, a trend change in this number will take at least two
quarters to unfold. That's why we generally discuss it at TSI only a couple of
times per year.
The Real Gross Private Domestic Investment number for Q1-2014 opened up the
possibility that a downward trend reversal had occurred, but the number for
Q2-2014, which was reported last week, eliminated this possibility.
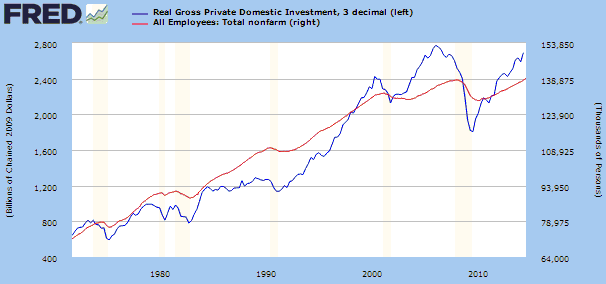
The combination of the ISM New Orders Index and the Real Gross Private Domestic
Investment number tells us that the start of the next official US recession lies
at least 6 months into the future.The Stock
Market
The US
There was a sharp decline in the US stock market on Thursday 17th July, but the
decline was a knee-jerk reaction to news (the shooting-down of MH-17) and was
reversed the next day.
There was another sharp decline in the US stock market on Thursday 31st July,
but in this case the decline was not a reaction to any particular news event and
was not reversed the next day. Furthermore, the decline was PRECEDED by an
upside breakout in the Volatility Index (VIX). This means that we have probably
just witnessed the beginning of a downward move that will have significant price
extension.
By some measures the S&P500 Index (SPX) is already a little 'oversold' on a
short-term basis, but not by enough to suggest that anything more than a 1-2 day
rebound is likely. If there is a rebound over the days immediately ahead it will
probably go no further than the 1950s. That, we think, is the current near-term
upside potential.
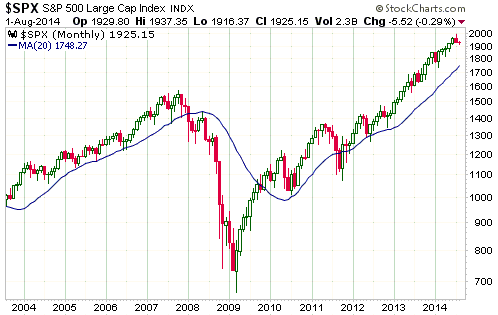
We think that the near-term (1-4 week) downside potential is defined by the
20-month MA. The reason is illustrated by the following monthly chart, which
shows that with one exception every short-term correction in the SPX during
2004-2007 and 2009-2014 ended near this moving average. The fact that there
hasn't been a normal short-term correction since 2012 simply means that one is
overdue.
On a longer-term basis we perceive three plausible scenarios, as follows:
Scenario 1: The SPX is rolling over into a cyclical decline that will last 1-2
years. In this case, an initial decline would bottom in August or September,
after which there would likely be a rally to test the July high during
October-November prior to the start of a major downward trend.
Scenario 2: The SPX is setting up for a crash. In this case, an initial decline
would bottom during the first half of August, after which there would be a
choppy multi-week rebound and then a crash during the second half of September
or the first half of October.
Scenario 3: The SPX is experiencing a normal bull-market correction, with a
bottom likely by early October.
Regardless of which of these scenarios is playing out, the 20-month MA should be
reached within the next two months.
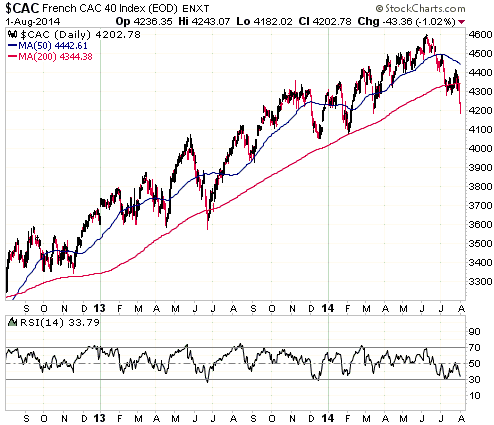
Europe
Over the past two months, European equities have generally been much weaker than
US equities. The weakness in European equities is exemplified by the following
daily charts.
The first chart shows that France's CAC40 Index tested its 200-day MA in early
July, rebounded for a couple of weeks and then broke well below this
intermediate-term moving average. This means that the CAC40 is immersed in its
most significant decline in more than two years.
The second chart shows that Germany's DAX Index
decisively breached its 200-day MA last week after steadfastly remaining above
it for more than two years.
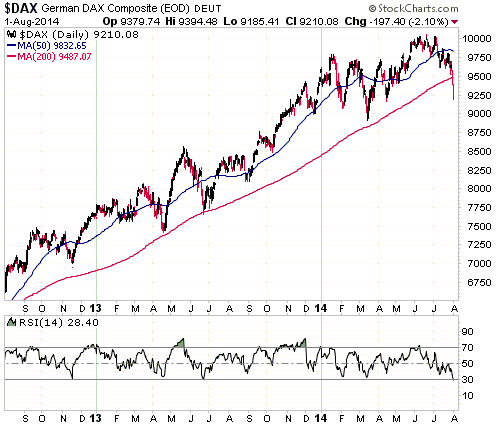
The CAC and the DAX are now short-term 'oversold', but there is no good reason
to believe that correction lows are in place.
This week's
important US economic events
| Date |
Description |
| Monday Aug 04 |
No important events scheduled | | Tuesday
Aug 05 |
Factory Orders
ISM Non-Mfg Index | | Wednesday
Aug 06 |
Trade Balance | | Thursday
Aug 07 |
Consumer Credit
|
| Friday Aug 08 |
Q2 Labour Productivity and Costs |
Gold and
the Dollar
Gold
Gold and the Fed
As far as gold's price trend is concerned, the Fed has essentially been out of
the picture for the past 6 months and will likely remain so for at least a few
more months. This is because the gold market was not a beneficiary of the
QE3-QE4 programs and was therefore not in a position to be hurt by the winding
down ("tapering") of these programs, and also because there is little doubt that
the "tapering" will continue to its planned end over the months immediately
ahead. For direct actions by the Fed to come back into play, one of two things
will have to happen.
The Fed would be brought back into play by sufficient weakness in the US stock
market or economy to firstly postpone the expected starting date of a
rate-hiking campaign and to secondly prompt Fed representatives to start
discussing a new round of monetary stimulus. This would be very bullish for gold
because it would be confirmation that the Fed was prepared to do a lot more of
what would, by then, be widely recognised to have failed in the past. Unlike
2012-2013, there would be no illusions of the "QE" achieving anything other than
higher prices.
Alternatively, for the Fed's direct actions and anticipation of what the Fed was
about to do to again become important influences on gold-market sentiment, the
stock market and the economy would have to hold together for long enough to make
an official rate hike a likely short-term prospect. If the US stock market
doesn't crash or enter a bear market within the next three months then this
would probably happen by March of next year, perhaps creating an
intermediate-term price peak in the gold market at around that time.
Current Market Situation
Gold was unable to end last week above its 65-week MA, but it did manage to end
the week above its 50-day, 150-day and 200-day moving averages. Furthermore, the
50-day MA is above the 150-day MA and the 150-day MA is above the 200-day MA,
which suggests that the decline from the early-July peak is a routine short-term
correction.
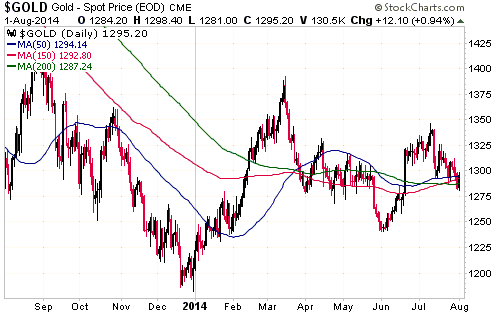
The top-bottom symmetry discussed in previous TSI commentaries suggested that
early August was the most likely time for a consistent upward trend to begin in
the gold market. Also, the resilience being shown by the gold market, with
spikes down to the $1280s being quickly reversed, points to the next move of
significance being to the upside and getting underway soon.
There could be another downward spike during the first half of this week, but
our guess is that the next meaningful gold rally will begin within the next five
trading days. A daily close above $1312 would now be clear evidence that a rally
was underway.
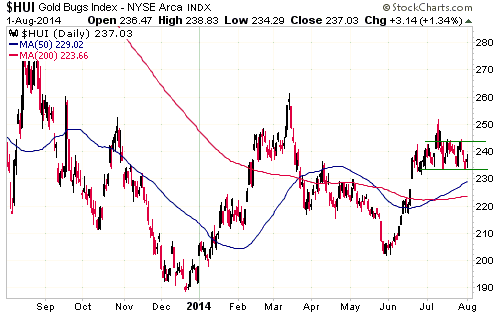
Gold Stocks
Last week's price action contained minimal new information. A correction-ending
spike down to around 225 remains a realistic possibility.
The inability, to date, of bearish traders and capitulating bullish traders to
push the HUI below the bottom of its narrow 3-week trading range tells us that
value-oriented investors are keen to buy the dips in the gold-mining sector.
This, in turn, suggests to us that the time for a final correction-ending
downward spike has almost run out. We think that if such a spike is going to
happen it will have to do so within the first half of this week.
Price-related confirmation that the HUI's correction is over could take the form
of either a daily close above 245 or a decline to the 220s followed by a daily
close above 235.
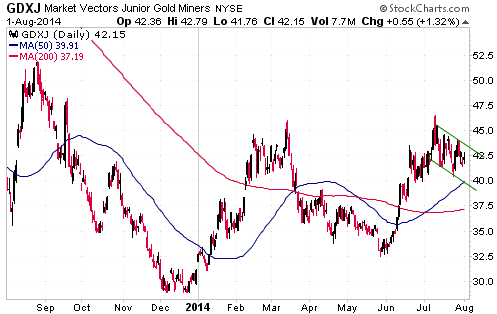
As is the case with the HUI, GDXJ is struggling to get down to moving-average
support. A correction-ending spike down to around $39 remains a realistic
possibility, but the time for such an event is running out.
The Currency Market
Relative popularity as an international medium of exchange
A lot of nonsense has been written over the past several years, and continues to
be written, about a general shift away from the US$ towards alternatives such as
the euro and the Yuan. For record purposes, here are some facts:
1) Shares of global trade settlement, according to SWIFT (Society for Worldwide
Interbank Financial Telecommunication):
- In June-2014 the US dollar's share was 40.2%, which is UP
from 29.7% in January-2012
- In June-2014 the euro's share was 31.3%, which is DOWN from
44% in January-2012
- In June-2014 the Yuan's share was 1.5%, which is UP from
0.3% in January-2012
2) Shares of global FX turnover, according to the BIS:
- In 2013 the US dollar's share was 87.1%, which is UP from
84.9% in 2010
- In 2013 the euro's share was 33%, which is DOWN from 39% in
2010
- In 2013 the Yuan's share was 2.2%, which is UP from 0.9% in
2010
So, the US$ has gained in popularity over the past few years as an international
medium of exchange for use in both trade and investing. The Yuan has also gained
in popularity, but none of its gain has come at the expense of the US$ and its
share of global trade and capital flows remains trivial. The euro has been the
big loser.
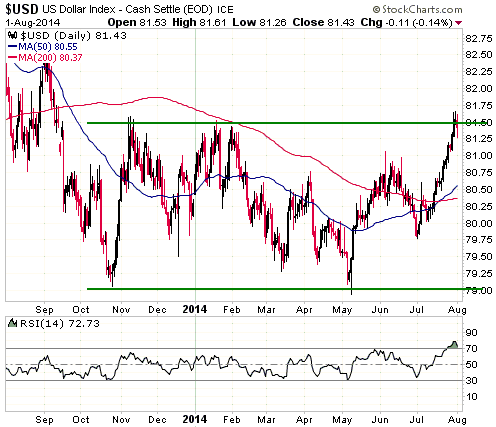
Current Market Situation
The Dollar Index traded above intermediate-term resistance at 81.5 last Thursday
and Friday, but couldn't sustain the breakout. However, although it is clearly
'overbought' and is probably close to a short-term peak in terms of both price
and time, the price action late last week did not signal a short-term reversal.
We therefore won't be surprised if the Dollar Index makes a small amount of
additional headway before putting in place a peak that holds for at least a few
weeks.
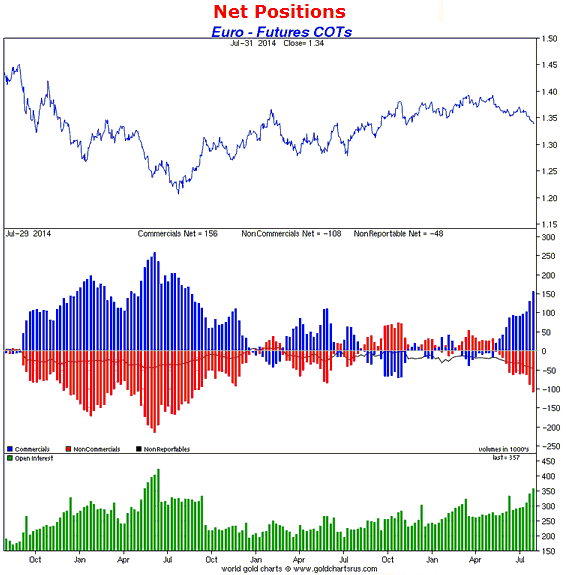
On a short-term basis, the most important factor in favour of the Dollar Index
being close to a peak that holds for a few weeks (and potentially much longer)
is that currency speculators have ALREADY positioned themselves in a big way for
further weakness in the euro. To be specific, the following chart from
Sharelynx.com shows that the Commercial
net-long position (the same as the total Speculative net-short position) in euro
futures is now at its highest level since mid-2012. Recall that in mid-2012
there was widespread fear of a euro collapse, prompting Draghi to make his
famous "whatever it takes" promise. This reduces the potential for substantial
additional speculative euro-selling and opens up the potential for a significant
short-covering-fueled rebound.
Looking at the bigger picture, last week's failure by the Dollar Index to end
the week above 81.5 keeps alive the scenario involving a final decline to the
low-70s to complete the dollar's long-term bottoming pattern. However, this
scenario is no longer a clear favourite. In our opinion, it is now an even-money
bet as to whether the Dollar Index's long-term bottoming pattern is complete, in
which case the next 5-10 point move will be to the upside, or a final decline to
the low-70s remains in store. That's why our intermediate-term US$ outlook is
"neutral".
Updates
on Stock Selections
Notes: 1) To review the complete list of current TSI stock selections, logon at
http://www.speculative-investor.com/new/market_logon.asp
and then click on "Stock Selections" in the menu. When at the Stock
Selections page, click on a stock's symbol to bring-up an archive of
our comments on the stock in question. 2) The Small Stock Watch List is
located at http://www.speculative-investor.com/new/smallstockwatch.html
 Company
news/developments for the week ended Friday 1st August 2014: Company
news/developments for the week ended Friday 1st August 2014:
[Note: AISC = All-In Sustaining Cost, FS = Feasibility Study, IRR = Internal
Rate of Return, MD&A = Management Discussion and Analysis, M&I = Measured and
Indicated, NAV = Net Asset Value, NPV(X%) = Net Present Value using a discount
rate of X%, P&P = Proven and Probable, PEA = Preliminary Economic Assessment,
PFS = Pre-Feasibility Study]
*Asanko Gold (AKG) advised that metallurgical testing of ore from
the newly discovered Dynamite Hill deposit confirmed that the material will
blend well with the ore from the other four Phase 1 Project pits and that the
standard gravity and Carbon-in-Leach processing facility designed for Phase 1 is
appropriate for treating material from Dynamite Hill. This is good news, but not
at all surprising.
An initial resource estimate for Dynamite Hill is expected to be published in
September.
*Dragon Mining (DRA.AX) issued its Quarterly Report for the
3-month period ended 30th June.
Gold production at the company's operations in Finland and Sweden amounted to
13.6K ounces at a cash cost of US$1076/oz. This was about 1.5K ounces below
plan, but DRA still managed to make a small addition to its cash reserve during
the June quarter.
Importantly, DRA has about $12M of working capital, which means that it is not
in short-term danger of going out of business. If we are right about the gold
market, DRA should be able to survive until a higher gold price creates the
opportunity for consistent profitability.
*Evolution Mining (EVN.AX) issued its Quarterly Report for the
3-month period ended 30th June.
Gold production during the quarter was 111.9K ounces at an AISC of A$1057/oz.
This was a good result. Annual production for the 12-month period ended 30th
June was about 428K ounces, which was in line with guidance.
EVN's balance sheet has almost certainly strengthened over the past 6 months,
but we won't know the details until the complete financial statements are
published in late August.
For the coming financial year (the 12-month period ending 30th June 2015), EVN's
gold production is expected to be around 420K ounces at an AISC of around
A$1100/oz. If this forecast is achieved then EVN will be profitable and
cash-flow positive as long as the gold price averages at least US$1200/oz. We
are expecting the gold price to average more than $1400/oz over the coming 12
months, making EVN strongly cash-flow positive over this period.
As is the case with the entire gold-mining sector, it is taking longer than
expected for EVN to complete its basing pattern. However, the improvement in the
company's operational performance leaves little room for doubt that a break
above the top of the base (A$1.00) will occur shortly after it becomes clear
that gold has resumed its intermediate-term upward trend.
A break above the top of the base would create a short-term chart-based target
of A$1.50.
*Three weeks ago, Golden Star Resources (GSS) advised that it
produced 61.7K ounces of gold during the June quarter. We noted that this was
well below plan and almost guaranteed that the current 2014 production guidance
of 300K ounces would not be achieved. Our guess was that GSS would have to
reduce its 2014 guidance to around 270K ounces. We also noted that the June
quarter's sub-par production would result in a further weakening of the
company's balance sheet, leaving it with no margin of safety and therefore
making it a high-risk proposition.
Last week, GSS issued its financial reports for the June quarter. As expected,
the company has reduced its 2014 production guidance from 300K ounces to 270K
ounces. This implies a 71K-oz/quarter run rate during the second half of this
year, versus the 63K-oz/quarter run rate achieved during the first half. Also as
expected, the balance sheet reveals that the company has no margin of safety.
Interestingly, the stock market took GSS's disappointing financial results in
stride.
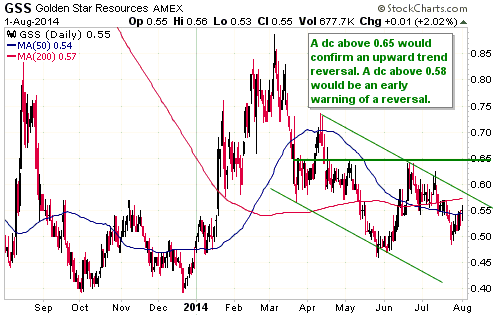
On a more positive note, along with its quarterly financial reports GSS issued
some excellent results from continued drilling of the underground gold deposit
located beneath its Wassa open pit mine in Ghana. Specifically, step-out
drilling yielded gold intercepts of 60.2m grading 3.4 g/t and 70.5m grading 5.9
g/t, and infill drilling yielded gold intercepts of 45.4m grading 8.3 g/t, 15.8m
grading 32.9 g/t and 51.3m grading 7.2 g/t. An updated resource estimate and PEA
for the Wassa underground project will be published before the end of this
quarter.
*Ramelius Resources (RMS.AX) issued its Quarterly Report for the
3-month period ended 30th June.
Gold production during the quarter was 25.4K ounces at a cash cost of A$1013/oz,
including 19.2K ounces at a cash cost of A$1170/oz from the company's flagship
Mt Magnet mine. This represents a big improvement over the cash cost of
A$1428/oz achieved by Mt Magnet during the preceding quarter. Be aware, though,
that the total cost of producing gold is typically 20%-30% higher than the
so-called "cash cost".
Although RMS's operations have improved, they haven't improved enough to make
the company cash-flow positive and profitable at the current gold price. We
think that RMS will need a gold price of more than US$1400/oz to become
profitable. In the meantime, the company has enough cash to ensure its survival.
RMS is in the process of raising about $8.5M via a placement and a rights issue
at A$0.065/share. As previously advised, for TSI record purposes we will assume
that the rights are exercised, with new shares purchased on a 1-4 basis at
A$0.065/share. Each two new shares come with a free 12-month option to purchase
another new share at a price of A$0.12.
In our opinion, RMS has a very attractive risk/reward near its current price of
A$0.066. The risk is 100% (the risk is that the company eventually goes bust and
the shares become worthless), but the upside potential over the coming two years
is at least 1,000%. To get that level of upside, we probably just need a 25%
increase in the gold price and the company to achieve its current forecasts.
*Sabina Gold and Silver (SBB.TO) reported some positive results
from infill and step-out drilling conducted over the past few months at the Echo
Zone at its Back River gold project (Nunavut, Canada). The significance level of
this news is low, although the recently-completed drilling will enable an
updated Echo resource to be estimated later this year and included in the
overall project FS due to be completed in the first half of 2015. This new
resource estimate will enable SBB to determine the benefits that the Echo zone
could provide to the early life of the planned gold mine.
*UEX Corp. (UEX.TO), a uranium explorer with two projects in
Athabasca, issued its MD&A and financial statements for the June quarter. The
financial statements reveal that UEX has about $7M of working capital, which is
about $1M less than it had at the end of the preceding quarter. This should be
enough to fund the company for another 12 months.
List of candidates for new buying
From within the ranks of TSI stock selections, the best candidates
for new buying at this time are:
1) AAU (last Friday's closing price: US$1.40).
2) EDV.TO (last Friday's closing price: C$0.88).
3) EVN.AX (last Friday's closing price: A$0.78).
4) PVG around US$6.50 (last Friday's closing price: US$6.87).
5) TGM.V (last Friday's closing price: C$0.44).
Chart Sources
Charts appearing in today's commentary
are courtesy of:
http://stockcharts.com/index.html
http://research.stlouisfed.org/

|
