![]()
![]()
![]()
![]()
-- Weekly Market Update for the Week Commencing 4th September 2017
Big Picture
View
Here is a summary of our big picture
view of the markets. Note that our short-term views may differ from our
big picture view.
The BULL market in US Treasury Bonds that began in the early 1980s ended in early-2015, but there will be many years of topping action in bond prices and bottoming action in bond yields before major new trends get underway. (Last update: 29 June 2015)
The stock market, as represented by the S&P500 Index, commenced a secular BEAR market during the first quarter of 2000, where "secular bear market" is defined as a long-term downward trend in valuations (P/E ratios, etc.) and gold-denominated prices. This secular trend will bottom sometime between 2018 and 2020. (Last update: 29 June 2015)
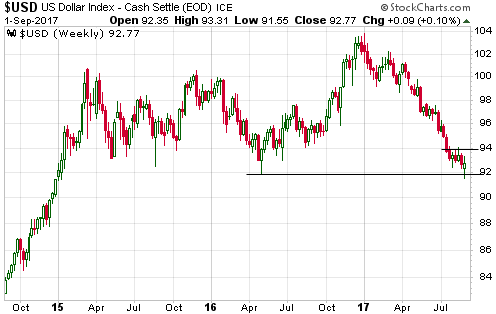
A secular BEAR market in the US Dollar began during the final quarter of 2000 and ended in July of 2008. This secular bear market will be followed by a multi-year period of range trading. (Last update: 09 February 2009)
Gold commenced a secular bull market relative to all fiat currencies, the CRB Index, bonds and most stock market indices during 1999-2001. This secular trend will peak sometime between 2018 and 2020. (Last update: 29 June 2015)
Commodities,
as represented by the CRB Index, commenced a
secular BULL market in 2001 in nominal dollar terms. The first major
upward leg in this bull market ended during the first half of 2008, but
a long-term peak won't occur until 2018-2020.
(Last
update: 29 June 2015)
Copyright
Reminder
The commentaries that appear at TSI
may not be distributed, in full or in part, without our written permission.
In particular, please note that the posting of extracts from TSI commentaries
at other web sites or providing links to TSI commentaries at other web
sites (for example, at discussion boards) without our written permission
is prohibited.
We reserve the right to immediately
terminate the subscription of any TSI subscriber who distributes the TSI
commentaries without our written permission.
Outlook Summary
|
Market |
Short-Term (1-3 month) |
Intermediate-Term (6-18 month) |
Long-Term (2-5 Year) |
| Gold | N/A |
Neutral (21-Nov-16) |
Bullish |
| US$ (Dollar Index) | N/A |
Bullish (27-Feb-17) |
Neutral |
| US Treasury Bonds (TLT) | N/A |
Bearish (10-Jul-17) |
Bearish |
| Stock Market (DJW) | N/A |
Bearish (15-Feb-17) |
Bearish |
| Gold Stocks (HUI) | N/A |
Neutral (21-Nov-16) |
Bullish |
| Oil | N/A |
Neutral (10-Jul-17) |
Bullish |
| Industrial Metals (GYX) | N/A |
Neutral (29-May-17) |
Bullish |
4. Long-term views are determined almost completely by fundamentals and intermediate-term views
are determined by a combination of fundamentals, sentiment and technicals.
Last week's posts at the TSI Blog
Interest Rates and Gremlins
The most useful leading indicator of the global boom-bust cycle
Summary of current
thinking/positioning
1) Thinking that gold, silver
and the associated mining indices will trend upward to October highs.
2) Suspecting that the US stock market is in the early part of a
10%-20% decline that will end in September or October, but acknowledging
that if this is the case then downward acceleration must begin this week.
Participating in this trade via VIX call options and various put options.
3) Liking the idea of adding 'long' exposure to industrial-commodity
stocks and simultaneously speculating on a general stock-market decline.
One hedges the other.
4) Thinking that the euro and the commodity
currencies will trend downward for the next 1-3 months. Expecting the Yen
to trend upward over the same period.
5) Thinking that the T-Bond
will soon commence a tradable multi-month decline if it hasn't done so
already.
6) Maintaining a large cash reserve to hedge downside risk
in equities (current cash percentage is about 35%).
US Recession
Watch
We pay close attention to three
leading indicators of US recession: Real Gross Private Domestic Investment
(RGPDI), the US yield curve and the ISM Manufacturing New Orders Index
(NOI). The latest iteration of the last of these indicators was reported
on Friday 1st September.
The ISM NOI for August came in at 60.3. It
therefore remains near the top of its 10-year range and well above the
level it would have to breach (the red line on the following chart) to
warn of a recession.
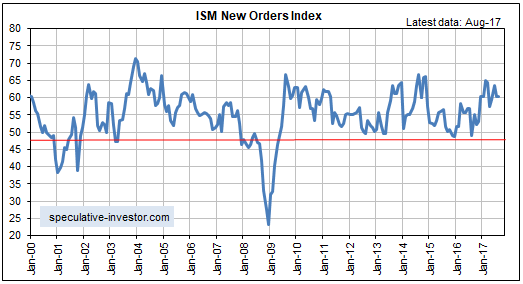
This means that none of the leading indicators we care about is
warning of recession at this time. Based on the speed at which shifts can
occur it is technically possible that a recession could begin as soon as
December of this year, but it's far more likely that there will be no
recession until 2018 (or later).
By the way, we recently discovered
the web site
https://www.recessionprotect.com/. This site contains some economic
and stock-market models, one of which is the Recession Probability Model
depicted below (the Recession Probability Model is behind a pay-wall, but
some of the other models/indicators are available for free).
According to this model, the current recession probability is 46%. While
this is high enough to suggest caution, previous recessions did not begin
until the probability reached 70%.
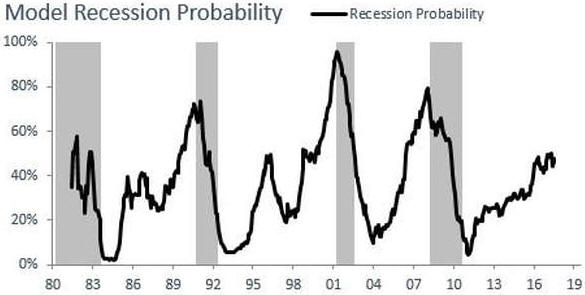
Given the current trend in monetary conditions there's a high risk of
a recession getting underway during the first half of 2018. However, we
will continue to take the evidence as it comes.
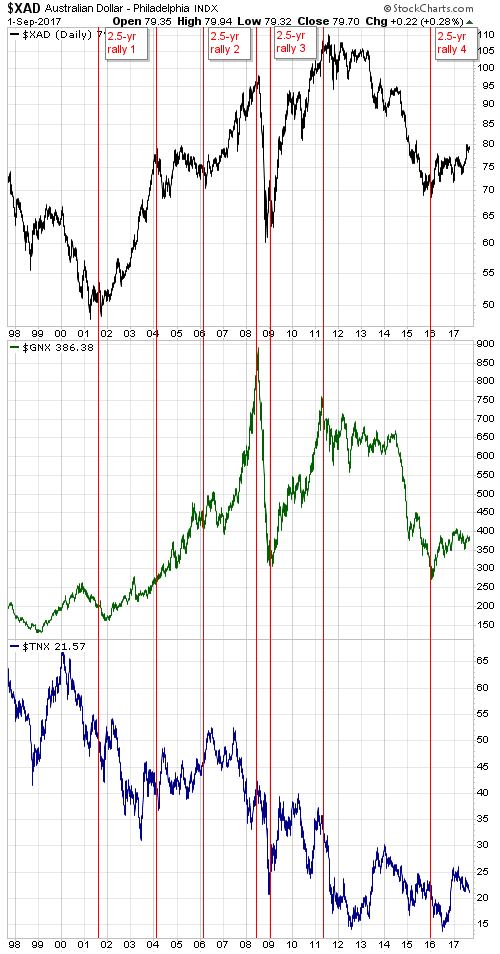
Commodities
Commodities and the
Commodity Currencies
The Australian Dollar (A$) and the
Canadian Dollar (C$) are called "commodity currencies" for a reason. The
reason is that regardless of what's happening in their associated local
economies, on a multi-year basis they will usually trend in the same
direction as broad-based commodity indices.
Since 2001 there have
been three major rallies in the A$, each lasting about 2.5 years. These
2.5-year rallies are indicated by vertical red lines and notes on the
following chart. Our assumption, which is also indicated on the following
chart, is that the fourth 2.5-year A$ rally began in early-2016. In other
words, we are guessing that the A$ upward trend that began in early-2016
will continue until around mid-2018. As well as being based on the lengths
of previous major upward trends, this guess is based on what we expect
from commodity prices.
Speaking of commodity prices, in addition to
the A$ the chart shows the GSCI Spot Commodity Index (GNX).
Unsurprisingly, each of the 2.5-year A$ rallies indicated on the chart
coincided with an upward-trending GNX. In terms of price direction, the
main difference between the post-2001 performance of the A$ and the
post-2001 performance of GNX is that GNX trended upward from the beginning
of 2002 until its blow-off top in mid-2008 whereas the A$ experienced a
flat 2-year correction during 2004-2005.
Mainly for interest's sake
(pun intended), the chart also shows the yield on the 10-year T-Note. The
10-year interest rate had a downward bias during two of the A$'s 2.5-year
rallies and an upward bias during the third rally. We expect that it will
have an upward bias over the course of the current (fourth) rally.
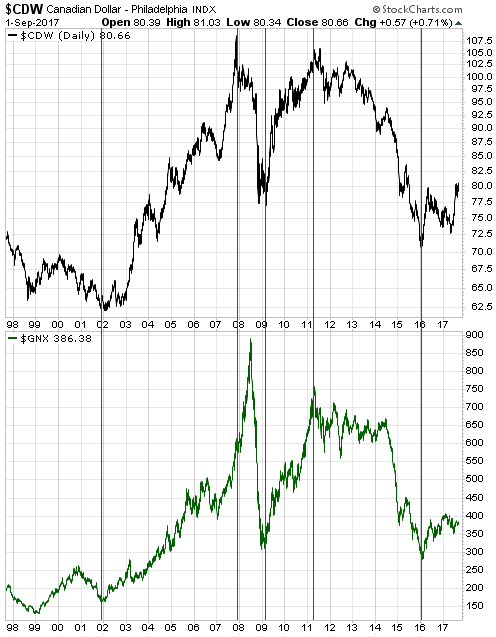
The next chart shows the relationship between the C$ and commodity
prices as represented by GNX. If anything, with one notable 6-month
exception the positive correlation between the C$ and GNX has been even
stronger than the positive correlation between the A$ and GNX. The notable
exception occurred during the first half of 2008, when a speculative
blow-off move to the upside in the commodity markets was accompanied by a
decline in the C$. This divergence was a warning that the commodity-price
gains would prove to be temporary.
We are expecting the upward trends in the commodity indices and the
commodity currencies to extend well into next year, although it's likely
that short-term corrections will begin soon.
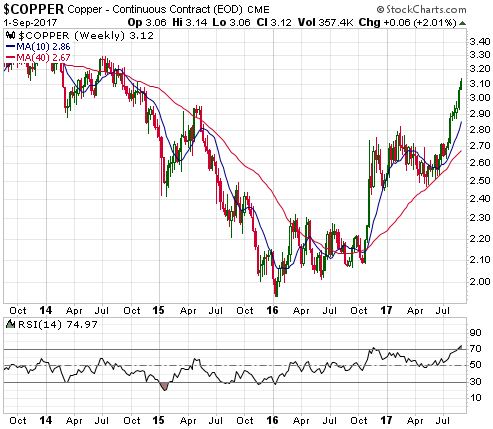
Copper!
Base-metals markets are continuing to strengthen, with the copper
market leading the way.
Our most recent comment on the copper price
was in the 7th August Weekly Update, when it was at US$2.88. At that time
we thought there was a good chance of a near-term move up to around $3.00,
but we doubted that it would do significantly better than that prior to
beginning a 1-3 month correction. It turned out that we underestimated the
near-term upside potential, because the copper price traded as high as
$3.14 last week.
By two measures, the copper price is now
sufficiently stretched to the upside to warrant more than the usual amount
of caution. The first measure is the RSI shown at the bottom of the
following weekly chart. Thanks in large part to having risen for 8 weeks
in succession and 10 of the past 11 weeks, the weekly RSI is now at a
10-year high.
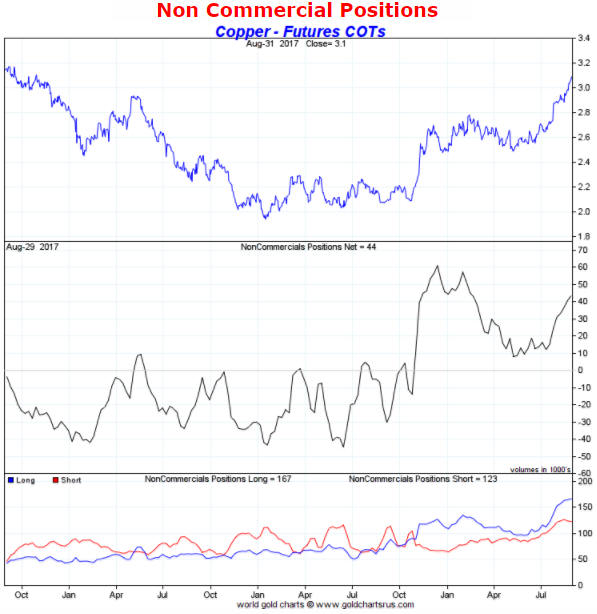
The second measure is the Commitments of Traders (COT) situation.
Although the middle section of the following chart shows that the NET
speculative long position in Comex copper futures is still comfortably
below its December-2016 high, the blue line in the bottom section of the
chart shows that the GROSS speculative long position in copper futures is
well above its December-2016 high. In fact, the gross speculative long
position in Comex copper futures is at an all-time high.
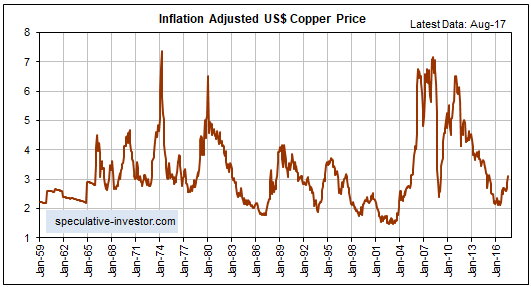
Our concern about downside risk in the copper price is, however,
tempered by the following monthly chart of the inflation-adjusted (IA)
copper price. This chart puts the rally from the 2016 bottom into
perspective and suggests that although there are good reasons to expect
some short-term weakness, on a long-term basis the price is still at a
depressed level. There is almost no chance that it will return to its 2008
inflation-adjusted peak within the next few years, but a rise to at least
$4 is certainly possible.
To correct the current 'overbought' extreme, within the coming two
months the copper price should drop to near its 50-day MA and could drop
as far as its 200-day MA. Be aware, though, that a multi-week top hasn't
yet been signaled, which means that there could be a brief extension of
the price surge before a correction starts. A near-term spike to as high
as $3.30 (resistance defined by the mid-2014 top) is not out of the
question.
Regardless of whether a short-term top is in place or
will be put in place via a final surge during the first half of September,
the copper price has the potential to trade well above its
August-September-2017 high within the coming 9 months. We have $4 in mind
as an intermediate-term upside target.
The Stock Market
The Big Picture
The ECB got around to reporting monetary data for July last week,
enabling us to update
our calculation of G2 True Money Supply (TMS). This, in turn, enabled
us to update our new stock-market model (the Equity True Fundamentals
Model - ETFM). Refer to the 14th August Weekly Update for a discussion of
this model.
The ETFM should provide timely/early warnings of major
trend shifts in the US stock market, but it probably won't signal
short-term trend shifts. As illustrated by the following chart, it was
unchanged over the past month and remains "neutral".
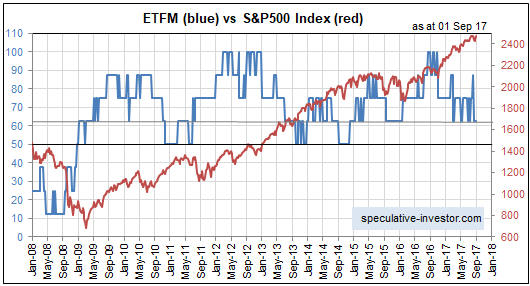
The ETFM will turn bearish if all else remains the same and the G2 TMS
growth rate drops below 6%, which could well happen within the next two
months.
Also related to the big picture, the margin debt figure for
July was reported by the NYSE last week. NYSE Margin Debt made a marginal
new all-time high in July, which implies that the equity bull market is
not over.
It doesn't matter how expensive the market becomes, as
long as leverage is still on the rise it is likely to become even more
expensive before it reaches its ultimate peak. It is only after the total
amount of debt-based leverage begins to contract that the proverbial
chickens come home to roost.
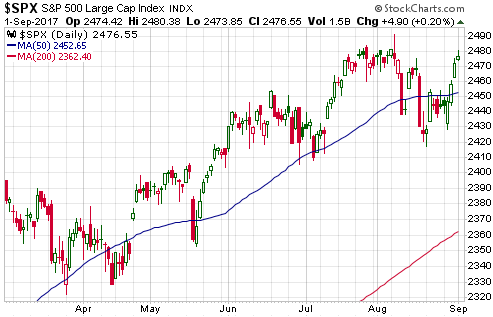
Current Market Situation
Last week was very good for our bullish positions and bad for our
bearish positions. Specifically, the majority of the stocks we own/follow
rallied, but our bearish option speculations were hit hard.
To our
chagrin, the S&P500 Index (SPX) did well last week. After trading as low
as 2430 on Tuesday it rebounded strongly to end the week only slightly
below its all-time high.
Critical support for the SPX lies at
2400-2410. This support must be breached to signal that a correction
worthy of the name has finally begun.
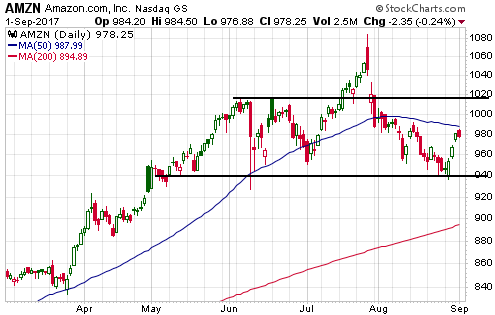
With the SPX having rebounded strongly it is not surprising that the
stock price of Amazon.com (AMZN) recouped some of its recent losses.
AMZN's chart pattern continues to look bearish, though.
AMZN has
resistance at its 50-day MA ($988) and then at $1020. Based on the price
action over the past two weeks, critical support lies at $940.
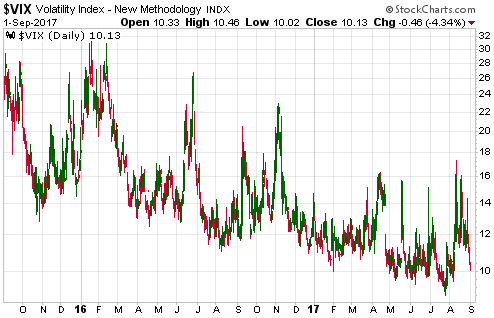
The SPX's rebound to near its all-time high has caused fear to
evaporate. A consequence is that the Volatility Index (VIX) has returned
to within a point or so of its July-2017 all-time low.
We have been expecting a decline to a September-October low. For our
expectation to remain realistic the decline will have to begin in earnest
this week.
This week's
significant US economic events
[Notes:
1) The most important events
(to the markets) are shown
in bold. 2) A list of global economic events can be found
HERE]
| Date | Description |
| Monday Sep-04 | US (and Canadian) markets closed for public holiday |
| Tuesday Sep-05 | Factory Orders |
| Wednesday Sep-06 |
ISM Non-Mfg Index International Trade Balance Fed's Beige Book |
| Thursday Sep-07 | No important events scheduled |
| Friday Sep-08 | Consumer Credit |
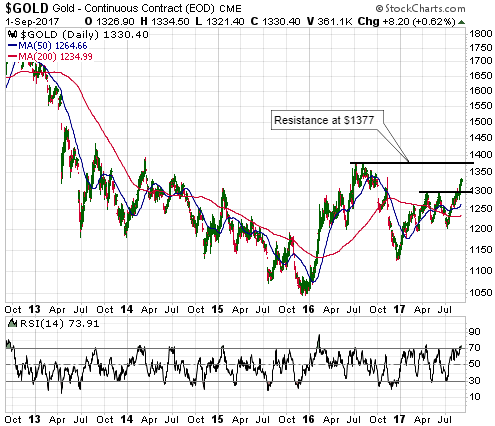
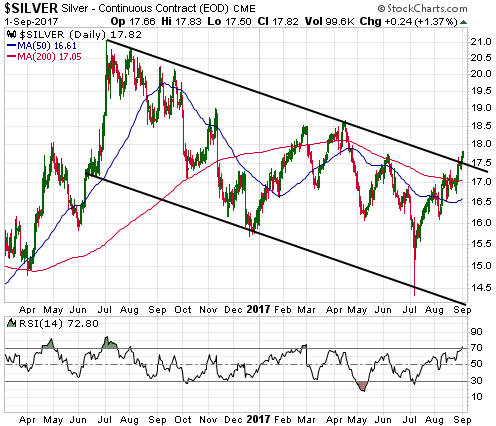
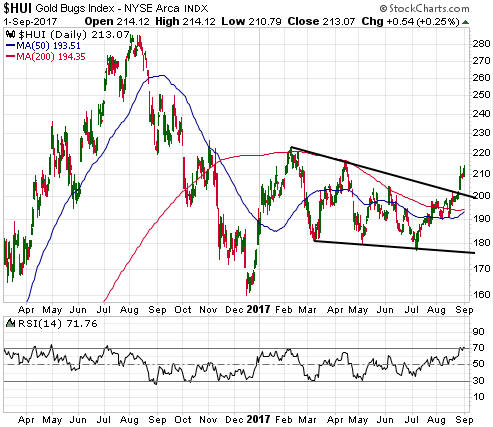
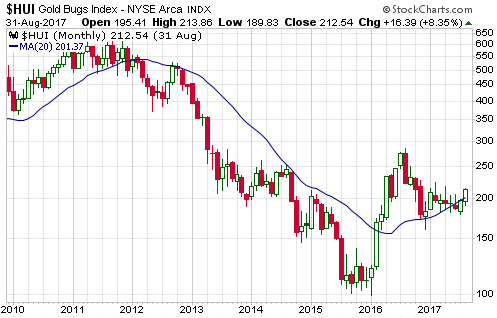
Gold and the Dollar