|
-- Weekly Market Update for the Week Commencing 4th October 2010
Big Picture
View
Here is a summary of our big picture
view of the markets. Note that our short-term views may differ from our
big picture view.
In nominal dollar terms, the BULL market in US Treasury Bonds
that began in the early 1980s will end by mid-2010. In real (gold)
terms, bonds commenced a secular BEAR market in 2001 that will continue
until 2014-2020. (Last
update: 09 February 2009)
The stock market, as represented by the S&P500 Index, commenced
a secular BEAR market during the first quarter of 2000, where "secular
bear market" is defined as a long-term downward trend in valuations
(P/E ratios, etc.) and gold-denominated prices. This secular trend will bottom sometime between 2014 and 2020. (Last update: 22 October 2007)
A secular BEAR market in the Dollar
began during the final quarter of 2000 and ended in July of 2008. This
secular bear market will be followed by a multi-year period of range
trading. (Last
update: 09 February 2009)
Gold commenced a
secular bull market relative to all fiat currencies, the CRB Index,
bonds and most stock market indices during 1999-2001. This secular trend will peak sometime between 2014 and 2020. (Last update: 22 October 2007)
Commodities,
as represented by the Continuous Commodity Index (CCI), commenced a
secular BULL market in 2001 in nominal dollar terms. The first major
upward leg in this bull market ended during the first half of 2008, but
a long-term peak won't occur until 2014-2020. In real (gold) terms,
commodities commenced a secular BEAR market in 2001 that will continue
until 2014-2020. (Last
update: 09 February 2009)
Copyright
Reminder
The commentaries that appear at TSI
may not be distributed, in full or in part, without our written permission.
In particular, please note that the posting of extracts from TSI commentaries
at other web sites or providing links to TSI commentaries at other web
sites (for example, at discussion boards) without our written permission
is prohibited.
We reserve the right to immediately
terminate the subscription of any TSI subscriber who distributes the TSI
commentaries without our written permission.
Outlook Summary
Market
|
Short-Term
(0-3 month)
|
Intermediate-Term
(3-12 month)
|
Long-Term
(1-5 Year)
|
Gold
|
Neutral
(04-Jul-10)
|
Bullish
(12-May-08)
|
Bullish
|
US$ (Dollar Index)
|
Neutral
(01-Sep-10)
| Neutral
(27-Sep-10)
|
Neutral
(19-Sep-07)
|
Bonds (US T-Bond)
|
Neutral
(20-Sep-10)
|
Bearish
(14-Dec-09)
|
Bearish
|
Stock Market (S&P500)
|
Neutral
(01-Sep-10)
|
Neutral
(25-Aug-10)
|
Bearish
|
Gold Stocks (HUI)
|
Bullish
(01-Sep-10)
|
Bullish
(23-Jun-10)
|
Bullish
|
| Oil | Neutral
(01-Sep-10)
| Bearish
(01-Mar-10)
| Bullish
|
Industrial Metals (GYX)
| Neutral
(01-Sep-10)
| Bearish
(25-May-09)
| Neutral
(11-Jan-10)
|
Notes:
1. In those cases where we have been able to identify the commentary in
which the most recent outlook change occurred we've put the date of the
commentary below the current outlook.
2. "Neutral", in the above table, means that we either don't have a
firm opinion or that we think risk and reward are roughly in balance with respect to the timeframe in question.
3. Long-term views are determined almost completely by fundamentals,
intermediate-term views by giving an approximately equal weighting to
fundamental and technical factors, and short-term views almost
completely by technicals.
The Fed's BS
"BS", of course, refers to Balance Sheet.
There is widespread expectation that the Fed will soon take another big
step along the inflation path by substantially expanding its balance
sheet. Based on the way the US$ has been weakening and most investments
have been rising in US$ terms, it seems that the markets have already
gone a long way towards discounting this balance-sheet expansion. We
stress, though, that the Fed is yet to take the widely expected action.
As evidenced by the following chart of Federal Reserve Credit (a
reflection of the size of the Fed's balance sheet), total Fed credit is
presently less than 5% higher than it was at the end of 2008 and has
been tapering off over the past few months.
We reiterate what we said in a previous commentary, which is that the
further the markets go towards discounting "QE2" the less likely QE2
will become. In our opinion, the probability of QE2 happening within
the next few months is now very low and will drop to almost zero if
prices continue their current upward trends.
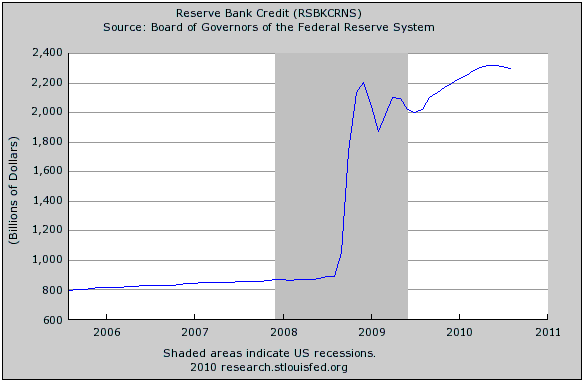
The fact that the
markets have now moved so far in response to something that is yet to
actually happen creates a risk. The risk is that the markets come to
the realisation that QE2 is not going to happen anytime soon and
quickly retrace the gains made over the past several weeks. Ironically,
if the realisation that QE2 has become unlikely prompts sharp declines
in equities, commodities, gold and bonds, the probability of a
near-term monetary easing will receive a hefty boost. In other words,
we perceive an inverse relationship between the probability of QE2
actually happening and the extent to which the markets anticipate the
inflationary effects of a future monetary easing.
Interesting quote or fact of the week
Using the example of Ford Motor Company during the 1910s, the Investors Business Daily editorial entitled "The Supply-Side Lesson of Henry Ford"
explains in concise and clear terms how economic prosperity occurs and
why almost all of the Obama Administration's economic policies will
make the US poorer. Here's an excerpt:
"The desire to increase his profits by reducing the cost of producing cars was the real reason Ford raised wages. It worked.
In 1913, Ford had an
employee turnover rate of 380%, which required hiring 52,000 workers
annually to maintain a work force of 13,600. In addition to the cost of
replacing workers, productivity suffered from a 10% absentee rate, and
the workers who showed up were inexperienced and commonly shirked as
much as they worked.
Higher wages remedied
these problems. Anxious prospects lined up in hopes of being hired by
Ford, who employed only those whose personal habits indicated they
would be dependable workers as determined through investigations,
including home visits, by his personnel department. Ford paid for
dependability, and he got it.
In 1915, Ford's turnover
rate fell to 16% as productivity soared. He reduced the Model T's price
by 10% each year from 1914 to 1916, and his annual profit increased to
$60 million from $30 million. Ford was quoted as saying that more than
doubling wages "was one of the finest cost-cutting moves we ever made."
Ford increased the
purchasing power of his workers by paying them more. But far more
importantly he increased the general purchasing power by reducing the
production cost, lowering the price and increasing the output of a
product consumers wanted.
In other words, he increased purchasing power almost entirely by increasing supply, not increasing demand."
As well as being a good businessman, Henry Ford knew about fractional reserve banking. That's why he said:
"It is well enough that
people of the nation do not understand our banking and monetary system,
for if they did, I believe there would be a revolution before tomorrow
morning."
The Stock
Market
The latest report from the
ISM (Institute of Supply Management) indicated that the US
manufacturing sector continued to expand during September. The report,
which was released on Friday, was roughly in line with expectations and
therefore didn't move the stock market to a significant degree.
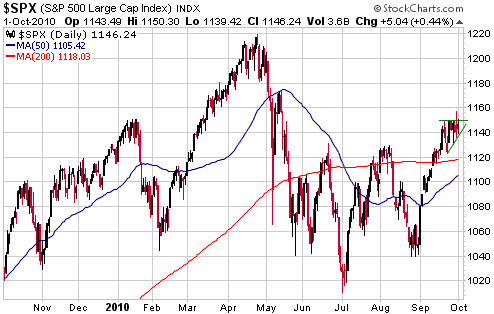
The US stock market is about to enter the most bullish 2-month phase of
the Presidential Cycle's second year, but the market's short-term
upside potential has been reduced by the fact that it didn't decline
during the weeks leading up to this period. If the market had followed
the Presidential Cycle model then it would have trended lower over the
past 6 weeks and would now be very 'oversold', thus setting the scene
for a strong multi-month rebound. However, it stopped following the
model in late August and is entering the normally bullish period in an
'overbought' state. Our guess is that it will maintain its upward bias
over the next couple of months, but won't make much headway.
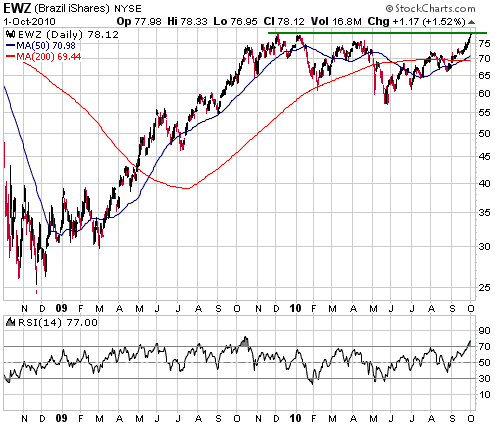
Below are charts of the S&P500 Index (SPX) and iShares Brazil
(EWZ). The SPX chart shows repeated tests of resistance at 1150 over
the past two weeks and a series of rising intra-day lows. A daily close
above 1150 would suggest a near-term target of 1175. The EWZ chart
shows that intermediate-term resistance defined by the December-2009
peak is now being tested. A pullback from resistance is the most likely
outcome.
It has been widely
reported that September-2010 was the best September for the US stock
market since 1939. What hasn't been widely reported is that the Dow
Industrials Index lost 30% during the 9 months following September-1939.
This week's
important US economic events
| Date |
Description |
Monday Oct 04
| Factory Orders
Pending Home Sales Index
| | Tuesday Oct 05 | ISM Non-Manufacturing Index
| | Wednesday Oct 06
| No important events scheduled
| | Thursday Oct 07
| Consumer Credit
| | Friday Oct 08
| Monthly Employment Report
|
Gold and
the Dollar
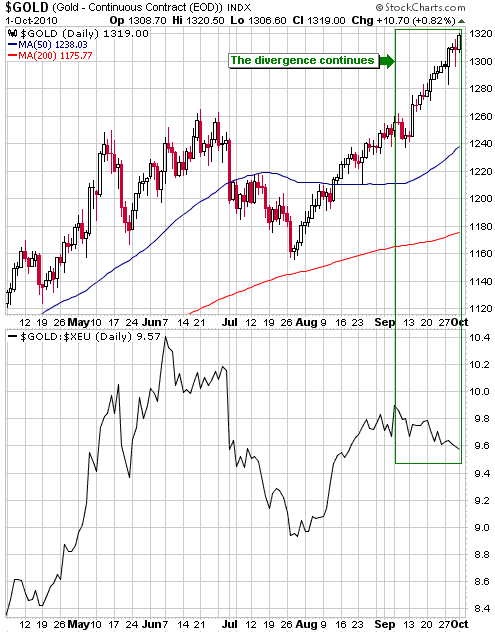
Gold
In US$ terms, gold continues to plod upward in relentless fashion and
made another new all-time high on Friday. The steadiness of gold's
ascent is indicated by the fact that over the past 47 trading days it
has gained $160 without experiencing a single daily decline in excess
of 1%.
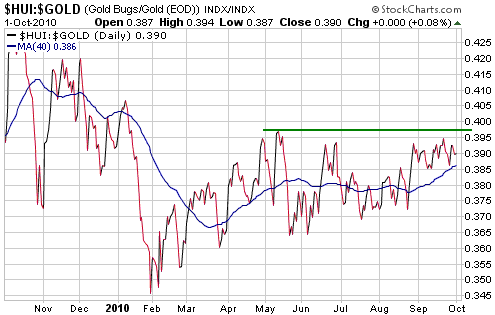
In euro terms, gold peaked in June and closed at a new 6-week LOW on Friday.
The recent divergence between the US$-denominated gold price and the euro-denominated gold price is illustrated below.
There are other
non-confirmations of the recent new highs achieved by the
US$-denominated gold price, chief among them being the HUI/gold ratio's
inability to break above its May high.
With regard to gold's
intermediate- and long-term prospects, the non-confirmations mentioned
above don't concern us at all. When considered alongside the extent to
which gold is now 'overbought' in US$ terms they do, however, temper
our short-term optimism.
For us to become more enthusiastic about gold's short-term prospects
there will have to be a significant pullback. By "significant" we mean
a pullback that lasts at least a couple of weeks and/or takes the price
back to near the 50-day moving average (now at $1238 and rising). On
the other hand, if the upward trend continues without any meaningful
interruption and the above-mentioned non-confirmations remain in place
then every move to a new high will simply add to the risk.
By the way, one thing we aren't concerned about is the current high
level of the speculative net-long position in COMEX gold futures. In
the gold market the large speculators constitute the "smart money".
When most speculators are involved on the 'long' side of the gold
futures market there is the potential for a downward correction to be
exacerbated by long liquidation, but an unusually high speculative
net-long position is not, in and of itself, a danger sign.
Gold Stocks
Current Market Situation
We are beginning to wonder how high the gold price will have to go to
push the HUI above major resistance at 515-520. Obviously, $1320/oz
isn't high enough.
The HUI is clearly having trouble breaking out to a new high as we
enter a multi-week time window when the gold sector often declines or
consolidates. If it couldn't break out during the seasonally strong
multi-week period just ended, how will it break out during the
seasonally weak multi-week period that is just about to begin?
Seasonality is just one small piece of a large puzzle, so the fact that
October has tended to be a sub-par month for the gold sector doesn't
mean that the HUI won't break decisively above 520 in the near future.
However, taking into account the bearish divergence between gold/US$
and gold/euro and that gold/US$ is very 'overbought' on a short-term
basis, the odds certainly appear to favour 'corrective activity' during
October.
A normal short-term pullback would take the HUI back to its 50-day
moving average, which is now at 476 and rising at the rate of around
one point per day. A larger degree pullback would take the HUI back to
near its 50-week moving average (now at 447), but we don't think a
decline of this magnitude is likely over the next several weeks.
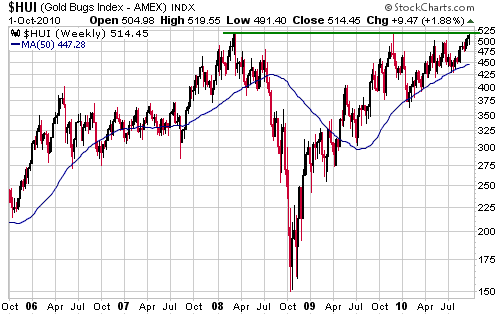
It will be difficult
for anyone who is bearish on the gold sector to maintain their stance
if the HUI clearly breaks above 520. This could mean that there will be
substantial follow-through to the upside after the breakout eventually
occurs, due to the short-covering and new long-side positioning of the
former bears. Still, in our book it is always better to buy pullbacks
to support than breakouts above resistance.
Gold Royalties
The gold royalty business-model is attractive, because if implemented
correctly it provides shareholders with exposure to the upside of gold
mining while greatly reducing exposure to the risks of gold mining. For
example, most of the royalties owned by companies such as Royal Gold
(RGLD) are the Net Smelter Return (NSR) variety, which means that the
royalty-owner's income is solely determined by the amount of production
and the price of gold. That is, an increase in mining cost usually
won't affect the royalty owner.
But despite the attractiveness of its business model the following
chart shows that RGLD, the top company in the gold royalty space, has
under-performed gold bullion by a wide margin since the beginning of
2003. In other words, although RGLD has generated a reasonable return
in US$ terms over the past 7 years and 9 months (as evidenced by the
top section of the chart), its shareholders would have been far better
off owning gold bullion. There is no point owning a gold stock that
doesn't handily outperform gold bullion, because even the best-quality
mining stock in the world is a lot riskier than bullion. It is
therefore fair to say that RGLD has been a relatively poor investment
for many years.
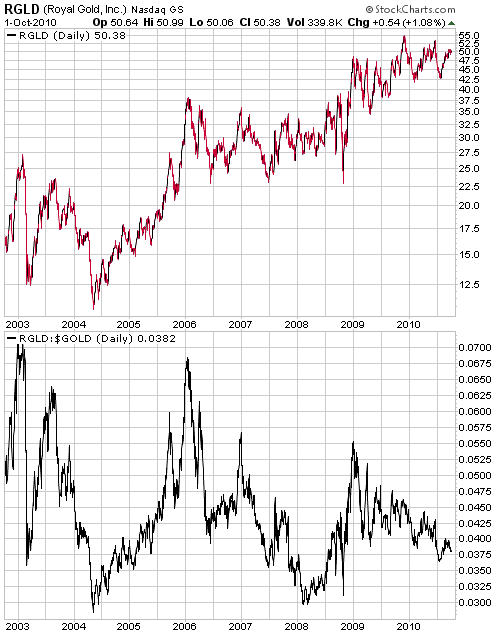
Valuation is the main
reason that RGLD began to under-perform gold at the beginning of 2003.
Specifically, the stock had become extremely over-valued thanks to its
spectacular ascent over the preceding few years, and extreme
over-valuation invariably leads to relatively poor long-term
performance. Another probable reason is that large royalty companies
are very difficult to value. They usually look expensive based on
current earnings, but they have royalty agreements associated with many
dozens of exploration-stage projects. Valuing the royalties on these
exploration-stage projects is problematic, because some of them will
eventually become "cash cows", some of them will eventually be proven
worthless, and all of them are years away from production.
Anyhow, the main point we wanted to make today is that RGLD is
presently in the bottom quartile of its 8-year range relative to gold.
This suggests that the stock stands a good chance of providing
respectable leverage to FUTURE gains in the gold price. For example, a
15% rise in the gold price along with a return to 0.065 by the
RGLD/gold ratio would require a gain of around 100% in the RGLD stock
price.
For investors prepared to hold for at least two years, we think RGLD is
a reasonable buy at its current price and would be a strong buy below
$45.
Currency Market Update
Based on the daily 14-period RSI (Relative Strength Index), the Dollar
Index is now more 'oversold' than at any time since April-2008.
However, the weekly 14-period RSI shown at the bottom of the following
Dollar Index chart hasn't yet reached an 'oversold' extreme (we
consider below 30 to be extreme). In other words, the Dollar Index is
at an extreme on a short-term basis, but not on an intermediate-term
basis.
When the Dollar Index began its decline during the second quarter of
this year we didn't think it would fall anywhere near far enough to
become 'oversold' on an intermediate-term basis. We were expecting a
normal downward correction within the context of a continuing
intermediate-term advance, but what we've ended up with is an
intermediate-term decline. We'd like to blame the Fed, but as discussed
near the beginning of today's report the Fed hasn't actually done
anything in the recent past to devalue the dollar. The transformation
from a normal downward correction to a full-blown intermediate-term
decline has largely been driven by expectations of what the Fed may do
in the future.
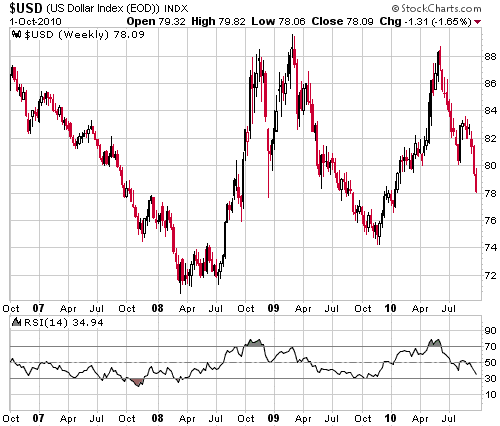
Even if the Dollar
Index is on its way to becoming 'oversold' on an intermediate-term
basis, it is likely to experience at least a 2-point bounce in the near
future.
Update
on Stock Selections
(Notes: 1) To review the complete list of current TSI stock selections, logon at http://www.speculative-investor.com/new/market_logon.asp
and then click on "Stock Selections" in the menu. When at the Stock
Selections page, click on a stock's symbol to bring-up an archive of
our comments on the stock in question. 2) The Small Stock Watch List is
located at http://www.speculative-investor.com/new/smallstockwatch.html)
 Clifton Star Resources (TSXV: CFO). Shares: 31M issued, 38M fully diluted. Recent price: C$4.23 Clifton Star Resources (TSXV: CFO). Shares: 31M issued, 38M fully diluted. Recent price: C$4.23
CFO's joint venture partner (Osisko) reported another round of drilling
results for the Duparquet project last Thursday. The results were
generally good, and included the following meaningful gold intercepts:
88.0m of 1.90 g/t
25.5m of 3.37 g/t
40.0m of 2.26 g/t
16.5 of 3.12 g/t
43.5m of 1.29 g/t
177.0m of 1.46 g/t
100.0m 1.66 g/t
The stock price fell 6% on the day, but we doubt that this was a reaction to the news. As noted above, the results were good.
We suspect that the current inability of CFO's stock price to get any
traction is primarily due to the consistent selling of one large
shareholder (Joe Dwek Management - JDM). This shareholder has indirect
control over about 13% of CFO's fully diluted share count, and for
reasons that in our opinion have nothing to do with CFO's speculative
merits appears to be set on making a complete exit by selling into any
strength.
A daily close above resistance at C$4.80-$5.00 would be a clear sign
that new buying demand was beginning to gain the upper hand. In the
mean time, speculators should take advantage of the weakness created by
the relentless selling of the aforementioned shareholder.
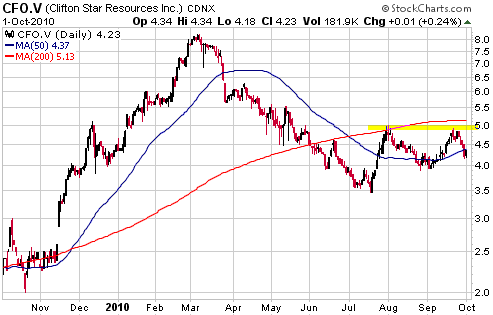
The 2010 drilling
campaign at the Duparquet project is complete, but at this stage the
results have been reported for less than half of the drilled holes.
This should mean that there will be good news flow over the next few
months as Osisko works through its reporting backlog.
Northgate Minerals (AMEX: NXG, TSX: NGX). Shares: 290M issued, 297M fully diluted. Recent price: US$3.05
The full details of NXG's US$150M (increased from the original $135M)
convertible note offering were announced on Thursday. The notes will
bear interest at 3.5% per annum and will be convertible into common
shares at an effective price of US$4.08/share. Of greatest importance,
upon conversion NXG will have the option of providing cash in lieu of
shares. Consequently, there won't necessarily be any share dilution as
a result of this note offering.
Large convertible note offerings such as the one just completed by NXG
tend to put a lot of downward pressure on the shares in the very
short-term because the buyers of the notes will often hedge their risk
by short-selling the common shares. From a longer-term perspective,
however, the financing was structured in a positive way.
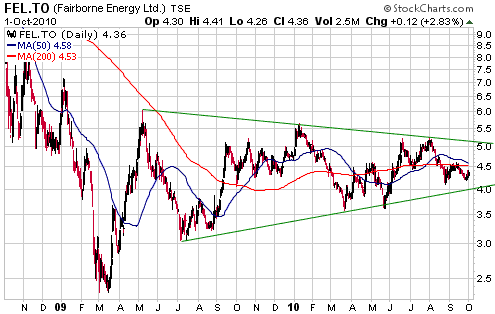
Fairborne Energy (TSX: FEL). Shares: 102M issued, 112M fully diluted. Recent price: C$4.36
FEL, a mid-tier natural gas producer, has spent the past 17 months
oscillating within a large contracting triangle. C$8.00 would be the
measured objective following an upside breakout from this triangle.
We think that FEL would be a reasonable short- or intermediate-term
speculation at around C$4.00, using a daily close below C$3.50 as an
initial stop.
Agriculture ETF (NYSE: DBA). Recent price: US$26.65
DBA closed a few cents above our 5% trailing stop on Friday, but it
looks like the short-term upward trend has ended in the agriculture
sector. We are therefore going to remove the short-term DBA position
from the TSI List. The profit on the trade was 15.4%.
Chart Sources
Charts appearing in today's commentary
are courtesy of:
http://stockcharts.com/index.html

|