|
-- Weekly Market Update for the Week Commencing
4th November 2013
Big Picture
View
Here is a summary of our big picture
view of the markets. Note that our short-term views may differ from our
big picture view.
In nominal dollar terms, the BULL market in US Treasury Bonds
that began in the early 1980s will end by 2013. In real (gold)
terms, bonds commenced a secular BEAR market in 2001 that will continue
until 2014-2020. (Last
update: 23 January 2012)
The stock market, as represented by the S&P500 Index,
commenced
a secular BEAR market during the first quarter of 2000, where "secular
bear market" is defined as a long-term downward trend in valuations
(P/E ratios, etc.) and gold-denominated prices. This secular trend will bottom sometime between 2014 and 2020.
(Last update: 22 October 2007)
A secular BEAR market in the Dollar
began during the final quarter of 2000 and ended in July of 2008. This
secular bear market will be followed by a multi-year period of range
trading.
(Last
update: 09 February 2009)
Gold commenced a
secular bull market relative to all fiat currencies, the CRB Index,
bonds and most stock market indices during 1999-2001.
This secular trend will peak sometime between 2014 and 2020.
(Last update: 22 October 2007)
Commodities,
as represented by the Continuous Commodity Index (CCI), commenced a
secular BULL market in 2001 in nominal dollar terms. The first major
upward leg in this bull market ended during the first half of 2008, but
a long-term peak won't occur until 2014-2020. In real (gold) terms,
commodities commenced a secular BEAR market in 2001 that will continue
until 2014-2020.
(Last
update: 09 February 2009)
Copyright
Reminder
The commentaries that appear at TSI
may not be distributed, in full or in part, without our written permission.
In particular, please note that the posting of extracts from TSI commentaries
at other web sites or providing links to TSI commentaries at other web
sites (for example, at discussion boards) without our written permission
is prohibited.
We reserve the right to immediately
terminate the subscription of any TSI subscriber who distributes the TSI
commentaries without our written permission.
Outlook Summary
Market
|
Short-Term
(1-3 month)
|
Intermediate-Term
(6-12 month)
|
Long-Term
(2-5 Year)
|
|
Gold
|
Neutral
(04-Nov-13)
|
Bullish
(26-Mar-12)
|
Bullish
|
|
US$ (Dollar Index)
|
Neutral
(24-Dec-12)
|
Neutral
(18-Sep-13)
|
Neutral
(19-Sep-07)
|
|
Bonds (US T-Bond)
|
Bullish
(24-Jun-13)
|
Neutral
(18-Jan-12)
|
Bearish |
|
Stock Market
(DJW)
|
Bearish
(04-Nov-13)
|
Bearish
(28-Nov-11)
|
Bearish
|
|
Gold Stocks
(HUI)
|
Neutral
(04-Nov-13)
|
Bullish
(23-Jun-10)
|
Bullish
|
|
Oil |
Neutral
(30-Jul-12)
|
Neutral
(31-Jan-11)
|
Bullish
|
|
Industrial Metals
(GYX)
|
Neutral
(30-Jul-12)
|
Neutral
(29-Aug-11)
|
Neutral
(11-Jan-10)
|
Notes:
1. In those cases where we have been able to identify the commentary in
which the most recent outlook change occurred we've put the date of the
commentary below the current outlook.
2. "Neutral", in the above table, means that we either don't have a
firm opinion or that we think risk and reward are roughly in balance with respect to the timeframe in question.
3. Long-term views are determined almost completely by fundamentals,
intermediate-term views by
fundamentals, sentiment and technicals, and short-term views by sentiment and
technicals.
The "pushing on a string"
myth
When the Fed began aggressively pumping
money into the US economy during the final few months of 2008, a popular refrain
was: "The Fed is effectively pushing on string. The new money won't do anything
because its quantity is trivial compared to the total amount of debt." If
nothing else, hopefully the events of 2009-2013 have convinced many people that
this line of thinking is wrong.
By ramping up the money supply the Fed cannot possibly bring about real economic
progress. In fact, creating money out of nothing always gets in the way of real
economic progress because it reduces the validity of the price signals upon
which investing and business decisions rely. A result is the boom-bust cycle,
with mal-investment during the boom phase leading to the bust phase and with the
bust being in proportion to the preceding monetary-inflation-fueled boom.
Perhaps the "pushing on a string" analogy is meant to suggest that the Fed can't
create real growth with its money-pumping. However, it is quite simply a bad
analogy because it implies that under certain circumstances the money-pumping
does nothing. The reality is that regardless of the economic circumstances,
ramping up the money supply changes the structure of the economy and
redistributes wealth. Furthermore, it is crystal clear that the Fed is capable
of dramatically raising prices, even when the economy-wide level of debt is high
and the public is deleveraging.
Whenever the Fed begins rapidly pumping money into the economy, there will never
be any question that some prices will end up rising a lot in reaction to the
money-pumping. The only legitimate question will be: Which prices? The answer to
this question is always obvious in hindsight, but is sometimes difficult to
predict.
Our point is that the Fed is never really "pushing on a string" when it inflates
the money supply; it is, instead, distorting economic outcomes. Moreover, if it
were a good idea to make a government-sponsored institution responsible for
managing the economy-wide price and distribution of money and credit, then
Communism would be the most successful economic system ever devised.
Monetary Inflation Update
The following chart shows the year-over-year
growth rate of what we call G2 TMS (True Money Supply), where G2 TMS is US TMS
plus euro-zone TMS. In effect, the following chart shows the rate of senior
currency inflation.
The growth rate of G2 TMS is, we think, the most useful of all the monetary
indicators.
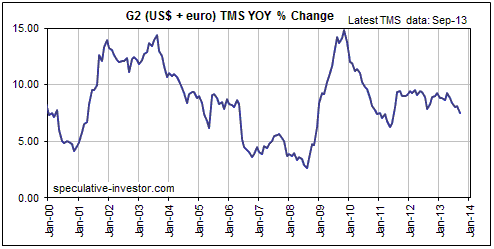
If past is prologue, the next severe global recession and/or financial crisis
will not begin until after the year-over-year G2 TMS growth rate drops below 5%.
It is presently about 7.5%, which is near the bottom of its 4-year range but not
in the 'danger zone'.
Our concern is that due to the distortions and economic weaknesses stemming from
earlier bouts of rapid monetary inflation, it will take less of a decline in the
G2 TMS growth rate to precipitate the next global recession/crisis.
Consequently, we aren't going to blindly assume that all will remain
superficially well as long as G2 TMS continues to expand at more than 5%/year.
We will, instead, be on guard for signs that the bubbles that have been fostered
by the monetary inflation of the past few years are beginning to deflate.
US manufacturing still
strong
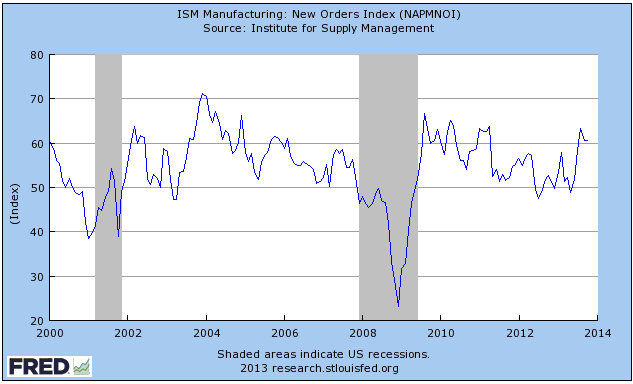
The most useful coincident indicator of US
economic performance remains at a relatively high level. We are referring to the
monthly ISM Manufacturing New Orders Index, which just achieved its third
consecutive 60+ reading.
This suggests that the start of the next official US recession is at least 6
months away.
The Stock
Market
The US
The bullish monetary backdrop
Almost everything is in place for a major top in the US stock market. Of
particular relevance, the average valuation is high by historical standards
(consistent with the valuation at the top of all long-term bull markets apart
from the 2000 top), the bull market is old by historical standards, sentiment is
complacent, and price is extended to the upside based on short-term and
intermediate-term momentum measures. A meaningful tightening of monetary
conditions is the one important factor that is not in place.
A meaningful tightening of monetary conditions preceded the 2007 peak, the 2000
peak, the 1987 peak and the 1929 peak. Also, a meaningful tightening of monetary
conditions began at around the same time as the US stock market was hitting a
long-term high in early-1973. Currently, monetary conditions are not as loose as
they were two years ago, but the True Money Supply (TMS) is still growing at a
moderately fast pace.
With regard to the monetary backdrop, the present situation is unprecedented. Of
importance to this discussion about the stock market, this is the first time
ever that the Fed has been aggressively ramping up the money supply more than
four years into a cyclical equity bull market. At this advanced stage of
previous bull markets the Fed was always well into a monetary tightening
campaign. Moreover, all signs at this time point to the Fed remaining
'ultra-easy' for at least six more months.
Due to the on-going extraordinary actions of the Fed there is an outside chance
that the long-term advance could continue for up to 12 more months, with at
least two scary short-term corrections along the way. However, in the unlikely
event that such a bull-market extension did happen there would, we think, be a
change in leadership, with leadership switching to commodity and gold stocks as
per the final 12 months of the 1982-1987 advance.
The bearish sentiment backdrop
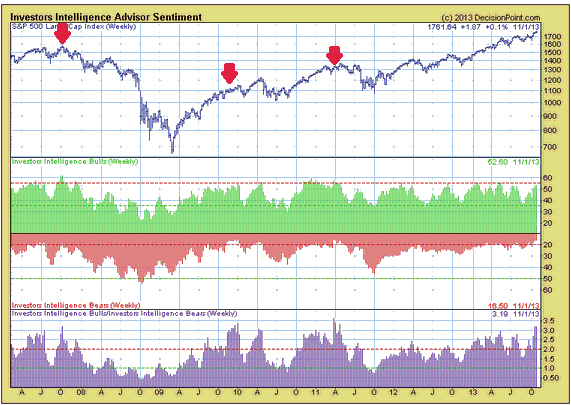
According to the Investors Intelligence (II) survey, last week the ratio of
bullish advisors to bearish advisors moved above 3 for the first time since
early-2011. Now that the dangerous September-October period is out of the way it
seems that almost everyone is convinced that the stock market will stay on its
upward path for at least a few more months.
The following chart shows the S&P500 Index, the II bullish percent, the II
bearish percent, and the II bull/bear ratio. We've put red arrows on the chart
to mark the last three times that the bull/bear ratio moved above 3. The first
of these prior three occasions was near the major 2007 peak and was followed by
a decline of more than 50% over the ensuing 17 months. The second was in
late-2009 and was followed by 9 months of choppy sideways trading. The third was
in March-2011 and was followed by a 15% correction over the ensuing 6 months.
The II bull/bear ratio's performance of the past several years therefore
suggests a risk/reward ratio that is heavily skewed towards risk, with months of
sideways trading being the best case and a major bear market being the worst
case.
The price action
The non-confirmation between senior US stock indices was still in place at the
end of last week. As illustrated by the following chart, the NASDAQ100 Index (NDX)
is in upside blow-off mode and continues to make new multi-year highs, whereas
the Dow Industrials Index has done no more than move up to the top of the
horizontal range in which it has oscillated since May.
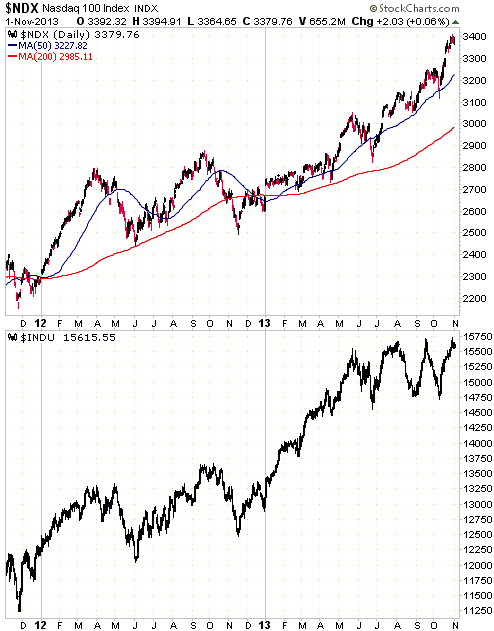
As we mentioned a week ago, if the Dow were to confirm the NDX's new high in the
near future it wouldn't be a short-term bullish signal. The reason is that the
confirmation would be happening with the market dangerously extended to the
upside. Furthermore, with the II bull/bear ratio having moved above 3 the risk
is now higher and the potential reward lower, with or without a confirming move
to new highs by the Dow.
The World
Most stock markets around the world are nowhere near as stretched to the upside
as the US stock market. Most stock markets therefore have more upside potential
than the US market. However, all markets are likely to be adversely affected
when the US market suffers its next significant decline.
Due mainly to the downside risk in the US market, our short-term stock market
outlook has shifted to "bearish".
This week's
important US economic events
| Date |
Description |
| Monday Nov 04 |
Factory Orders | | Tuesday
Nov 05 |
ISM Non-Manufacturing Index | | Wednesday
Nov 06 |
Leading Economic Indicators | | Thursday
Nov 07 |
Q3 GDP
Consumer Credit
|
| Friday Nov 08 |
Monthly Employment Report
Personal Income and Spending
Consumer Sentiment |
Gold and
the Dollar
Gold
Eric Sprott's Flawed Analysis
Great success in business or investing does not imply great understanding of
macroeconomics or how the gold price is formed. This has been proved many times
in the past by Warren Buffett. Recently, it has also been proved by Eric Sprott
in an
open
letter to the World Gold Council (WGC). Sprott criticises the
hopelessly-flawed supply-demand analysis of both the WGC and Gold Fields Mineral
Services (GFMS), but not for the right reasons. He actually uses the same
hopelessly-flawed methodology, the only differences being in some of the figures
that are plugged into the analysis.
Sprott, the WGC and GFMS tally the amounts of gold bought by some parts of the
gold market and call this quantity "demand", and tally the amounts of gold sold
by other parts of the gold market and call this quantity "supply". They then
compare the two tallies to determine whether the gold price should be rising or
falling.
In this method of analysis, the gold-mining industry is by far the biggest
seller. In fact, in this method of analysis the supply side of the equation is
always represented by the 2400-2800 tonnes per year of gold produced by the
mining industry plus the amounts of gold sold by a few relatively minor players.
Over the past year the gold ETFs have collectively been one of these minor
players on the supply side (physical gold has left the ETFs).
In the real world, however, the supply side of the equation is the total
aboveground gold inventory, which is about 150,000 tonnes. Since all the gold is
always held by someone, demand is also equal to the total aboveground inventory
of (very roughly) 150,000 tonnes. In other words, at any given time supply
equals demand equals 150,000 tonnes.
In the real world, the gold sold by the mining industry is no different to the
gold sold by any of the current holders of gold. For example, if the gold price
reaches a level at which Trader A wants to buy 1,000 ounces of gold, then Trader
A's demand can be satisfied by a sale of gold on the part of any of the current
holders of gold, including the mining industry.
Price is the quantity that changes to keep supply and demand in balance. If
demand increases relative to supply at a certain price, the price will
immediately adjust upward by as much as it takes to re-establish the balance. By
the same token, if demand falls relative to supply at a certain price then the
price will immediately adjust downward by as much as it takes to re-establish
the balance. Price, therefore, is the only measure of whether the urgency to
sell is rising or falling relative to the urgency to buy.
Here's another way to look at the situation: For every purchase there must be a
sale. That is, the amount of gold sold must always be equal to the amount of
gold bought (another reason, by the way, that it makes no sense to separately
tally sales and purchases as if one could ever be larger than the other). What
causes the price to change, therefore, isn't a greater volume of selling or
buying, it's the relative eagerness of buyers and sellers. For example, if a
large number of eager get-me-out-at-any-price sellers enter the market then the
volume of trading will increase, meaning that the amount of gold sold and the
amount of gold bought will increase by the same amount, and the price will fall.
Some analysts will look at the increase in buying that accompanied the price
decline and will be nonplussed, because they don't seem to understand that an
increase in buying MUST go hand in hand with an increase in selling, and that
the price decline tells you with 100% certainty that the sellers were more eager
than the buyers.
Over the past six months we've probably devoted too much space in TSI
commentaries to debunking the nonsensical gold supply-demand analysis that gets
put out by GFMS, the WGC, and now Eric Sprott. However, it's an important issue,
because gold bulls (including us) can't learn from past mistakes unless they
understand why they were wrong. If you were bullish over the past year and you
still believe that you were right to be bullish, then you haven't learned
anything and you will almost certainly make the same mistake again.
The Fundamentals
Even though you wouldn't know it from the price action, gold's real fundamentals
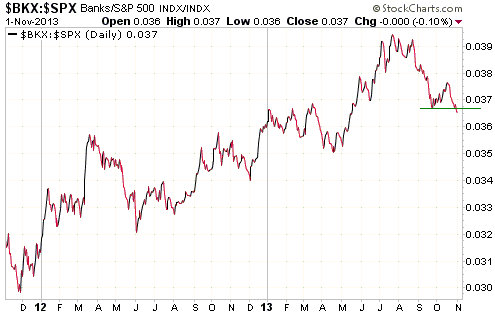
are becoming increasingly bullish. Of particular relevance, the BKX/SPX ratio
(bank stocks relative to the broad stock market) made a new multi-month low last
Friday. This indicates that confidence in the banks remains in the downward
trend that began in July, which is bullish for gold.
Commodities in general, as represented by the Continuous Commodity Index (CCI),
have been in a bear market since the first half of 2011. There is not yet any
evidence that this bear market has ended, but this should not be construed as
bearish for gold. The reason is that the first major upward leg in the gold bull
market was precipitated by evidence of economic problems and the next major
upward leg is likely to have the same initial driver. In other words, we expect
that gold will initially be powered upward by factors that are not bullish for
most other commodities.
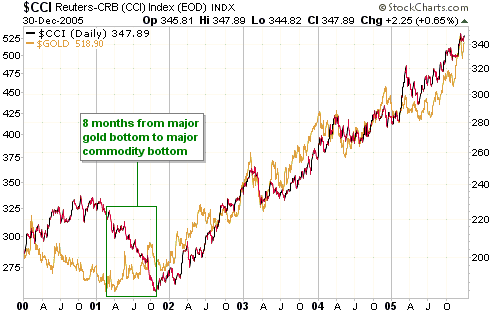
By way of further explanation we present, below, a chart comparing gold and the
CCI during 2000-2005. Notice that gold bottomed in February of 2001 whereas the
CCI didn't bottom until October of 2001. Something similar could happen this
time around.
The Price Action
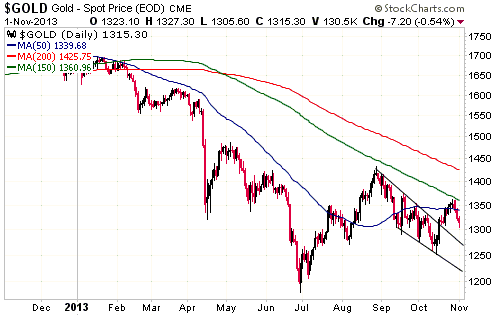
Gold achieved consecutive daily closes above its 50-day MA during the week
before last. This was another piece of evidence that a major bottom was in
place.
To maintain its short-term bullish status the gold market should ideally have
followed through to the upside last week, putting enough distance between the
current price and the 50-day MA that this MA could act as support during a
pullback. But that wasn't to be. The gold price reversed lower last week from
just above its 50-day MA and just below its 150-day MA. Last week's pullback
doesn't prove that a short-term trend reversal didn't occur in October, but it
does create uncertainty.
Last week's price action ushers in the possibility that the traditional
October-November turning point still lies ahead. That's why our short-term gold
outlook has shifted back to "neutral".
Gold's 150-day MA (the green line on the following daily chart) consistently
acted as support during 2009-2011 and now appears to be acting as resistance, in
that the late-August high and the high of the past two weeks were both just
below this MA. Consecutive daily closes above the 150-day MA could therefore be
used over the weeks immediately ahead as confirmation that the short-term trend
is up.
Gold Stocks
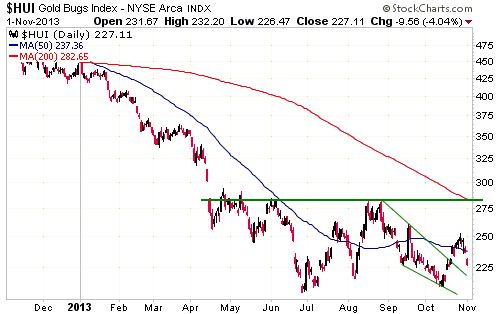
Most of what we wrote about gold's price action applies to the HUI. In a
nutshell, last week's performance casts enough doubt on the short-term outlook
to prompt a shift from "bullish" to "neutral". The traditional October-November
low could still be ahead of us.
Ideally (from a bull's perspective), the HUI will reverse upward on Monday and
not close below last week's low from here on. The reason is that another test of
the June low would stand a good chance of failing, given that triple bottoms are
rare.
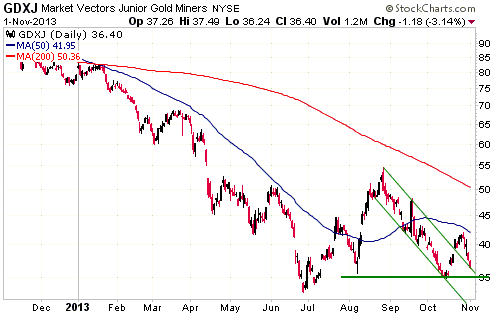
GDXJ, an ETF proxy for junior gold stocks, has given back most of the gains it
made following the mid-October low. It has important support at $35.
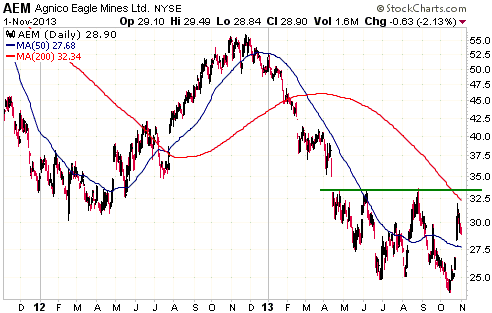
Agnico Eagle (AEM) was one of the strongest gold-mining stocks over the past
three weeks. It didn't quite make it to resistance at $33 before reversing lower
last week.
AEM's chart still looks bullish and we will be very surprised if this stock
breaks below its October low, but its inability to reach resistance at $33
before reversing downward combined with the greater-than-anticipated sector-wide
pullback indicates that it could move down to around $27 before resuming its
advance.
Currency Market Update
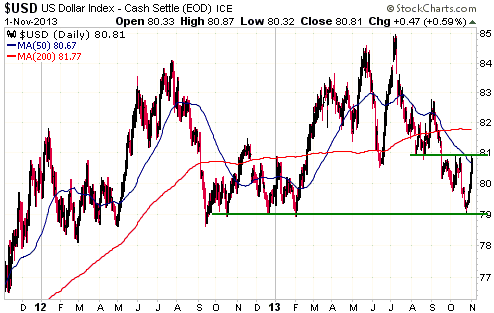
In our 28th October commentary we wrote: "Regardless of what is in store for
the currency market over the next 12 months, the odds favour some weakness in
the euro and strength in the Dollar Index over the next month or so. This is
because the euro is now very 'overbought' on a short-term basis and testing
important resistance at 138 while the Dollar Index is very 'oversold' on a
short-term basis and marginally above critical support at 79."
We got the expected weakness in the euro and strength in the Dollar Index in
spades last week. As depicted below, the Dollar Index has quickly moved from
support at 79 to resistance at 81.
If this is more than a short-lived bounce to relieve an 'oversold' condition,
the Dollar Index should do one of two things. It should either continue higher
immediately and achieve consecutive daily closes above 81, or spend 1-4 weeks
consolidating in the 80-81 range before breaking above 81.
We don't have a strong opinion on what will happen over the next few weeks. A
bounce from support at 79 was predictable, but what happens from here isn't.
Update
on Stock Selections
Notes: 1) To review the complete list of current TSI stock selections, logon at
http://www.speculative-investor.com/new/market_logon.asp
and then click on "Stock Selections" in the menu. When at the Stock
Selections page, click on a stock's symbol to bring-up an archive of
our comments on the stock in question. 2) The Small Stock Watch List is
located at http://www.speculative-investor.com/new/smallstockwatch.html
 Company
news/developments for the week ended Friday 1st November 2013: Company
news/developments for the week ended Friday 1st November 2013:
[Note: FS = Feasibility Study, IRR = Internal Rate of Return, MD&A =
Management Discussion and Analysis, M&I = Measured and Indicated,
NAV = Net Asset Value, NPV(X%) = Net Present Value using a discount
rate of X%, P&P = Proven and Probable, PEA = Preliminary Economic
Assessment, PFS = Pre-Feasibility Study]
*Almaden Minerals (AAU) reported more results from infill drilling
at its Tuligtic gold-silver project in Mexico. The on-going drilling
is confirming the continuity of the previously defined resource.
To avoid repetition, we won't mention future results from AAU's
current infill drilling program unless the results are out of the
ordinary.
*Endeavour Mining (EDV.TO) advised that it has been paid $16M cash
by Resolute Mining for a non-core exploration-stage gold asset in
Mali. An additional $3M is due on completion of the sale.
*Energy Fuels (EFR.TO) announced that a 1-for-50 share
consolidation had been approved by shareholders and would become
effective on 5th November. This is a much greater 'rollback' than we
were anticipating, but it doesn't change the value of the company.
In effect, the same pizza will be cut into 1/50th as many pieces.
The purpose of the share consolidation is to pave the way for an
NYSE listing.
*Evolution Mining (EVN.AX) issued its quarterly report for the
September quarter.
Production for the quarter was 107.2K ounces. This is about 5K
ounces less than the June quarter, but is in line with guidance.
Importantly, there was a big improvement on the cost front, with the
all-in sustaining cost falling from $1266/oz during the June quarter
to $1091/oz during the September quarter. No updated balance sheet
was provided in the quarterly report, but we estimate that this cost
reduction will have led to a $10M-$15M improvement in the company's
working capital position.
The newly commissioned Mt Carlton mine in Queensland performed well
during the September quarter, which suggests that this mine is not
going to experience the 'teething problems' that are commonplace in
the gold-mining industry.
Production guidance for the financial year ended 30th June 2014 was
maintained at 400-450K ounces of gold at an all-in sustaining cost
of $1080-$1130/oz. We will be disappointed if the actual production
result is not close to the top of the 400-450K range.
Of some concern to us, EVN has added to the gold hedge position
established in September. The company has now forward-sold 225K
ounces at A$1590/oz, with deliveries spread over the coming three
years. As we said when the company announced its initial 156K-ounce
gold hedge, the decision to forward-sell part of the next three
years of production probably won't be an issue in the short-term but
will probably look like an ill-conceived piece of business a year
from now.
*Jaguar Mining (JAG.TO) issued a press release on Friday that, for
all intents and purposes, states that the company is bankrupt and
will be reorganised to enable bondholders to recoup part of their
investment. Shareholders will likely end up with nothing.
This is not exactly shocking news. If gold had continued the upward
trend from its late-June low and made it back to the $1500s then JAG
probably would have survived, in which case JAG's equity value would
have rebounded sharply due to the company's extreme leverage.
However, gold dropped back to $1300 and with no end in sight to the
operating losses the company's debt burden became impossible to
manage.
Prior to last Friday's news the company's market cap was only $16M,
so the equity value was already close to zero. The stock has a small
amount of option value in that the proposed reorganisation hasn't
yet been approved, but there is no longer a realistic chance of a
meaningful recovery. Even a large gold rally probably wouldn't help
JAG shareholders at this stage.
With there no longer being a realistic chance of a meaningful
recovery, JAG has been removed from the TSI List for a near-total
loss.
*Lydian International (LYD.TO) announced that Tim Coughlin, the
current CEO, will be stepping down at the end of this year, allowing
two months for a replacement CEO to be found and oriented.
This news is negative, but probably not in a big way. A lot will
obviously depend on who the replacement happens to be.
*Pilot Gold (PLG.TO) reported the results of the first 13 holes
drilled at the K2 prospect (part of the TV Tower project in Turkey).
The initial drilling found what the company was looking for and
expected to find, which is shallow, low-grade oxidised gold over
decent widths. For example, 1.35 g/t Au over 45 metres in one hole
and 0.60 g/t Au over 81.0 metres in another hole.
These initial results suggest the possibility that the K2 prospect
is similar to the nearby 2M-ounce Agi Dagi deposit owned by Alamos
Gold.
At this stage of development it seems that the TV Tower project
hosts at least three precious-metals deposits with the potential to
be economically viable. There's a high-grade gold zone at the KCD
target, a shallow silver zone that overlays the high-grade gold zone
at the KCD target, and a shallow low-grade oxidised gold zone at the
K2 target. Pilot Gold also owns the Halilaga porphyry-style
copper-gold project in Turkey and the Kinsley Mountain gold project
in Nevada, both of which have the potential to be economically
viable. In other words, PLG has several high-potential 'irons in the
fire'.
*Premier Gold (PG.TO) announced an updated resource estimate for
the Hardrock deposit, the largest deposit at the company's
Trans-Canada (TC) gold project.
Hardrock previously (based on the 2012 resource estimate) had 2.77M
ounces of M&I gold plus 3.37M ounces of Inferred gold. Of this total
6.14M-oz resource, 2.21M ounces were defined as open-pit (O-P) and
the remainder as underground.
The new resource for the Hardrock deposit has 3.24M ounces of M&I
gold plus 3.78M ounces of Inferred gold. Of this total 7.02M-oz
resource, 3.21M ounces are defined as O-P. This means that there has
been an increase of about 1M ounces in the total resource and that
virtually all of this increase is in the O-P category. (Note: The
global resource for the TC project is now 8.65M ounces.)
This is good news. Furthermore, an additional upward revision of the
resource is expected in Q1-2014 to incorporate the results of
43,000m of drilling that is scheduled to take place between the
cutoff date of the abovementioned resource estimate (9th August) and
year-end. A PEA will also be delivered in Q1-2014.
*Pretium Resources (PVG) reported the final results for the
underground drilling associated with the Valley of the Kings (VOK)
Bulk Sample Program (BSP) during the week before last, but results
from exploration drilling are still coming through. As is the norm
for the VOK deposit, the latest results included multiple narrow
(0.5m) intercepts grading more than 1,000-g/t.
PVG also reported on the progress of the bulk sample milling and
analysis. We had been expecting PVG to report the results of milling
the 10,000-tonne bulk sample periodically as the milling of each
cross-cut was completed, but last week's press release indicated
that the milling results would be reported in one fell swoop after
all testwork is complete. This probably means that there won't be
major market-moving news from PVG until at least mid-December.
*Volta Resources (VTR.TO) has received a takeover offer from B2
Gold (BTO.TO, BTG). The offer is 0.15 of a BTO share for every VTR
share, which valued VTR shares at C$0.42 based on the latest price
at the time the offer was announced and values VTR shares at C$0.37
based on BTO's closing price last Friday.
Although this offer is very low considering that VTR was trading
above C$1 at this time two years ago and that it values VTR's 5M-oz
Kiaka gold project (Burkina Faso) at only about $10/oz, it
represents a premium of about 100% to VTR's market price immediately
prior to the offer. The astute managers of BTO are effectively
saying that VTR is good value at double the price at which
less-informed traders were recently willing to sell the stock.
Due to BTO's all-stock takeover bid, from now on the price of VTR
shares will move up and down with the price of BTO shares. If you
own VTR it will therefore make sense to continue holding it if you
are very bullish on BTO. However, if you either aren't very bullish
on BTO or don't know much about BTO, it will make sense for you to
sell.
BTO is a well-managed company with a strong balance sheet and a
decent mix of assets, but its stock is expensive relative to the
stocks of many other profitable gold producers. Due to its
relatively high valuation, we don't want to own BTO at its current
price. Consequently, we have removed VTR from the TSI List and
recorded a loss of around 50% (worse than it should have been, but
not as bad as it could have been).
BTO's decision to buy VTR at a 100% premium to the market price is
in indication of the extent to which many junior gold miners are
being under-valued by the stock market. Interestingly, however, the
takeover bid for VTR didn't provoke significant speculation in other
exploration-stage gold miners operating in West Africa. Takeover
candidates in this region include Asanko Gold (AKG), PMI Gold (PMV.TO)
and Roxgold (ROG.V).
 Exiting
short-term gold stock positions Exiting
short-term gold stock positions
Shortly after the mid-October low for the gold sector we added short-term
positions in GDXJ and GFI to the TSI Stocks List. Due to the uncertainty created
by last week's price action we are exiting these positions at slightly worse
than break-even (a loss of 1-2%).
 Candidates
for new buying Candidates
for new buying
From within the ranks of TSI stock selections, below is a list of the best
candidates for new buying at this time. Note that for this list of 'best buys'
to be useful we must limit it to 5 stocks or less. This could involve not
mentioning stocks that offer excellent value and are good -- but not among the
best few -- candidates for new buying. Note as well that the stocks included in
this list of 'best buys' do not necessarily offer the best value. In the current
market environment we are placing more emphasis than usual on risk, meaning that
we could view a more expensive stock as a better candidate for new buying due to
its lower risk.
Due to our focus on risk, this week's list contains only two stocks. As well as
being 'oversold' and offering excellent value, these companies have relatively
low risk by virtue of being very profitable at the current gold price.
1) EDV.TO/EVR.AX (last Friday's closing price: C$0.61)
2) RIO.TO/RIOM (last Friday's closing price: C$1.65/US$1.60)
Chart Sources
Charts appearing in today's commentary
are courtesy of:
http://stockcharts.com/index.html
http://www.decisionpoint.com/

|

