


--
Weekly Market Update for the Week Commencing
4th November 2019
Copyright
Reminder
The commentaries that appear at TSI
may not be distributed, in full or in part, without our written permission.
In particular, please note that the posting of extracts from TSI commentaries
at other web sites or providing links to TSI commentaries at other web
sites (for example, at discussion boards) without our written permission
is prohibited.
We reserve the right to immediately
terminate the subscription of any TSI subscriber who distributes the TSI
commentaries without our written permission.
True
Fundamentals Summary
[Notes:
1) The date shown next to the current True Fundamentals Model (TFM) signal is
when the most recent change occurred. 2) Charts of the Gold and Equity
TFMs are included in the "Charts and Indicators" section of the TSI web
site]
|
Market |
True Fundamentals Model (TFM) |
|
Gold (US$ Price) |
Bullish (04 Oct 2019) |
|
US Equity (SPX) |
Bearish (04 Oct 2019) |
|
Currency (Dollar Index) |
Neutral (15 Mar 2019) |
|
Commodities (GNX) |
Bearish (01 Jun 2018) |
Last week's posts at the TSI Blog
There were no blog posts last week.
Summary of current
thinking/positioning
1) The Dollar Index (DX)
confirmed a short-term reversal to the downside four weeks ago, but must
end a week below 96 to confirm an intermediate-term reversal to the
downside. We are anticipating such a reversal, but we are uncertain as to
whether it will happen in the near future or during the first half of next
year.
2) The US$ gold price, the US$ silver price and the
gold-mining indices appear to have ended their corrections and embarked on
short-term upward trends that probably will result in new multi-year highs
within the next three months.
3) The Fed's new asset monetisation
program has increased the risk for bearish stock-market speculators and
clear signs of equity strength have started to emerge outside the US.
However, the senior US stock indices probably will reach short-term tops
during the first half of November.
4) There is a realistic chance
that the T-Bond will trade below its September low before bottoming on a
short-term basis, but we expect that major price weakness (yield strength)
in the Treasury market will be postponed until next year.
5)
Industrial commodities such as oil and copper could be in the process of
bottoming, but we expect that meaningful price strength won't show up
until next year.
6) We are holding a cash reserve of 25%-30%.
The Monthly
Closing Prices
At around this time every month
we review some of the most important (from our perspective) monthly
charts. We do this because monthly closing prices can confirm or deny
intermediate-term trend changes. For October-2019 we'll review the monthly
closes for gold, the Gold Miners ETF (GDX) and the S&P500 Index (SPX).
Regarding gold, this is part of what we wrote a month ago:
"...critical
monthly-closing support for gold's intermediate-term upward trend is
defined by the 8-month MA. That is, a monthly close below the 8-month MA
would confirm that an intermediate-term top (a top that holds 6-12 months)
is in place. This MA is now at $1383 and should rise to about $1400 by the
end of this month.
At this time we do NOT expect a monthly close
below the 8-month MA."
The following monthly chart shows that
the US$ gold price didn't come anywhere near its 8-month MA during October
and that at the end of the month this MA was at $1408. The MA is
continuing to rise, should reach $1450 by the end of November and should
not be breached on a monthly closing basis anytime soon.
Monthly
resistance lies at $1570. A monthly close above this resistance would
point to an upcoming test of the 2011 major peak, but let's not get ahead
of ourselves.
Shorter-term charts suggest that gold has completed
a 1-2 month correction. If so, a rally lasting at least three months has
begun and this rally should at least result in an intra-month spike above
$1570.
GDX tested its 2016 high at the beginning of September and then
reversed downward. As is the case with gold, it appears to have completed
a 1-2 month correction.
Monthly-closing support for GDX's
intermediate-term upward trend is now defined by the October-2019 low of
$26.18. However, there should be warnings in daily and weekly charts that
the intermediate-term upward trend is over well before such a reversal is
signaled by the monthly chart.
At this stage it's reasonable to
expect that GDX will trade above its 2016 high before topping on an
intermediate-term basis.
The SPX's price action during the period since September-2018 still
looks similar to the price action that followed the intermediate-term top
in 2011. The similar periods are indicated by the red boxes drawn on the
following monthly chart.
For the similarity to be maintained, the
12-month MA should not be breached on a monthly closing basis for a long
time to come. Although this not what we expect, we are not prepared to
rule out this possibility.
A monthly close below the 12-month MA
would be the first clear sign on the monthly chart that the bull market is
over.
US Recession
Watch
Our favourite leading indicators
of US recession are the ISM New Orders Index (NOI), Real Gross Private
Domestic Investment (RGPDI) and the yield curve.
Two months ago the
NOI became the first of the above-mentioned leading indicators to issue a
recession warning, meaning that the monthly NOI for August-2019 was below
the red demarcation line drawn on the following chart. The NOI remained
below the demarcation line in September.
The results of the latest
monthly ISM survey were published last Friday and revealed that in
October-2019 the NOI rebounded to slightly above the recession warning
level. However, this does not negate the earlier warning. It would take a
move to well above 50 to negate the warning.
There have been ten US
recessions since the early-1950s and for eight of these the time from the
NOI warning to the recession start was five months or less. The
August-2019 NOI signal therefore could be construed as a warning that a
recession will begin by January-2020. However, the NOI occasionally
generates a false signal. If the current NOI recession warning is valid
then it should be confirmed by our other favourite leading recession
indicators and also by an extension of its own downward trend within the
next few months, whereas if it is invalid it should be cancelled within
the next few months via a move to well above 50.
Note that over the
past 20 years there was only one false NOI recession signal. This was the
dip below the red line in March-April of 2003.
The latest quarterly RGPDI number (for Q3-2019) was published last
week. As illustrated below, RGPDI made a new all-time high in Q1 of this
year and turned down in Q2. The Q3 number was slightly below the Q2
number, thus increasing the probability that a trend reversal has
occurred.
A trend reversal in RGPDI from a Q1-2019 high would be
consistent with a recession getting underway in the final quarter of 2019
or the first half of 2020.
Note that the vertical red lines on the
following chart mark the starts of the last two official US recessions.
Finally there is the yield curve, which generates a recession warning
when it 'flattens' to an extreme (usually but not necessarily involving an
inversion) and then begins to steepen. A yield-curve reversal from
flattening to steepening was signaled last month (October-2019).
Consequently, all three of our favourite leading recession indicators have
now issued recession warnings. There is still some uncertainty, however,
because each of the warning signals is marginal at this time.
Based on the latest data, our rough estimates of recession start-time
probabilities are:
- Q4-2019: 30% (down from 35% a month
ago)
- H1-2020: 40% (not stated a month ago*)
-
H2-2020: 25% (not stated a month ago*)
- Later than 2020: 5%
(unchanged from a month ago).
Note that even if the US economy
doesn't slide into recession anytime soon, the weakness over the past
several months in the ISM NOI suggests that coincident indicators such as
industrial production will continue to deteriorate over the next few
months.
Also note that although the US economy has not been
officially in recession at any time over the past two years, the entire
period since H1-2018 could be viewed as an economic downturn. There has
been no growth in overall corporate profitability during this period, many
stock indices remain below their H1-2018 highs, and industrial production
has been declining since Q4-2018. This actually could be a positive as far
as the future is concerned, because it could mean that a downturn is in
its late stages rather than its early stages.
Finally, we can't
rule out the possibility that the Fed's attempts to extend the current
economic cycle will work. The reason is that unlike 2000 and 2007, this
time around the Fed has begun to pump money aggressively with the senior
stock indices at/near all-time highs. Due to the Fed's actions, this could
be more like 1998 or 2012 than 2001 or 2007.
*Last
month we indicated a 60% probability of a recession start sometime in
2020.
The Stock Market
During the week before last the
SPX broke above the top of its contracting triangle pattern. Last week it
went a step further by breaking into new all-time high territory.
Moreover, the upside breakout was confirmed by additional gains in the
NYSE Advance-Decline Line (ADL).
It isn't hard to find US stock indices that are yet to exceed last
year's highs. However, recently some of the lagging indices have shown
signs of strength. For example, although the NYSE Composite Index (NYA)
remains well below its January-2018 all-time high, last week it broke
above intermediate-term resistance defined by its September-2018 and
July-2019 highs.
Be aware, though, that last week's breakouts don't imply that
significant additional gains are in store. Instead, we explain below that
the market has reached a critical juncture that COULD lead to upward
acceleration over the coming several weeks, but more likely will lead to a
sell-off.
A week ago we wrote: "The [Fed's] new program has the
potential to extend the long-term equity bull market well into next year,
but there are two reasons, one technical and the other fundamental, to
believe that the market won't make much additional headway before
commencing its next significant correction.
The technical reason is
illustrated by the following weekly chart. The chart shows that over the
past 18 months the SPX has commenced a sizable multi-week decline soon
after making a new all-time high. If the pattern continues, the SPX won't
go higher than about 3070 before reversing course."
An updated
version of the same weekly chart is displayed below. Notice that last
week's gain took the SPX to the top of its 2-year broadening range.
Many traders will be drawing similar lines to the ones drawn on the
above chart. This means that there could be an immediate increase in
selling pressure and a downward reversal this week. It also opens up the
possibility that a solid break above the upward-sloping line on the chart
will lead to acceleration to the upside over the ensuing few weeks as a
large number of wrong-footed traders rush for the exit or shift from short
to long.
The most likely catalyst for the more bullish short-term
scenario is the signing of a US-China trade deal, but the Fed's money
pumping has been the root cause of the upward move of the past month and
would be the root cause of any meaningful price gains that happen within
the next few months.
At this stage we favour the more bearish
short-term possibility, which means that we expect a 1-3 month 'risk off'
trend to begin within the next couple of weeks without the SPX making
significant additional headway. As well as putting irresistible downward
pressure on the broad stock market, this trend probably would boost the
prices of gold, gold-mining stocks, T-Bonds and the Yen.
However,
although we have positions that will benefit from it, we aren't betting
heavily on the short-term 'risk off' scenario. In effect we are hedging
our bets, because the upward breakout scenario would boost the values of
our industrial-commodity-related equity positions.
This week's
significant US economic events
[Notes:
1) The most important events
(to the markets) are shown
in bold. 2) A list of global economic events can be found
HERE]
| Date |
Description |
|
Monday Nov-04 |
Factory Orders |
|
Tuesday Nov-05 |
International Trade Balance
ISM Non-Mfg Index |
|
Wednesday Nov-06 |
No important events scheduled |
|
Thursday Nov-07 |
Consumer Credit |
|
Friday Nov-08 |
Consumer Sentiment Index |
Gold and the Dollar
Gold and Gold Stocks
We are combining our Gold and Gold Stocks discussions today because they are
more inter-related than usual.
In the email sent to subscribers after the
close of US trading last Thursday, we wrote that Thursday's market action had
generated some persuasive evidence that the corrections in gold and gold mining
are over. Of particular significance:
1) The US$ gold price closed above
its short-term channel top and its 50-day MA.
This is illustrated below.
There was a small pullback on Friday that held the 50-day MA.
2)
Gold's upside breakout was confirmed by strength in the Yen (the major currency
that is most strongly correlated with gold).
The following chart
illustrates the strong positive correlation between the US$ gold price and the
Yen. The Yen had led gold at turning points since late last year, but it appears
that gold was the leader at the most recent turn. As shown more clearly in the
chart included in the Currency Market section of today's report, the Yen is yet
to confirm that a short-term bottom is in place; however, the Yen's 30th-31st
October turnaround from below the 200-day MA looks like the first step in a
trend reversal.

3) The HUI, GDX and GDXJ closed above their 50-day MAs.
The following
daily chart of the HUI shows Thursday's break above the 50-day MA and a trivial
pullback on Friday. GDX has been a little weaker than the HUI of late and ended
Friday's session exactly at its 50-day MA.
4)
The HUI/gold ratio continued to perform in a bullish manner.
As
illustrated below, the HUI/gold ratio bounced off its 150-day MA in the middle
of October and broke above its 40-day MA during the week before last. At this
point there was nothing to differentiate the rebound from a counter-trend move,
but the ratio then pulled back to its 40-day MA before rising to a new
multi-week high. As a result, the rebound from the mid-October low now looks
more like the start of an upward trend than a reaction within a downward trend.
We mentioned in the email that if the corrections have ended then they have
done so within the expected time-window, but at higher price levels than
originally expected. With regard to the HUI and GDX, we had expected that
200-day MA's would be tested before the correction was over. This would have
entailed the HUI dropping to the low-180s before resuming its intermediate-term
advance. With regard to gold bullion, we had expected that the price would fall
at least as far as support at $1450 and were prepared for a decline to as low as
the mid-$1300s.
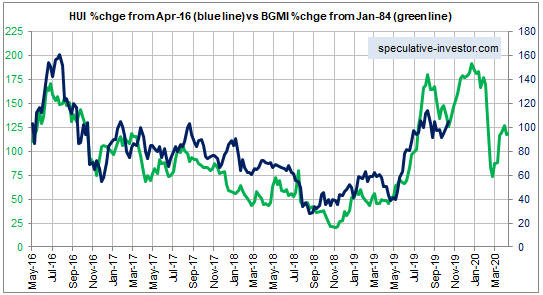
We also mentioned in the email that the recent upward
reversal in the gold-mining sector is roughly in line with the 1980s Model we've
been tracking. As illustrated below, this model suggests that the gold-mining
indices/ETFs will trend higher over the next three months.
By the way,
the spectacular plunge in the green line on the following chart is the 1987
stock market crash. In October of 1987 the gold mining sector crashed with the
stock market while the gold price rose, thus highlighting a major difference
between gold-mining stocks and gold bullion. The latter is a safe haven in times
of extreme turmoil/trouble, the former is not.
Unless the broad US stock
market starts to form a crash pattern before year-end, the current market should
start to diverge from the 1980s path early next year.
Something we've been harping on is that there has not been a proper
sentiment reset in the gold market. In fact, due to a surge in open interest
last Thursday it's possible that the total speculative net-long position in
Comex gold futures has returned to the vicinity of its September-2019 all-time
high. The lack of a sentiment reset means that the short-term risk is higher
than we would prefer, even though a rally to new multi-year price highs appears
to be underway.
The most reasonable assumption is that rallies to new
multi-year price highs have begun in both the bullion market (silver and
platinum as well as gold) and the associated mining indices/ETFs. If so, it's
likely that downward corrections will be limited by 20-day MAs. Therefore,
pullbacks to near 20-day MAs by the US$ gold price, the HUI and/or GDX should be
viewed as short-term buying opportunities.
The Currency Market
The Dollar Index (DX) ended last week slightly below its 200-day MA. This is
a downside breakout of sorts, but more important support is defined by the
channel bottom and lies about one point lower. Another test of the channel
bottom appears to be in store and could occur as soon as this week.
To
get a sustained break below the channel bottom the dollar's "true fundamentals"
will have to turn bearish. This will require additional strength in European
equities relative to US equities.
Our view at this time is that a 1-2
year period of US$ weakness either has begun already or will begin within the
next few months.
We
have been getting increasingly bullish about the Yen's short-term and
intermediate-term prospects, but prior to the past three trading days there was
no evidence that the currency had completed its downward correction. Preliminary
evidence that a short-term bottom is in place emerged during the second half of
last week.
The following daily chart shows that:
a) The Yen spiked
below its 200-day MA and an important lateral support level last Wednesday, but
recovered to end the day above support.
b) After recovering from below
support on Wednesday, the Yen gapped higher on Thursday.
c) There was a
pullback on Friday that left the bulk of Thursday's gain in place.
This
price action could have marked a trend reversal, but even if it didn't we expect
that a multi-month bottom will be put in place within the next two weeks due to
a downward reversal in the stock market and an associated shift away from risk.
As explained in last week's Interim Update, although the Yen is not a safe haven
it often trades like one because Yen carry trades tend to get closed en-masse
when economic and/or financial-market risk is perceived to be on the rise.
It would be reasonable to buy CurrencyShares Japanese Yen (FXY), a daily
chart of which is displayed below, for a short-term or an intermediate-term
trade with the Yen in the 92.0-92.5 range. To manage risk, an initial stop could
be placed slightly below last week's low.
As noted later in today's
report, our short-term bullish outlook for the Yen will be reflected in the TSI
List via an FXY call option.
The
Australian dollar (A$) has moved up to slightly below its 200-day MA. This is
interesting, because the following chart shows that every significant rebound in
the A$ since March of last year has ended at or slightly below the 200-day MA.
This means that for the A$ it's time to fish or cut bait. Will the current
rebound be the one that morphs into an intermediate-term upward trend, or are we
about to get another rally failure at/near the 200-day MA?
We
are neutral with regard to the A$'s short-term prospects and bullish with regard
to the A$'s 1-2 year prospects.
Updates
on Stock Selections
Notes: 1) To review the complete list of current TSI stock selections, logon at
http://www.speculative-investor.com/new/market_logon.asp
and then click on "Stock Selections" in the menu. When at the Stock
Selections page, click on a stock's symbol to bring-up an archive of
our comments on the stock in question. 2) The Small Stock Watch List is
located at http://www.speculative-investor.com/new/smallstockwatch.html
 Company
news/developments for the week ending Friday 1st November 2019:
Company
news/developments for the week ending Friday 1st November 2019:
[Note: AISC = All-In Sustaining Cost, EBITDA = Earnings Before Interest, Tax,
Depreciation and Amortisation (a measure of cash flow), EV = Enterprise Value or
Electric Vehicle, FS = Feasibility Study, FY = Financial Year, IRR = Internal
Rate of Return, ISR = In-Situ Recovery, JV = Joint Venture, MD&A = Management
Discussion and Analysis, M&I = Measured and Indicated, NAV = Net Asset Value,
NPV(X%) = Net Present Value using a discount rate of X%, NSR = Net Smelter
Return or Net Smelter Royalty, P&P = Proven and Probable, PEA = Preliminary
Economic Assessment, PFS = Pre-Feasibility Study]
*Africa
Oil (AOI.TO): At around this time last year AOI announced that it owned
25% of a consortium that had agreed to buy 50% of Petrobras Oil and Gas B.V.
(POGBV) for US$1.407B. This was a huge deal for AOI at the time, but the deal
has just become much bigger. Four times bigger, to be specific. The reason is
that prior to the start of trading last Friday AOI announced that its consortium
partners have pulled out and that AOI will be the sole acquirer of the 50%
interest in POGBV for US$1.407B.
POGBV owns 8% and 16% interests in
offshore Nigerian oil fields operated by Chevron and Total. At the time of the
original deal the combined production of these fields was 368K barrels/day (b/d)
and expected production within 12 months was 568K b/d, so we assume -- given
that there has been no new information -- that the production rate is now about
568K b/d.
POGBV's share of this production was 47K b/d in 2017 and should
now be about 79K b/d. Given that AOI will own 50% of POGBV, this implies that
AOI will have production of about 40K b/d after the deal is completed. The
reported production cost 12 months ago was only $10/barrel, so this should be
very profitable production at the current oil price.
At an oil price of
US$55/barrel, 40K b/d of oil production results in annual revenue of around
US$770M. And based on the reported production cost, this could result in a gross
margin of at least US$400M. That's massive for a company with a current market
cap of only US$415M.
The biggest question right now is: How will AOI
finance the purchase?
The company has about US$300M of cash and has just
arranged a US$250M bridge loan facility with BTG Pactual (the owner of the other
50% of POGBV). According to AOI's press release, "the bridge loan together
with the available cash provide the necessary funds for the company to cover its
POGBV deal completion payments and 2020 budget." This suggests to us that
the purchase involves staged payments.
We are surprised that there was
minimal reaction in the stock market to AOI's news. Trading volume was higher
than average on Friday, but the price was unchanged. In our opinion the news is
very positive and justifies an upward re-rating of the stock.
*Jervois
Mining (JRV.AX, JRV.V), an exploration/development-stage miner that
offers exposure to cobalt and nickel, issued its quarterly report for the
September-2019 quarter. The report contained no new information of significance.
JRV is well financed, with no debt and about A$17M of cash following the
recent receipt of A$3M for the sale of a gold royalty. We expect that the next
major milestones for the company will be the completion of the updated FS for
the Idaho Cobalt Operation (ICO) and the completion of a scoping study regarding
the construction of a refinery at the ICO. These are both due in Q1-2020. In the
meantime there will be drilling results from the ICO and the company's
early-stage exploration prospects in Uganda.
*Mineral
Resources (MIN.AX) announced that the "Albemarle transaction" has
overcome its final regulatory hurdle (approval from Australia's Foreign
Investment Review Board) and is now complete. The transaction involves the sale
to Albemarle Corporation (NYSE: ALB) of 60% of the Wodgina Lithium Project
(leaving MIN with 40%) in exchange for US$820M (A$1,188M at the current exchange
rate) in cash plus the transfer to MIN of a 40% interest in the first two 25,000
dry-tonnes-per-annum lithium hydroxide conversion units currently being built by
Albemarle in Kemerton, Western Australia. Regarding the Kemerton units MIN is
free-carried to production, which is expected in 2021.
This is very good
news.
MIN subsequently announced that the MIN-ALB JV had placed the
Wodgina project on care and maintenance pending a recovery in the lithium price.
This does not affect MIN's 2020 financial guidance.
The lithium market
became over-supplied during 2017-2018 as miners aggressively increased
production in reaction to a large price rise during 2016-2017, leading to a
major downward trend in the price during 2018-2019. The price is still being
weighed down by excess supply and there is no turnaround in sight, but we expect
that increasing demand from the Electric Vehicle industry will cause the
supply-demand situation to become price-supportive within 12 months.
MIN
is positioned to benefit in a big way from an eventual recovery in the lithium
market, but thanks to its mining services and iron-ore businesses it doesn't
need a higher lithium price to be profitable. Consequently, we continue to
believe that MIN is the safest way to obtain long-term exposure to lithium.
Our intermediate-term valuation-based target is A$20/share, which is about
40% above the current price.
*Premier Gold (PG.TO)
reported two pieces of good news related to the South Arturo gold project in
Nevada. This project is a JV between PG (40%) and Nevada Gold Mines (the
Barrick-Newmont JV). The PG-NGM JV has been developing two new mines at South
Arturo -- the El Nino underground mine and the Phase 1 open pit.
The
first piece of good news is that El Nino has achieved commercial production on
budget and well ahead of schedule. Consequently, this mine will contribute
significantly more than planned to PG's 2019 gold production. The Phase 1 pit
remains on track for production next year.
The second piece of good news
is that drilling at El Nino and at the Phase 3 pit (a future development)
returned exceptional intercepts, including 24.4 m of 20.60 g/t Au, 50.3 m of
6.36 g/t Au, 39.6 m of 8.75 g/t and 32.0 m of 10.09 g/t Au at El Nino, and 112.8
m of 7.29 g/t Au and 62.5 m of 7.93 g/t Au at Phase 3. These results indicate
the potential for very high-margin gold production.
Separately, PG
reported 14.5K ounces of gold production during the September quarter from its
Mercedes mine in Mexico. This was a disappointing below-plan result as the mine
continues to struggle with lower-than-expected grades.
Due to having
several 'irons in the fire', including current production from two mines, PG is
a relatively low-risk stock to average into for exposure to gold.
List
of candidates for new buying
From within the ranks of TSI stock
selections the best candidates for new buying at this time, listed in
alphabetical order, are:
1) AOI (last Friday's closing price: C$1.16)
2) JRV.AX, JRV.V (last Friday's closing price: A$0.20, C$0.19)
3) OIH
(last Friday's closing price: US$11.71)
4) PG.TO on a pullback to the
low-C$2 area (last Friday's closing price: C$2.22)
5) SBB.TO on a
pullback to the mid-C$1.60s (last Friday's closing price: C$1.76)
The
above list is limited to five stocks. It sometimes will contain less than five,
but it never will contain more than five regardless of how many stocks are
attractively priced for new buying.
Option
Trades
1) GDX 15-November-2019 $27.00
Put Option
The above put option was added to the TSI List on 24th
September in anticipation of a correction-ending plunge to the 200-day MA. The
potential for such an outcome has not been totally eliminated, but it very much
looks like the gold-sector correction is over and a new multi-month upward trend
has kicked off. Therefore, although for hedging purposes it could make sense to
retain this position for at least a few more days, the put option is no longer a
valid speculation and has been removed from the TSI List. It will go into the
record books as a loss of about 64% and will thus cut into the 428% profit
achieved on the GDX put option exited in September.
2)
FXY (CurrencyShares Yen) January-2020 $90.00 Call
Option
Further to the comment earlier in today's report, our
short-term bullish outlook for the Yen will be reflected in the TSI List via the
addition of the above FXY call option. The last trade for this option was
US$0.40 and it ended last Friday's session with a bid-ask spread of $0.35-$0.45,
so we will use $0.40 as our starting price for record purposes.
This is a
risk-off play, not an anti-US$ play.
Chart Sources
Charts appearing in today's commentary
are courtesy of:
https://stockcharts.com/
