|
-- Weekly Market Update for the Week Commencing 4th December 2006
Big Picture
View
Here is a summary of our big picture
view of the markets. Note that our short-term views may differ from our
big picture view.
Bonds commenced a secular BEAR market in
June of 2003. (Last
update: 22 August 2005)
The stock market, as represented by the S&P500 Index, commenced a secular BEAR market during the first quarter of 2000. The rally
that
began in October of 2002 will end during the first half of 2007. The ultimate bottom of
the secular bear market won't occur until the next decade. (Last update: 02 October 2006)
The Dollar commenced a secular BEAR market during the final quarter of 2000. The
first major downward leg in this bear market ended during the first
quarter of 2005, but a long-term bottom won't occur until 2008-2010. (Last update: 28 March 2005)
Gold commenced a
secular bull market relative to all fiat currencies, the CRB Index,
bonds and most stock market indices during 1999-2001. The first major
upward leg in this secular bull market ended in December of 2003, but a
long-term peak won't occur until at least 2008-2010. (Last update: 13
February 2006)
Commodities, as
represented
by the CRB Index, commenced a secular BULL market in 2001. The first
major upward leg in this bull market will end during the first quarter of
2006, but a long-term
peak won't occur until at least 2008-2010. (Last update: 13 February 2006)
Copyright
Reminder
The commentaries that appear at TSI
may not be distributed, in full or in part, without our written permission.
In particular, please note that the posting of extracts from TSI commentaries
at other web sites or providing links to TSI commentaries at other web
sites (for example, at discussion boards) without our written permission
is prohibited.
We reserve the right to immediately
terminate the subscription of any TSI subscriber who distributes the TSI
commentaries without our written permission.
Outlook Summary
Market
|
Short-Term
(0-3 month)
|
Intermediate-Term
(3-12 month)
|
Long-Term
(1-5 Year)
|
Gold
|
Bullish
(04-Oct-06)
|
Neutral
(08-Mar-06)
|
Bullish
|
US$ (Dollar Index)
|
Bearish
(20-Nov-06)
| Bullish
(31-May-04)
|
Bearish
|
Bonds (US T-Bond)
|
Bearish
(04-Sep-06)
|
Neutral
(23-Aug-06)
|
Bearish
|
Stock Market (S&P500)
|
Bearish
(27-Nov-06)
|
Neutral
(02-Oct-06)
|
Bearish
|
Gold Stocks (HUI)
|
Bullish
(04-Oct-06)
|
Neutral
(08-Mar-06)
|
Bullish
|
| Oil | Bullish
(04-Oct-06)
| Neutral
(25-Sep-06)
| Bullish
|
Industrial Metals (GYX)
| Bearish
(13-Nov-06)
| Bearish
(25-Sep-06)
| Bullish
|
Notes:
1. In those cases where we have been able to identify the commentary in
which the most recent outlook change occurred we've put the date of the
commentary below the current outlook.
2. "Neutral", in the above table, means that we either don't have a
firm opinion on which way the market will move or that we expect the
market to be trendless during the timeframe in question.
3. Long-term views are determined almost completely by fundamentals,
intermediate-term views by giving an approximately equal weighting to
fundmental and technical factors, and short-term views almost
completely by technicals.
Natural Gas Cycles
...a
short-term peak is probably already in place or will be put in place in
the very near future, after which there will be a 1-2 month pullback
that results in a successful test of September's low.
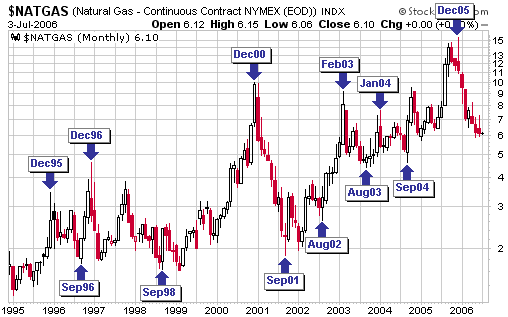
Based on historical natural gas (NG) price cycles we began to
anticipate an August-September bottom for this market as early as
March. Here's how we summarised NG's cyclical/seasonal tendencies in
the 5th July Interim Update:
"We've endeavoured to
show, via the following monthly chart, that natural gas has a strong
tendency to peak during December-February (usually December) and bottom
during August-September (usually September). In fact, not counting the
most recent peak in December of 2005 there have, over the past 10
years, been 5 intermediate-term peaks during the December-February
period and with one exception (1997) each of these peaks was followed
by an intermediate-term bottom during the ensuing August-September
period.
Therefore, with
December-2005 having provided us with an intermediate-term peak the
odds are clearly in favour of natural gas making an intermediate-term
bottom in either August or September of this year, with September being
the more likely candidate."
An intermediate-term
bottom ended up being put in place in line with the anticipated
schedule (the NG price bottomed in late September), with the rally from
this bottom to last week's intra-day peak achieving a gain of 125% on a
continuous contract basis and a gain of 22% in the January-2007 futures
contract. The weekly chart included below reflects the aforementioned
125% gain.
If NG continues to follow its typical cyclical pattern then a
short-term peak is probably already in place or will be put in place in
the very near future, after which there will be a 1-2 month pullback
that results in a successful test of September's low. For example and
with reference to the above chart, the Sep96 low was followed by a
Feb97 test of the low, the Sep98 low was followed by a Feb99 test of
the low, the Sep01 low was followed by a Jan02 test of the low, and the
Sep04 low was followed by a Jan05 test of the low.
Given that the volume of NG in storage in the US is still relatively
high there's a good chance that the typical cyclical pattern will
prevail over the coming months. That is, the odds favour a test of the
Sep06 low in January or February of 2007.
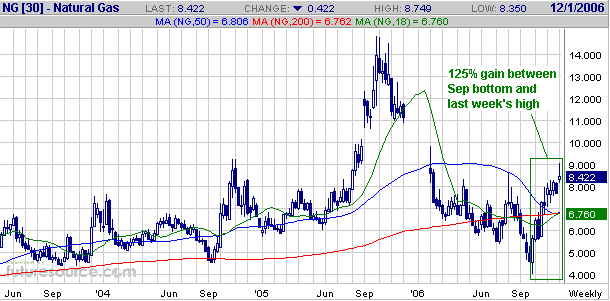
The NG price has
followed our script as closely as could reasonably be expected.
Unfortunately, though, the group of Canadian 'gassy' trusts that we
selected has definitely not behaved as anticipated, the problem being
that the Canadian Government got in the way of our best-laid plans by
proposing a change to tax regulations and thus greatly decreasing the
attractiveness of these trusts to many of the people who owned them.
As things currently stand we see three potential outcomes from our
foray into Canadian gas-focused energy trusts. The first is that the
natural gas price will do as well as we expect it to do over the coming
2 years (we expect the NG price to be back in double digits by 2008),
resulting in our energy trust investment doing well but not as well as
it would have done in the absence of the tax change. The second is that
the natural gas price will continue to be weighed down by abnormally
high inventory levels for another 1-2 years, resulting in our energy
trust investment faring poorly. The third is that the Canadian
Government will prevent new tax-exempt trusts from being formed but
will allow existing trusts to maintain their current structure,
resulting in our energy trust investment doing better than would
otherwise have been the case because the existing trusts would then
attract a scarcity premium.
We think the first of the above-described outcomes is by far the most likely.
The Broader Issue
The
Canadian Government's recent about-face on the tax treatment of income
trusts is indicative of the much broader issue that governments cannot
be trusted. As professional speculators we are always aware that our
plans could be jeopardised by unexpected government action, whether the
action be the blatant seizure of private property such as occurred
within the Bolivian oil industry earlier this year or the reneging on
promises that routinely happens in almost all countries. We
occasionally suffer a portfolio draw-down as a result of stealing or
rule-changing on the part of a government; but as we said, this is a
risk we are well aware of whenever we speculate and in those cases when
government action causes us to incur a loss we aren't required to alter
our overall approach to the markets. What we do is re-evaluate the
situation based on the new information and, depending on our assessment
of risk versus reward, either maintain our current
speculative/investment position or move on to pastures that look
greener.
However, most people are not professional speculators and they plan
their financial futures based on the rules as currently laid-out by the
government. They are therefore in the position where a government's
unexpected rule change or breach of promise could jeopardise their
financial security.
But while the government will sometimes do things that are totally
unforeseeable there are some government promises that we know, for
sure, are going to be broken; and if you know a promise is going to be
broken it will be irrational for you to base your plans on the
assumption that the promise will be kept. As an example, the
governments of most G7 countries have promised to provide future
retirees with benefits that will cost way more than these governments
will possibly be able to afford if taxation levels remain anywhere near
current levels. This means that taxation levels will be increased
and/or that promises not to tax certain types of accounts will be
broken and/or that the promised benefits will not be paid or that the
promised benefits will be paid in currency that has been massively
de-valued via inflation. The point is that we know these promises will
be broken, we just don't know exactly how they will be broken (although
it's a good bet that surreptitious default via inflation will feature
strongly). This means that anyone who plans to retire in, say, 20 years
time and live off the benefits currently being promised by his/her
government IS going to be disappointed.
When it comes to long-term financial planning we therefore think it
would be prudent for people to assume that they will get nothing of
real value from the government and that the currency of the realm will
lose its purchasing power at an accelerated rate.
Oil and Oil Stocks
Below are weekly charts of oil futures and the AMEX Oil Index (XOI). The blue line on each chart is the 50-week moving average.
A point we've made in the past is that large-cap oil shares, as
represented by the XOI, tend to reach major price peaks several months
AFTER a major peak in the oil price. To see an example of this type of
relative behaviour at important turning points we need go back no
further than the most recent major correction in the oil market (the
correction that began during the final four months of 2000).
With reference to the following charts, note that the oil price peaked
in September of 2000 whereas the XOI, after moving lower in sympathy
with the initial downward leg in the oil market, resumed its upward
trend as soon as the oil price stabilised at a lower level and went on
to make its ultimate high in May of 2001. In other words, during the
last major oil market correction there was a gap of around 8 months
between the peak in the oil price and the subsequent peak in the XOI.
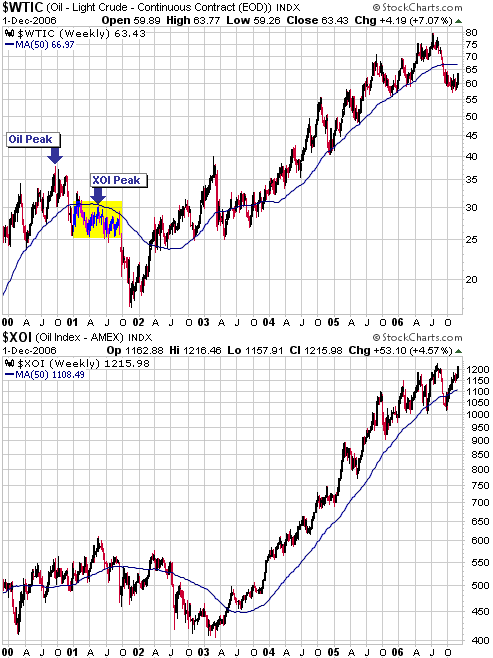
Lastly, notice that rebounds in the oil price during 2001 (the shaded
area on the above chart) ended at, or just above, the 50-week moving
average. Something similar this time around would result in oil moving
back to the high-60s within the coming few months, but no higher. This,
we think, is a reasonable expectation.
The Stock
Market
Warning Shots
We don't think an important top is yet in place in the US stock market
because the NDX/Dow ratio (a reliable leading indicator) hit new
multi-month highs as recently as the past two weeks and because
sentiment is yet to reach the sort of optimistic extreme that typically
coincides with a major top. However, we do think there's a good chance
of a major top being put in place within the next 3 months, in which
case we should already be seeing a few early warning shots.
The evidence at this time isn't substantive but we are, in fact, seeing
a few signs that a topping process is underway. Here are some examples:
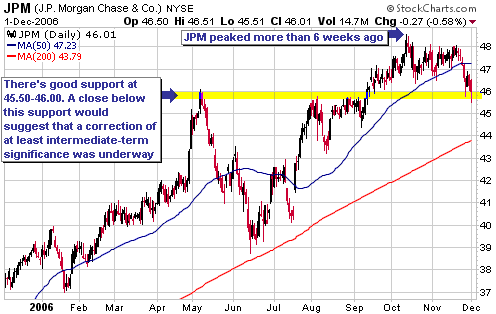
1. The financial sector was a leader to the upside between the second
half of June and the first half of October, but over the past 6 weeks
this sector has been relatively weak. Take a look, for instance, at the
way JP Morgan Chase (JPM) appears to be rolling over.
2. The major European
stock markets were relatively strong until around mid November, but
have since been relatively weak. This could be indicative of an
impending trend change.
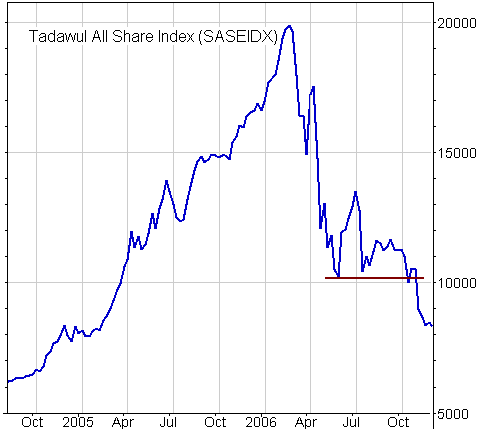
3. During the first half of this year the stock markets of the Middle
East were leaders to the downside, typically peaking about 3 months
ahead of the G7 stock markets.
After stabilising between May and October the Middle Eastern markets
have resumed their declines. In particular, the following weekly Fullermoney.com
chart shows that Saudi Arabia's Tadawul Index has broken sharply to the
downside over the past several weeks. As was the case during the first
half of this year, the Tadawul's breakdown could be a warning shot for
other stock markets.
4. Gold has been
strengthening relative to base metals since late October, a possible
sign that the sea of liquidity upon which stock markets have floated
upward is about to dry-up.
Like the man with a hammer who sees everything as a nail, perhaps we
are guilty of seeing topping signs simply because we are going out of
our way to look for them. This is a risk, but note that during a
secular bear market the potential cost of being too cautious is a lot
less than the potential cost of being too bullish.
Current Market Situation
A correction is underway in most stock markets. At this stage our
expectation is that this correction will last a few more weeks and be
followed by a final move to new highs in early-2007.
Below is a chart of Hong Kong's Hang Seng Index (HSI). Over the past 5
months -- a period during which the HSI has been a top performer --
pullbacks have ended at the 50-day moving average and/or the channel
bottom. The HSI will therefore need to make decisive breaks below its
channel bottom and its 50-DMA to signal that a larger-degree correction
is underway.

Spinning the housing downturn as a stock market positive
...the
whole idea that the Fed's next move will be to lower the official
interest rate deserves to be seriously questioned because it is based
on the assumption that inflation expectations will remain low.
The downturn in the US housing market is being spun as a stock market
positive on the basis that it will force the Fed to begin a
rate-cutting program and, as everyone knows, Fed rate cuts are bullish
for the stock market. Well, it's often the case that what everyone
knows is not worth knowing and that certainly applies here because Fed
rate cuts are often NOT bullish for the stock market.
When it comes to the setting of the Fed Funds Rate target the Fed will
usually just follow the market in that some time after the market
begins to lower short-term interest rates the Fed will start doing the
same. However, lower short-term interest rates definitely wouldn't be a
significant positive for a stock market priced in anticipation of
strong earnings growth if the downward move in interest rates was a
response to a sharp deterioration in the economic outlook.
In any case, the whole idea that the Fed's next move will be to lower
the official interest rate deserves to be seriously questioned because
it is based on the assumption that inflation expectations will remain
low. There are, however, conditions that have a reasonable chance of
arising over the coming months that would invalidate this assumption.
Before we mention what these conditions are it's important to
understand the Fed's greatest fear.
It is often said that the Fed fears deflation. This is true, but the
Fed's fear of deflation can be likened to your editor's fear of
swimming with Great White sharks. Your editor would be very fearful of
jumping into the water if he suspected that a Great White was lurking
below, but sharing a patch of water with a Great White is not something
he spends any time worrying about because it is something he can easily
avoid. It's the same story with the Fed and deflation. Deflation would
be a nightmare for the Fed, but Ben Bernanke will never spend much time
worrying about it because he knows he can easily avoid it.
What the Fed regularly does have to worry about is an out-of-control
surge in inflation expectations. The Fed can create money in unlimited
quantities at practically zero cost, but today's money continues to
have value because most people TRUST that it is going to do no worse
than lose its purchasing power at the rate of a few percent per year.
Or, to put it another way, the money is essentially worthless but as
long as most people BELIEVE that the money will decline towards
ultimate worthlessness at a slow pace it can continue to be a useful
medium of exchange.
The Fed and all other central banks face a problem, though, when a
critical mass of people begin to anticipate a rapid acceleration along
the road toward eventual worthlessness. If this happens then the Fed
will be at risk of losing its ability to keep the world's greatest
confidence game going, and it is this possibility, not the possibility
of deflation, that will keep a central banker awake at night.
We'll now return to our original discussion. There is a significant
chance that additional weakness in the housing market will prompt the
Fed to begin reducing the official short-term interest rate target
within the next few months, BUT ONLY IF inflation expectations happen
to be under control. On the other hand, if the gold price were
threatening to breakout to new multi-year highs then cutting interest
rates would likely be the last thing on the collective mind of the Fed.
This would be the case regardless of how weak the housing market
happened to be unless the rise in the gold price could reasonably be
attributed to something other than rising inflation expectations.
This week's
important US economic events
| Date |
Description |
Monday Dec 04
| No significant events scheduled
|
| Tuesday Dec 05
| Q3 Productivity
Factory Orders
ISM Services
| | Wednesday Dec 06 | No significant events scheduled
| | Thursday Dec 07
| Consumer Credit
| | Friday Dec 08
| Monthly Employment Report
|
Gold and
the Dollar
Currency Market Update
No US$ collapse on the horizon
The Dollar Index will probably test long-term support at 80 within the
next 4 weeks and as it approaches this support area the forecasts of an
impending dollar collapse will no doubt become more prevalent and more
brazen. However, there's little chance of the dollar ever collapsing
against the euro (the US$-euro exchange rate is more than 50% of the
Dollar Index, so a collapse in the Dollar Index would require a
collapse of the US$ against the euro) because in some important
respects the euro has even less going for it than the dollar.
Furthermore, there's almost no chance of the dollar collapsing against
the euro while the US$ has an interest rate advantage, as is the case
right now.
There is, though, a very high probability of the US$ eventually
collapsing against gold, but the probability of such a collapse
happening within the next 6 months is low because the Fed is still in
the position where it could quickly put a lid on inflation expectations
via moderately tighter monetary policy should the need arise.

Current Market Situation
Going into Friday's trading session the currency market looked
stretched and in need of a short break, but the recent trends (down in
the dollar, up in the major European currencies) continued in response
to some frighteningly-bad US economic news. When we say
"frighteningly-bad" we are, of course, being facetious because the
additional wave of dollar selling on Friday was prompted by news that
the Institute of Supply Management (ISM) Manufacturing Index printed
49.9, or just a smidgen below the expected 51. This difference between
the actual and expected numbers is insignificant, but it had a
significant psychological impact because an ISM Index reading of below
50 is widely accepted to mean that the US economy is shrinking.
Now, we have no problem with the idea that the US economy is shrinking.
In fact, if accurate estimates of real economic growth were available
we think they would show that the US economy has been shrinking since
the second quarter of this year. However, it is absurd to think of the
difference between an ISM Index of 51 and an ISM Index of 49.9 as
representing the difference between an expanding and a contracting
economy.
We'll tell you why, but first we'll quickly note that the ISM Index is
determined by surveying purchasing managers at around 300 industrial
companies across the nation and asking them questions like: "Are
business conditions improving?" A reading above 50 for the index would
mean that more than half the purchasing managers answered this question
with a "yes".
The ISM Index is actually one of the most useful coincident economic
indicators, but small changes in this index are irrelevant because of
the way it is calculated. From what we can gather, all that would have
to happen to change the reported index value from 51 to 49.9 would be
for approximately three purchasing managers to change their answers
from "business is improving" to "business is getting worse". In other
words, whether an economy with 300M people is considered to be
expanding or contracting supposedly ends up being determined by the
opinions of three guys.
Whether the ISM Index prints marginally above 50 or marginally below 50
is neither here nor there. What is of significance is that the index
has been trending lower for some time, but we doubt that the US economy
will deteriorate much more in the short-term. This is mainly because a)
the US economy probably won't get much weaker without some help from
abroad and leading indicators such as credit spreads suggest that
global economic growth will remain firm for at least a few more months,
and b) the US stock market probably wouldn't have been as strong as it
has been over the past two months if the US economy were about to
become considerably weaker in the immediate future (the stock market is
a leading indicator of the economy and seldom fails to turn down months
ahead of a serious economic decline).
Our take is that news such as Friday's ISM Index helps bolster the idea
that a weakening US economy will soon result in the elimination of the
dollar's interest rate advantage. This is the speculative theme de jour
in the currency market and speculators will milk this theme for all
it's worth in the same way they milked the "dollar is headed into the
toilet due to the expanding trade deficit" theme during the final two
months of 2004.
As was the case at the end of 2004, once speculative short positions in
the dollar have reached an extreme -- a likely occurrence within the
coming 4-6 weeks -- the stage will be set for another multi-month
advance in the US currency.
Gold
Our expectation has been, and continues to be, that gold will test its
May-2006 high during the early part of next year. There will no doubt
be pullbacks along the way, but the short-term trend should remain up
for at least another month.
From a fundamental/valuation perspective gold looks much better than
the base metals at this time. In particular, the gold price is
extremely low relative to the prices of most base metals and gold
stands to benefit if more evidence of an economic slowdown begins to
emerge. Gold also looks much better from a technical perspective in
that it has been gradually building-up strength over the past several
weeks whereas the base metals either look dangerously extended due to
recent almost-vertical climbs (zinc, nickel and lead) or appear to be
on the verge of breaking below support (copper).
Gold Stocks
The XAU has broken decisively above a downward-sloping trend-line, but
is now challenging the more important lateral resistance that lies at
150-155 (see chart below). We suspect that the gold sector will
continue to push higher into year-end, but wouldn't be surprised at all
if a brief pullback occurred prior to a resumption of the advance.
Support defined by the early November high (the low-140s for the XAU
and the low-340s for the HUI) should hold during any pullback that
begins from near current levels.

One reason we don't
expect a tradable decline to begin at this time is that many individual
gold stocks look strong, but are not yet close to being overbought. For
example, Gold Fields Ltd (NYSE: GFI) broke above a downward-sloping
trend-line last week, but has only just begun to rally and is still
quite close to long-term support. Also, Royal Gold (NYSE: RGLD), a
stock that is way too richly valued for our liking but one that we pay
attention to because it is often a leader at important turning points,
has only just broken above lateral resistance at $31 (see chart below)
and is likely to find support at this former resistance during any
near-term pullback.
Update
on Stock Selections
(Note: To review the complete list of current TSI stock selections, logon at http://www.speculative-investor.com/new/market_logon.asp
and then click on "Stock Selections" in the menu. When at the Stock
Selections page, click on a stock's symbol to bring-up an archive of our comments on the stock in question)
 Nevsun Resources (TSX and AMEX: NSU). Shares: 114M issued, 143M fully diluted. Recent price: US$2.41/C$2.76 Nevsun Resources (TSX and AMEX: NSU). Shares: 114M issued, 143M fully diluted. Recent price: US$2.41/C$2.76
NSU has dropped back to intermediate-term support (see chart below) and
is a good candidate for new buying near the current price. Significant
political risk must be taken into account due to the location of the
company's most valuable asset (the Bisha project in Eritrea), but the
stock's low valuation means that a large risk-related discount has
already been applied.
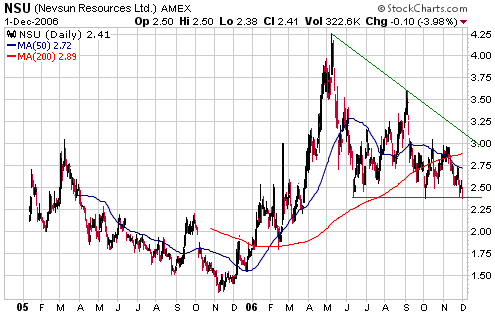
We consider NSU to be
a gold stock, but it has been trading more like a junior copper stock
over the past couple of months and hasn't participated at all in the
gold sector's rally. Bisha is more of a base metal project than a gold
project, but the plan is for almost 100% of Bisha's production to be
gold during its first two years of operation. Also, the company owns
the Tabakoto gold mine in Mali, a mine that has been designed to
produce gold at the rate of 100K ounces/year.
Two series of NSU warrants trade on the TSX, but in our opinion the
warrants are currently very expensive relative to the stock. For
example, the C$3.00 Oct-2008 warrants (TSX: NSU.WT.A) closed at C$1.00
on Friday, but by our calculations the fair value for these warrants
would be around C$0.75 with the stock at its current level.
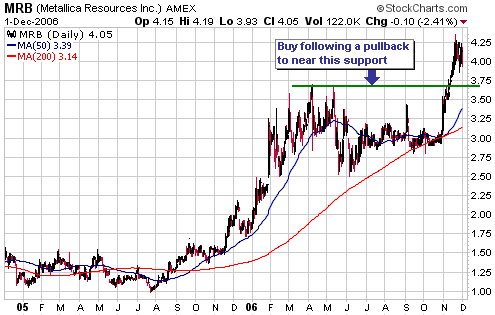
Metallica Resources (AMEX: MRB). Shares: 84M issued, 106M fully diluted. Recent price: US$4.05
Despite the gains it has made since late October, MRB still offers one
of the most attractive risk/reward ratios in the gold sector.
Technically (see chart below), the stock is consolidating following the
recent 40% surge in its price. Former resistance in the US$3.70s should
now provide good support and a pullback to this price area would, we
think, be a buying opportunity.
The C$3.10 December-2008 warrants (TSX: MR.WT) closed at C$2.03 on
Friday and would be suitable for new buying in the low-C1.80s.
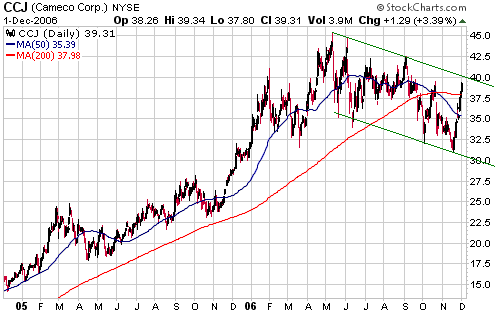
Cameco (NYSE: CCJ). Recent price: US$39.31
CCJ has only been in the TSI Stocks List for two weeks, but we are going to exit now for a quick 20% gain.
The stock was added to the List as a short-term trade based purely on
price action and by rebounding back to near the top of its channel (see
chart below) has done what we expected/hoped it would do, albeit in
quicker time.
Chart Sources
Charts appearing in today's commentary
are courtesy of:
http://stockcharts.com/index.html
http://www.futuresource.com/

|