![]()
![]()
![]()
![]()
-- Weekly Market Update for the Week Commencing 5th February 2018
Big Picture
View
Here is a summary of our big picture
view of the markets. Note that our short-term views may differ from our
big picture view.
The BULL market in US Treasury Bonds that began in the early 1980s ended in mid-2016, but there will be many years of topping action in bond prices and bottoming action in bond yields before major new trends get underway. A major decline in government bond prices will unfold during the 2020s. (Last update: 11 September 2017)
The stock market, as represented by the S&P500 Index, commenced a secular BEAR market during the first quarter of 2000, where "secular bear market" is defined as a long-term downward trend in valuations (P/E ratios, etc.), gold-denominated prices and inflation-adjusted prices. This secular trend will bottom in 2020 or later. (Last update: 11 September 2017)
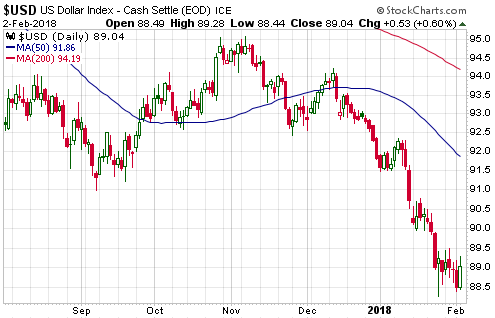
A cyclical BEAR market in the US Dollar began in 2016-2017. (Last update: 11 September 2017)
Gold commenced a secular bull market relative to all fiat currencies, the CRB Index, bonds and most stock market indices during 1999-2001. This secular trend will peak in 2020 or later. (Last update: 11 September 2017)
Commodities,
as represented by the CRB Index, commenced a
secular BULL market in 2001 in nominal dollar terms. The first major
upward leg in this bull market ended during the first half of 2008, but
a long-term peak won't occur until 2020 or later.
(Last
update: 11 September 2017)
Copyright
Reminder
The commentaries that appear at TSI
may not be distributed, in full or in part, without our written permission.
In particular, please note that the posting of extracts from TSI commentaries
at other web sites or providing links to TSI commentaries at other web
sites (for example, at discussion boards) without our written permission
is prohibited.
We reserve the right to immediately
terminate the subscription of any TSI subscriber who distributes the TSI
commentaries without our written permission.
True
Fundamentals Summary
[Notes:
1) The date shown next to the current True Fundamentals Model (TFM) signal is
when the most recent change occurred. 2) Charts of the Gold and Equity
TFMs are included in the "Charts and Indicators" section of the TSI web
site]
| Market | True Fundamentals Model (TFM) |
| Gold (US$ Price) | Bearish (12 Jan 2018) |
| US Equity (SPX) | Neutral (12 Jan 2018) |
| Currency (Dollar Index) | Bullish (15 Dec 2017) |
| Commodities (GNX) | Bullish (29 Dec 2017) |
Last week's posts at the TSI Blog
What everyone is missing about the US tax cuts
Summary of current
thinking/positioning
1) Thinking that the US$ gold
price will trend downward over the next several weeks but will go on to
make new highs for the year during the second quarter.
2) Still not
expecting anything more bearish than a normal (5%-10%) correction in the
US stock market, but recognising that short-term stock market risk will
ramp up if bond yields continue to rise.
3) Thinking that
industrial commodities such as oil and copper will make short-term price
highs during the first two months of 2018.
4) Expecting the Dollar
Index (DX) to rebound over the next few weeks.
5) Thinking that the
T-Bond will build on last week's downside breakout over the next few
months.
6) Holding a cash reserve of 25%-30% and looking for
opportunities to increase it.
T-Bond Breakdown
By far the most important
financial-market development over the past week was the downside breakout
in the 30-year T-Bond price illustrated by the following weekly chart. The
breakout was expected, although we thought it might wait until the second
quarter.
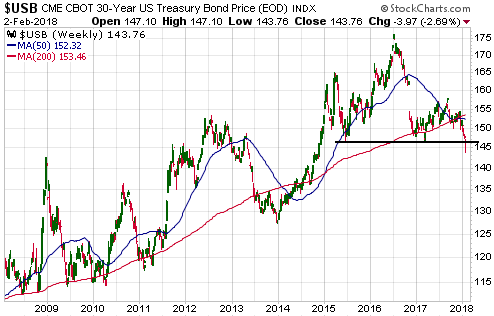
The T-Bond's weekly close below support at 146-147 completes a
multi-year topping pattern and projects more downside over the next few
months. There probably won't be a major T-Bond decline this year, but
there's a good chance of the T-Bond trading at least 10% below its current
price before reaching an intermediate-term bottom.
Last week's
downside breakout by the T-Bond price has far-reaching implications
because it is further evidence that the generational decline in interest
rates ended in 2016. That being said, the waters have been muddied by the
fact that the downside breakout in the T-Bond price has not been confirmed
by an upside breakout in the T-Bond yield (the 30-year interest rate). A
lot of market participants care more about the bond yield than the bond
price, and the following weekly chart shows that the bond yield has not
yet broken out to a new multi-year extreme.
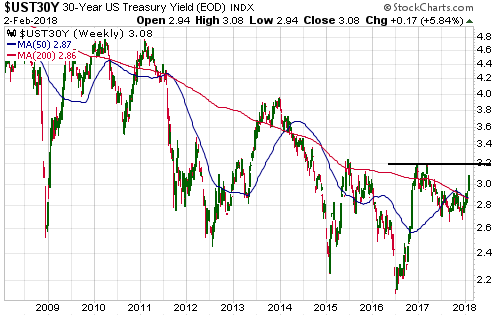
We are confident that a confirming upside breakout in the bond yield
is coming, if not in the next three weeks then in the next three months.
US Recession
Watch
The previous edition of our
monthly "US Recession Watch" feature was in the 3rd January Interim
Update. At that time we concluded:
"Taking into account the NOI
[New Orders Index] surge (bullish), the fact that the yield curve is still
in a flattening trend (bullish) and the decline in the monetary inflation
rate (bearish), we think that:
a) The probability that a US
recession will start in Q1-2018 is 0%.
b) The probability that a US
recession will start in Q2-2018 is 10%.
c) The probability that a
US recession will start in Q3-2018 is 30%.
d) The probability that
a US recession will start in Q4-2018 is 50%."
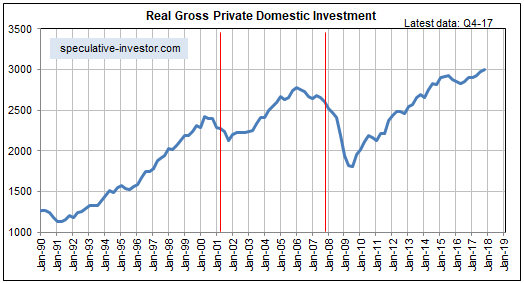
Considering
subsequent data, the probabilities haven't changed. In particular, the
latest iteration of the quarterly Real Gross Private Domestic Investment
(RGPDI) number was a new all-time high. Refer to the first of the
following charts for details. RGPDI tends to reverse downward at least 2
quarters prior to the start of a recession, so the fact that it made a new
high in Q4-2017 points to H2-2018 as the earliest time for the start of
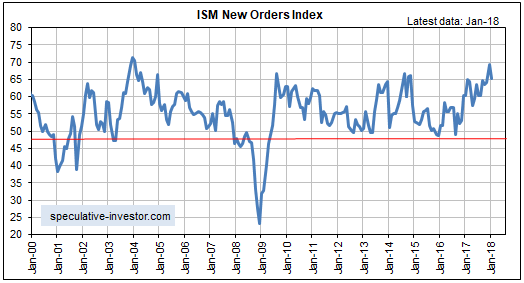
the next recession. Secondly, although the latest iteration of the monthly
ISM Manufacturing New Orders Index (NOI), which was reported on Thursday
1st February, was lower than the 13-year high achieved in the preceding
month, it was still near the top of its long-term range. Refer to the
second of the following charts for details. Thirdly, the yield curve is
not yet close to signaling a reversal from flattening to steepening. There
is little chance that a recession will begin prior to such a signal.
There is almost no chance of a recession beginning during the first
half of this year, but there's a high risk of a recession getting underway
before year-end. The reason is the slow rate of US monetary inflation.
It's likely that at some point within the next 12 months the 'bubble
ventures' that were incentivised by the rapid monetary inflation of
2009-2016 will begin to collapse.
Cryptomania
Update
Our most recent "Cryptomania
Update" was in the 22nd January Weekly Update, at which time we wrote:
"There's a good chance that within the next few weeks the Bitcoin
price will close below its 22nd December low, removing most of the
remaining doubt that the price top on 18th December (the day that futures
trading commenced on the CME and a week after futures trading commenced on
the CBOE) was the ultimate top. It just hasn't happened yet."
Last week the Bitcoin price closed below its 22nd December low. Therefore,
there is little remaining doubt that the price top on 18th December was
the ultimate top.
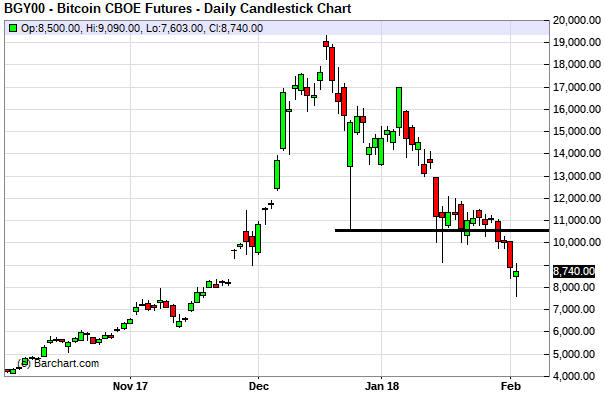
It's testament to the rapidity of last year's rally that the 60%
plunge of the past 6 weeks has done no more than take the price back to
where it was in November-2017. This means that every current holder of
Bitcoin who bought before November-2017 still has a substantial profit,
albeit nowhere near as substantial as it was several weeks ago.
Although the Bitcoin bubble has burst, the 'cryptocurrency' concept is not
going to die. Also, distributed ledger technology, the first successful
attempt at which is the "blockchain" developed for Bitcoin, looks set to
become extremely important in many industries over the years ahead.
The Stock Market
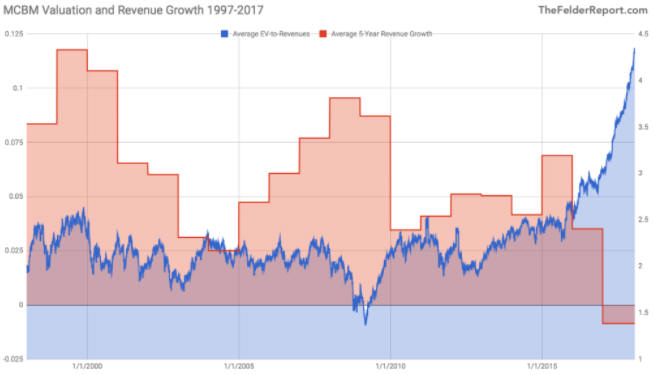
Mind-Boggling Valuation
We thought we understood the extent of the US stock market's
over-valuation, but we were wrong. The valuation-related information
contained in the article posted
HERE, which was sent to us by a friend, blew us away. The market
appears to be much more expensive than we thought.
The above-linked
article focuses on the combined valuation of four blue chip stocks:
McDonald's, Caterpillar, Boeing and 3M. Between 1997 and the end of 2015,
the price/revenue ratio of an index comprising these four stocks (MCBM)
oscillated between 1.5 and 2.5. Then, in 2016 the index broke out of this
range and now trades at almost twice the HIGHEST valuation of the
1997-2015 period.
Moreover, today's extraordinarily high valuation
for MCBM can't be explained by investors extrapolating unusually-fast
revenue growth. This is because the average 5-year revenue growth of MCBM
is at a 20-year low!
The following chart from the article
illustrates what we've described above. Notice the spectacular rise in
valuation (the blue line) in parallel with declining revenue growth (the
red line) over the past two years.
'Investors' are prepared to pay such high prices for the shares of
these large and relatively staid companies because in most cases they
aren't buying the shares directly. Instead, they are buying ETFs that hold
these shares and paying no attention to the valuations of the individual
stocks in the ETFs. As pointed out in the article, there are 32 ETFs that
count McDonald's among their top 15 holdings, 25 ETFs that count
Caterpillar among their top 15 holdings, 83 ETFs that overweight Boeing to
this degree and 44 ETFs that overweight 3M.
This is passive
investing run amuck. The stage is now set for conservative investors to
lose as much as aggressive investors, because ETFs that hold
supposedly-safe, blue-chip stocks are going to collapse in price during
the next bear market.
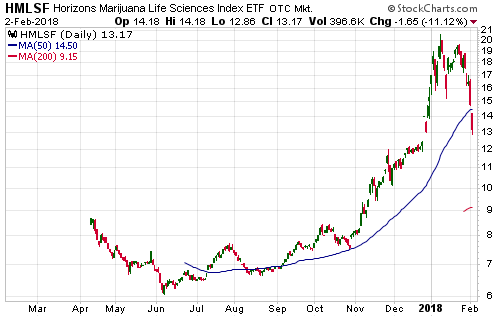
Marijuana Stocks Update
When we wrote about the enthusiasm for marijuana stocks in the 8th
January Weekly Update, the Horizons Marijuana ETF (HMLSF) had just pulled
back in reaction to a decision by US Attorney General Jeff Sessions to
rescind the "Cole Memo", leading to some concern that there would be a
federal crackdown on marijuana sales and consumption. However, the
pullback was minor and the ETF was still trading near its high. Here's how
we summed up the situation:
"[Speculation in marijuana-related
equities]...is yet another stock-market bubble. Marijuana production is
essentially a low-margin commodity business deserving of a relatively low
valuation, but most marijuana-related stocks now have extremely high
valuations. Therefore, buying these stocks should not be called investing;
it should be called betting on future sentiment. As long as the industry
continues to grow rapidly and market participants fixate on this growth
while ignoring the realistic earnings potential of the companies involved,
the bull market could continue.
Although the downward price-spike
prompted by Jeff Sessions' burst of idiocy was largely retraced on Friday,
there's a high risk that the marijuana sector will soon commence a
substantial correction. This is partly because the sector has just
experienced what appears to be an upside blow-off and partly because the
speculation in this sector would be interrupted by weakness in the broad
stock market.
A substantial correction may create a new speculative
buying opportunity."
As illustrated by the following daily
chart of HMLSF, a substantial correction has since begun. In our opinion,
it's too soon to view the price decline as a buying opportunity.
Current Market Situation
The S&P500 Index
(SPX) has fallen by 4% from the all-time high it hit during the week
before last. A 4% decline isn't much and at this stage the index hasn't
even dropped far enough to reach its 50-day MA, so there hasn't been a
significant correction yet. However, the recent decline feels significant
because it has been well over a year since the SPX experienced a
run-of-the-mill 5% pullback from an all-time high. In other words, the
extraordinary lack of volatility over the past 12-18 months makes the
recent up-tick in volatility seem more meaningful than it is.
We continue to expect that there will be a 5%-10% correction during
the first quarter of the year followed by a move to new highs. This would
be consistent with the momentum extremes that were reached over the past
few weeks. It would also be consistent with the sentiment backdrop, which
is already becoming constructive thanks to our put/call indicator
generating a buy signal (the first buy signal since January of last year)
at the end of last week, and with the neutral fundamental backdrop.
However, last week's downside breakout in the bond market has increased
the risk that something more bearish than a 5%-10% correction will occur
in the stock market within the next couple of months.
There will be
a further increase in the stock market's short-term risk if the downside
breakout in the T-Bond price is confirmed by an upside breakout in the
T-Bond yield. In fact, if the T-Bond yield breaks above 3.20% and
continues to surge then the probability of something resembling a stock
market crash will become uncomfortably -- or comfortably, depending on
your perspective -- high.
Almost regardless of what's in store over
the next two months, a multi-week bottom probably will be put in place
this week. There should then be a rebound that recoups at least half of
the loss from the January high followed by a drop to new lows for the
move.
If you want to establish or add to a bearish/hedge position
then the aforementioned rebound -- assuming it happens -- will create the
best opportunity to do so. If you currently have no hedges or bearish
speculations it also could make sense to take an initial position now, via
either an inverse index fund or options with an expiry date of April or
later. The reason is that even if we are dealing with nothing more than a
short-term correction, the decline is probably less than half complete.
The most ridiculous price action yet?
Many
absurd things have happened in the stock market over the past 12 months.
The latest absurdity worth highlighting is the price action of Amazon.com
(AMZN) since the beginning of the year. This large-cap low-margin retailer
was already trading at a nosebleed valuation when 2017 came to a close,
but it has risen in almost a straight line since the start of this year
and at Friday's high was up 28% year-to-date. That is, it was up by 28% in
less than 5 weeks.
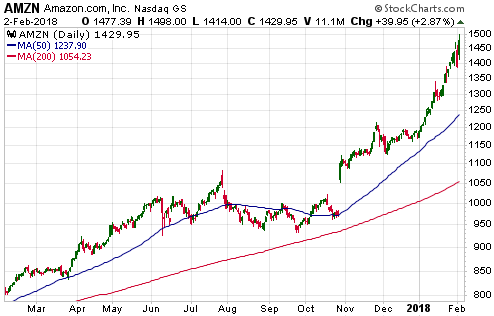
This could be written off as just another in a long line of upside
blow-offs, but adding to the absurdity of the situation is that AMZN's
stock price accelerated upward last week as the broad market retreated. It
seems, therefore, that 'investors' are viewing AMZN as a safe haven -- a
place to take shelter in times of increasing financial-market instability.
AMZN is the new gold!
We assume that the logic, or what passes for
logic these days, is that AMZN has a) no dividend yield, b) no chance of
having a dividend yield within the next couple of years, and c) almost no
earnings yield*. Consequently, as stocks that provide a significant yield
are made less attractive by rising interest rates, liquid stocks that
provide almost no yield become relatively attractive.
The
'investors' who jumped into AMZN shares last week to escape the
consequences of rising interest rates can look forward to large losses.
*The earnings yield is the reciprocal of the
P/E ratio. A stock such as AMZN that has a P/E ratio of about 360
therefore can be said to have an earnings yield of about 0.28%.
This week's
significant US economic events
[Notes:
1) The most important events
(to the markets) are shown
in bold. 2) A list of global economic events can be found
HERE]
| Date | Description |
| Monday Feb-05 | ISM Non-Mfg Index |
| Tuesday Feb-06 | International Trade Balance |
| Wednesday Feb-07 | Consumer Credit |
| Thursday Feb-08 | No important events scheduled |
| Friday Feb-09 | No important events scheduled |
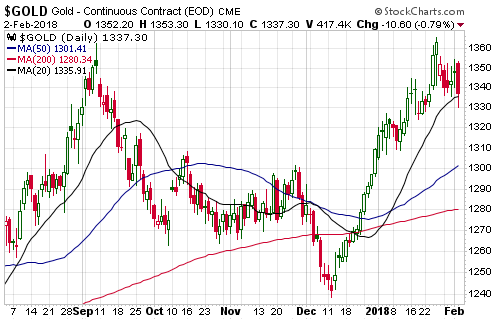
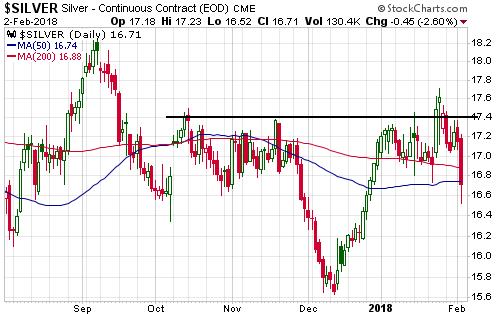
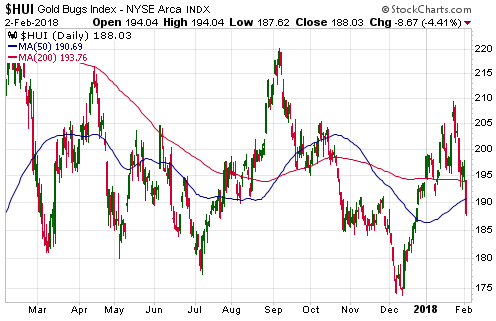
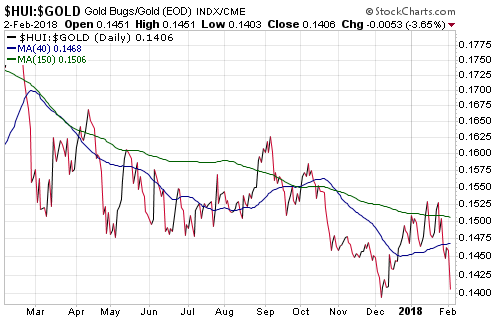
Gold and the Dollar