![]()
![]()
![]()
![]()
-- Weekly Market Update for the Week Commencing 5th March 2018
Big Picture
View
Here is a summary of our big picture
view of the markets. Note that our short-term views may differ from our
big picture view.
The BULL market in US Treasury Bonds that began in the early 1980s ended in mid-2016, but there will be many years of topping action in bond prices and bottoming action in bond yields before major new trends get underway. A major decline in government bond prices will unfold during the 2020s. (Last update: 11 September 2017)
The stock market, as represented by the S&P500 Index, commenced a secular BEAR market during the first quarter of 2000, where "secular bear market" is defined as a long-term downward trend in valuations (P/E ratios, etc.), gold-denominated prices and inflation-adjusted prices. This secular trend will bottom in 2020 or later. (Last update: 11 September 2017)
A cyclical BEAR market in the US Dollar began in 2016-2017. (Last update: 11 September 2017)
Gold commenced a secular bull market relative to all fiat currencies, the CRB Index, bonds and most stock market indices during 1999-2001. This secular trend will peak in 2020 or later. (Last update: 11 September 2017)
Commodities,
as represented by the CRB Index, commenced a
secular BULL market in 2001 in nominal dollar terms. The first major
upward leg in this bull market ended during the first half of 2008, but
a long-term peak won't occur until 2020 or later.
(Last
update: 11 September 2017)
Copyright
Reminder
The commentaries that appear at TSI
may not be distributed, in full or in part, without our written permission.
In particular, please note that the posting of extracts from TSI commentaries
at other web sites or providing links to TSI commentaries at other web
sites (for example, at discussion boards) without our written permission
is prohibited.
We reserve the right to immediately
terminate the subscription of any TSI subscriber who distributes the TSI
commentaries without our written permission.
True
Fundamentals Summary
[Notes:
1) The date shown next to the current True Fundamentals Model (TFM) signal is
when the most recent change occurred. 2) Charts of the Gold and Equity
TFMs are included in the "Charts and Indicators" section of the TSI web
site]
| Market | True Fundamentals Model (TFM) |
| Gold (US$ Price) | Bearish (12 Jan 2018) |
| US Equity (SPX) | Neutral (12 Jan 2018) |
| Currency (Dollar Index) | Bullish (15 Dec 2017) |
| Commodities (GNX) | Bullish (29 Dec 2017) |
Last week's posts at the TSI Blog
The
warning shots of 2007
Summary of current
thinking/positioning
1) Thinking that the US$ gold
price will go on to make new highs for the year during the second quarter,
but that a short-term correction low is not yet in place.
2)
Favouring a drop in the stock market to test the early-February low during
March, but assigning a very low probability that the decline from the
January peak is something more bearish than a short-term correction.
3) Thinking that industrial commodities such as oil and copper are in
downward trends that will end in March.
4) Expecting the rebound in
the Dollar Index (DX) to continue for a few more weeks before the
longer-term downward trend resumes.
5) Expecting that the T-Bond
will rebound for a few weeks and then resume its downward trend.
6)
Holding a cash reserve of 25%-30% and looking for opportunities to
increase it.
Economic Numbers
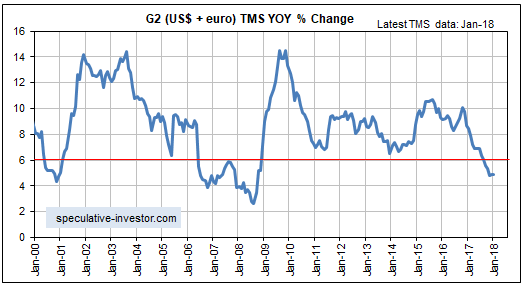
G2 Monetary Inflation
The ECB got around the publishing its January-2018 money-supply data
last week, enabling us to update our calculation of the G2 (US plus
euro-zone) monetary inflation rate. The G2 monetary inflation rate has a
closer relationship to the overall financial-market and economic backdrop
than does the US monetary inflation rate in isolation.
The
following chart shows that the year-over-year rate of growth in G2 money
supply was essentially unchanged in January and remains in the bottom
quartile of its 20-year range. The monetary backdrop is therefore not
supportive of equity prices or Keynesian measures of economic performance
such as GDP, although we aren't yet seeing evidence in the monthly
economic numbers and other high-frequency data that the tightening of
monetary conditions has begun to matter.
US Recession Watch
The latest iteration of the
ISM New Orders Index (NOI), one of our three primary leading indicators of
US economic recession, was reported on Thursday 1st March. It was down a
little from the preceding month but remains near the top of its 20-year
range.
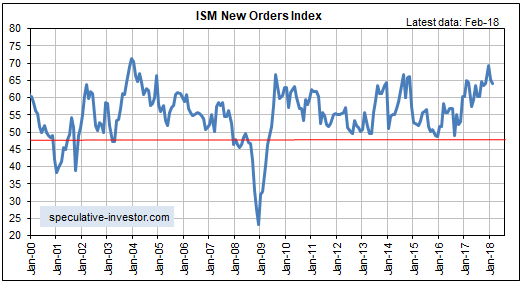
As a result, there has been no change in our expectations regarding
the timing of the next US recession. The probability of a recession
beginning during the first half of this year remains close to zero, but
due to the tightening of monetary conditions there is a realistic chance
that a recession will begin before year-end.
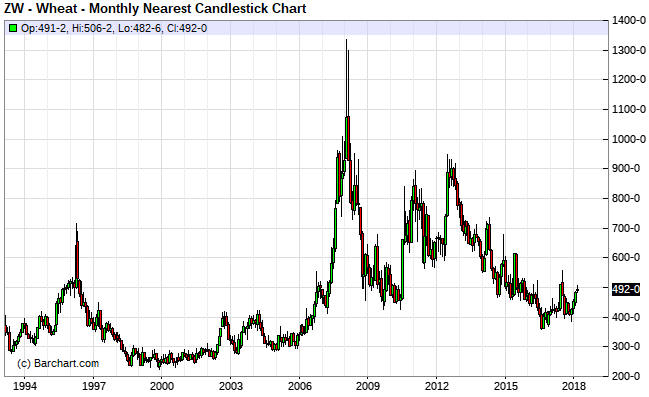
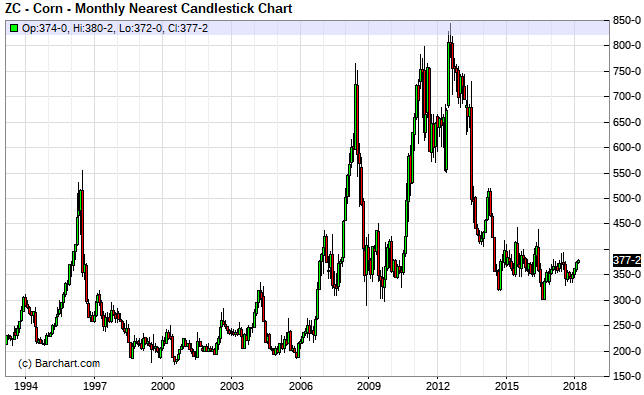
Commodities
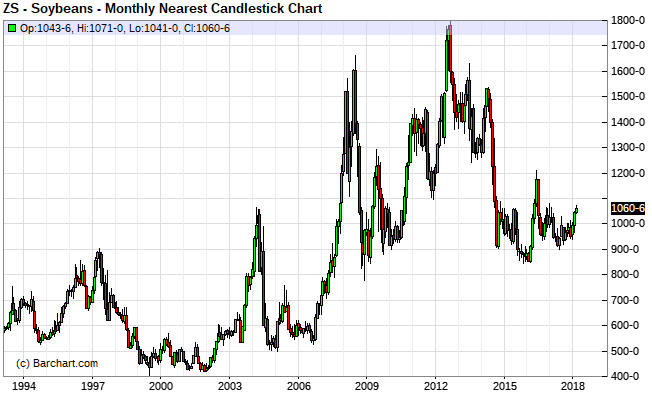
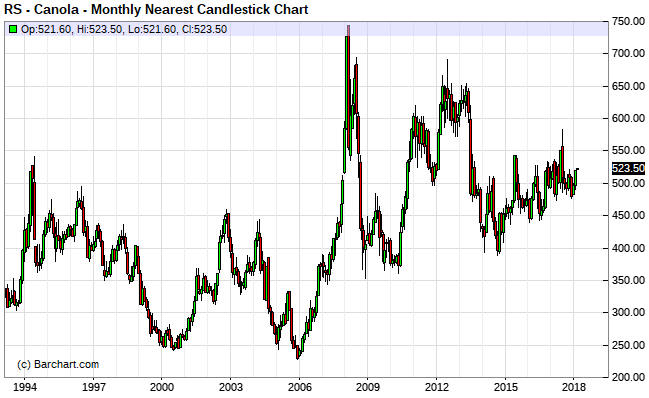
Gains in the Grains
We don't know how to assess the fundamentals of the grain markets, but
we've noticed that grain prices have turned upward from very depressed
levels on long-term monthly charts and that the grains are cheap relative
to many other commodities. Given that global grain consumption will almost
certainly be higher in the future than it is in the present, the price
up-turns from levels that are low by historical standards in both absolute
and relative terms suggests to us that these commodities have bullish
intermediate-term and long-term risk/reward ratios.
Here are the
long-term monthly charts that have piqued our interest:
1) The
wheat price made a 10-year low in mid-2016. It then rebounded for about 12
months, quickly retraced the bulk of its rebound, and then, in
December-2017, resumed what could be a new long-term bullish trend.
2) Corn is in a similar position to wheat, except that the corn
market's mid-2016 low was a successful test of the 2008-2009
financial-crisis low.
3) The soybean market has been stronger than the wheat and corn
markets, in that the 2016 bottom for the soybean price was above the
financial-crisis low. Also, over the past two years the soybean market has
led the wheat and corn markets by several months.
4) Canola has been the strongest of the grain markets that we keep an
eye on. It has been working its way higher since late-2014 and is now in
the middle of its 10-year range.
And here are charts showing the recent reversals in the strength of
the iPath Grains ETN (JJG) relative to the SPDR Gold ETF (GLD) and the
iPath Copper ETN (JJC):
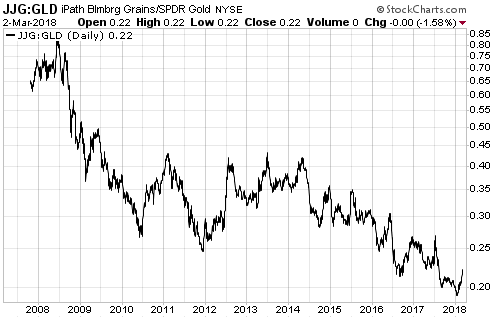
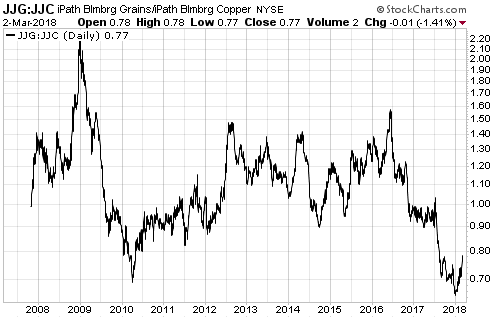
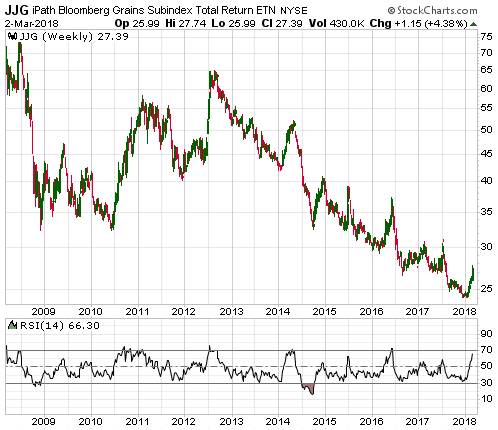
For us, a problem with being long-term bullish on the grains is that
we don't know of a good way to participate in a grains bull market. JJG is
fine for short- or intermediate-term trades, but due to contango-related
value leakage it will tend to underperform the associated commodities by a
wide margin over the long term. Displayed below is a chart showing the
long-term performance of JJG.
Input Capital (INP.V), a stock we mentioned a few weeks ago, does
canola streaming deals with farmers in Canada and should profit from a
continuing upward trend in the canola price, but over the past few years
there has been no relationship between the INP share price and the canola
price.
At this stage we view the nascent long-term upward trends in
grain prices mainly as supports for our view that bond yields have
commenced long-term upward trends. The reason is that rising food prices
will contribute to increasing concern about "inflation".
Platinum completes a routine correction
In late-January
the platinum price was testing the bottom of its $1025-$1050 resistance
range. At that time (in the 22nd January Weekly Update) we wrote:
"We
will be surprised if the platinum price manages to break above $1050
before experiencing a multi-week correction. Note that a routine
correction would retrace about half of the rally from the December low,
implying that the mid-$900s would be a realistic target for the next
tradable low if a correction were to begin near the current price."
Platinum traded as low as $956 last week, so the "realistic target for
the next tradable low" has been reached. There's no evidence that the
correction is complete, but the mid-$900s is a reasonable place for
investors with a 6-12 month or longer timeframe to do some buying.
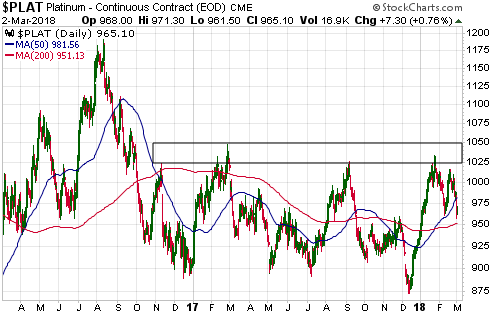
Due to falling demand for catalytic converters associated with the
rising popularity of EVs, platinum's long-term supply/demand relationship
is bearish for the price of the metal. A consequence could be that a
platinum/gold ratio of 1 will transform from a signal that platinum is
near a major price bottom to a signal that platinum is near a major price
top. That is, what was major support for platinum relative to gold in the
past will, in the future, be major resistance. However, assuming -- as we
are -- that the gold price will move into the $1400-$1500 range later this
year, there will be a lot of scope for platinum to rally while remaining
cheaper than gold.
We are bullish on platinum with regard to the
next 6-12 months.
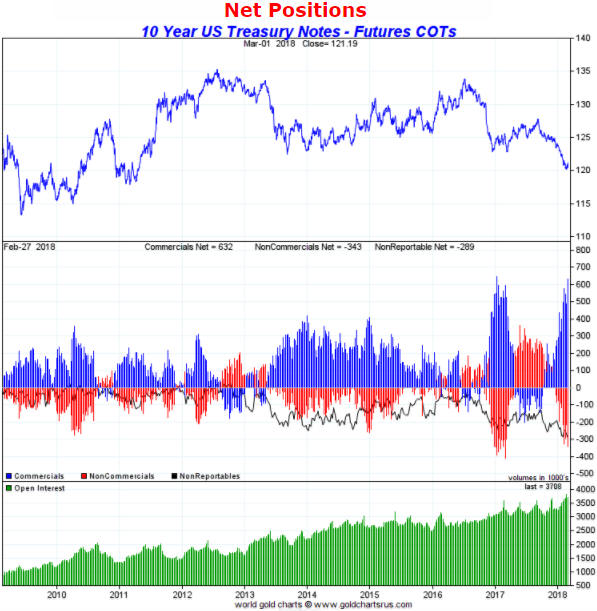
Speculators get
even more bearish on the T-Note
The total speculative net-short
position in 10-year T-Note futures surged during the latest week and is
now within a whisker of its all-time high. Refer to the following weekly
chart for details.
The all-time high for the speculative net-short
position occurred in January of last year and set the scene for an 8-month
upward consolidation in the 10-year T-Note. The rise to a similar level
over the past week means that this is not a good time to be placing
short-term bets on lower bond prices (higher bond yields), although this
time around we aren't expecting anything more than a multi-week upward
consolidation.
The Stock Market
Is the high level of
margin debt a problem?
The following chart was extracted
from the article posted
HERE and shows that US stock-market margin debt, which is reported
monthly with a lag of about one month, moved sharply higher in
January-2018 from an already-high level. Is this a problem?
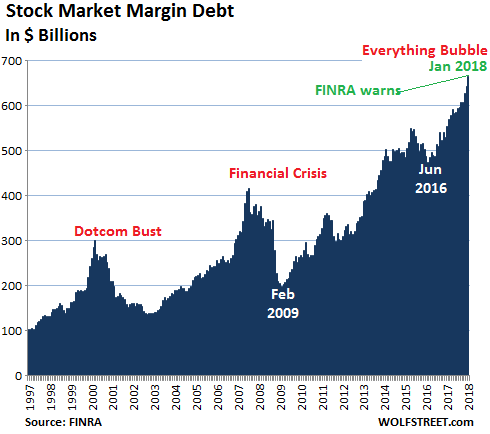
According to FINRA (the Financial Industry Regulatory Authority) it is
a problem. The above-linked article notes that FINRA issued an alert in
January, warning: "...many investors may underestimate the risks of
trading on margin and misunderstand the operation of, and reason for,
margin calls." And: "Investors who cannot satisfy margin calls
can have large portions of their accounts liquidated under unfavorable
market conditions. These liquidations can create substantial losses for
investors."
There is no doubt that the liquidation of margin
debt will magnify and accelerate the next intermediate-term stock market
decline or bear market, but there won't be a bear market as long as
leverage continues to increase. To put it another way: regardless of how
large the pile of margin debt becomes, the start of a bear market won't be
imminent as long as the pile is still growing.
The debt pile would
have shrunk a little in February, but it will take more than one month of
shrinkage in margin debt to warn that the equity bull market is on its
last legs.
Tariffs and the Stock Market
One
of the few concepts that almost all economists agree on is that tariffs
are bad for the economy. The reason for the agreement is that a deep
understanding of how the economy works is not required to know that
artificially raising the price of a good to help the local producers of
the good will hurt the local consumers of the good. Since the number of
local consumers will always be much greater than the number of local
producers of a protected good, it is obvious that the price-boosting
intervention will be harmful to the overall economy.
It will be
harmful even if there is no retaliation from other governments, but
retaliation in some form will often happen. The risk, therefore, is that
the initial tariff will turn out to be the first shot in a trade war and
an economic downward spiral.
That being said, the US tariffs on
steel and aluminium that were announced last week by the Trump
Administration were not the reason for last week's stock market downturn.
To believe that they were you would have to believe at least one of the
following fallacies:
1) The level of the stock market is first and
foremost a reflection of the state or expected state of the economy. Note
that if this were true then the S&P500 Index (SPX) would now be at least
30% lower.
2) In the absence of policy error there would never be a
downward correction in the stock market.
3) If news event A is
followed by market event B, then A must have caused B.
The third of
the above fallacies forms the basis of most explanations of market action
found in the mainstream press.
The reality is that at the
late-January peak the US stock market was more stretched to the upside in
both momentum and valuation terms than it had ever been. At that time the
stage was therefore set for a significant correction, with the main
unknowns being exactly when the correction would start and why the market
had managed to rise for so long without a significant correction.
When the initial leg of a correction is large and fast, which is the
situation we are currently dealing with, there will typically be a rebound
and then a decline to test the low of the initial leg REGARDLESS of the
news.
Current Market Situation
The US
The SPX broke above minor
resistance at 2750 last Monday and then negated the breakout the next day.
This was a bearish signal.
Last Tuesday's downward reversal was
followed by additional weakness on Wednesday and Thursday that took the
SPX below its 50-day and 20-day MAs. Friday's rebound did no more than
take the index back to its declining 20-day MA and therefore wasn't
significant.
The SPX's price action suggests that a test of the
early-February low remains a good bet.
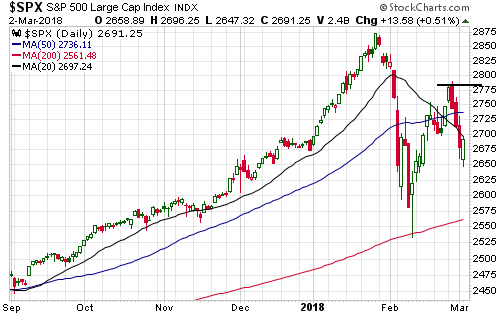
Last week's performance by the SPX has short-term bearish
implications, but the waters are muddied by the performance of the NDX.
After testing its January peak on Monday 26th February, the NDX did no
more than pull back to test its rising 50-day MA.
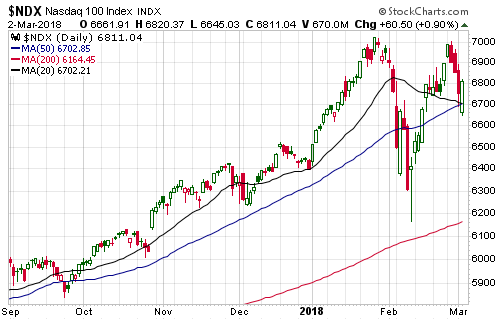
Despite the resilience of the NDX, we expect that most US stock
indices will test their early-February lows during March. The test could
occur as soon as this week or wait until the second half of the month.
Our plan is to exit all short-term bearish speculations if the SPX
tests its early-February low this week. Also, we will be stopped out of
all short-term bearish speculations if the SPX closes above 2781.
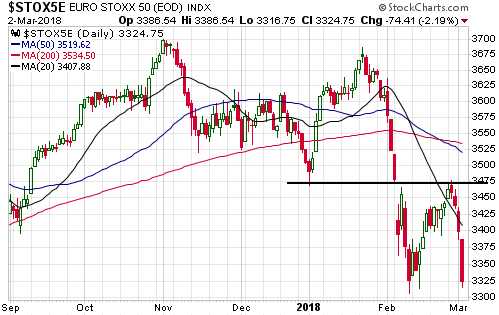
Europe
Equities have been much
weaker in Europe than in the US. This is evidenced by the fact that for
the EURO STOXX 50 Index (STOX5E) last week's downward reversal has already
led to a test of the early-February low. It is also evidenced by the
STOX5E ending last week near a 12-month low.
The STOX5E has
long-term support at 3100-3150. This is the most likely area for a
multi-month bottom.
This week's
significant US economic events
[Notes:
1) The most important events
(to the markets) are shown
in bold. 2) A list of global economic events can be found
HERE]
| Date | Description |
| Monday Mar-05 | ISM Non-Mfg Index |
| Tuesday Mar-06 | Factory Orders |
| Wednesday Mar-07 |
International Trade Balance Consumer Credit Fed's Beige Book |
| Thursday Mar-08 | No important events scheduled |
| Friday Mar-09 | Monthly Employment Report |
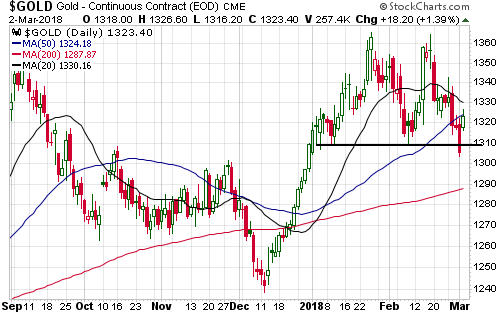
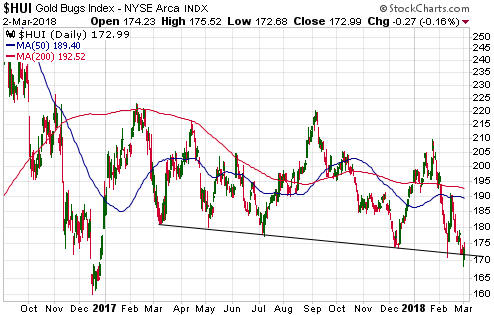
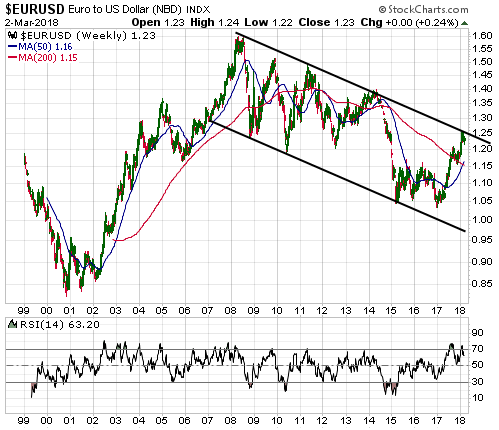
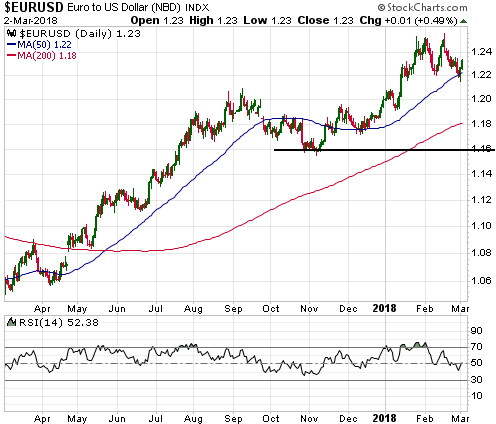
Gold and the Dollar