|
-- Weekly Market Update for the Week Commencing 5th April 2010
Big Picture
View
Here is a summary of our big picture
view of the markets. Note that our short-term views may differ from our
big picture view.
In nominal dollar terms, the BULL market in US Treasury Bonds
that began in the early 1980s will end by mid-2010. In real (gold)
terms, bonds commenced a secular BEAR market in 2001 that will continue
until 2014-2020. (Last
update: 09 February 2009)
The stock market, as represented by the S&P500 Index, commenced
a secular BEAR market during the first quarter of 2000, where "secular
bear market" is defined as a long-term downward trend in valuations
(P/E ratios, etc.) and gold-denominated prices. This secular trend will bottom sometime between 2014 and 2020. (Last update: 22 October 2007)
A secular BEAR market in the Dollar
began during the final quarter of 2000 and ended in July of 2008. This
secular bear market will be followed by a multi-year period of range
trading. (Last
update: 09 February 2009)
Gold commenced a
secular bull market relative to all fiat currencies, the CRB Index,
bonds and most stock market indices during 1999-2001. This secular trend will peak sometime between 2014 and 2020. (Last update: 22 October 2007)
Commodities,
as represented by the Continuous Commodity Index (CCI), commenced a
secular BULL market in 2001 in nominal dollar terms. The first major
upward leg in this bull market ended during the first half of 2008, but
a long-term peak won't occur until 2014-2020. In real (gold) terms,
commodities commenced a secular BEAR market in 2001 that will continue
until 2014-2020. (Last
update: 09 February 2009)
Copyright
Reminder
The commentaries that appear at TSI
may not be distributed, in full or in part, without our written permission.
In particular, please note that the posting of extracts from TSI commentaries
at other web sites or providing links to TSI commentaries at other web
sites (for example, at discussion boards) without our written permission
is prohibited.
We reserve the right to immediately
terminate the subscription of any TSI subscriber who distributes the TSI
commentaries without our written permission.
Outlook Summary
Market
|
Short-Term
(0-3 month)
|
Intermediate-Term
(3-12 month)
|
Long-Term
(1-5 Year)
|
Gold
|
Neutral
(10-Mar-10)
|
Bullish
(12-May-08)
|
Bullish
|
US$ (Dollar Index)
|
Neutral
(20-Jan-10)
| Bullish
(02-Nov-09)
|
Neutral
(19-Sep-07)
|
Bonds (US T-Bond)
|
Bearish
(05-Apr-10)
|
Bearish
(14-Dec-09)
|
Bearish
|
Stock Market (S&P500)
|
Bearish
(08-Mar-10)
|
Bearish
(11-May-09)
|
Bearish
|
Gold Stocks (HUI)
|
Neutral
(08-Mar-10)
|
Neutral
(16-Sep-09)
|
Bullish
|
| Oil | Neutral
(28-Oct-09)
| Bearish
(01-Mar-10)
| Bullish
|
Industrial Metals (GYX)
| Bearish
(21-Sep-09)
| Bearish
(25-May-09)
| Neutral
(11-Jan-10)
|
Notes:
1. In those cases where we have been able to identify the commentary in
which the most recent outlook change occurred we've put the date of the
commentary below the current outlook.
2. "Neutral", in the above table, means that we either don't have a
firm opinion or that we think risk and reward are roughly in balance with respect to the timeframe in question.
3. Long-term views are determined almost completely by fundamentals,
intermediate-term views by giving an approximately equal weighting to
fundmental and technical factors, and short-term views almost
completely by technicals.
This week's market action could be significant
Last Friday the US government
reported the largest monthly gain in new jobs in three years (thanks,
in part, to the jobs added by the government to compile the 2010
census). This news prompted a bounce in the US$ and a moderate decline
in T-Bonds in futures trading, but most financial markets were closed
and most traders were 'out of action' due to the Good Friday holiday.
The real reaction to this news should therefore be seen on Monday.
On a short-term basis a number of markets are at interesting junctures,
so the reaction to the employment news could contain more than the
usual amount of information. Of particular note, if the dollar's
news-related bounce proves to be minor and gold is able to hold onto
the bulk of last Thursday's gains then we will have clear evidence that
a short-term peak is in place for the Dollar Index and that a
multi-week rally has begun in the gold market.
Bond Market Update
We usually become more bullish (or less bearish) on a market after it
drops back to support, but although the T-Bond market has just pulled
back to support (refer to the following daily chart of the June T-Bond
futures for details) we are now downgrading our short-term bond view
from "neutral" to "bearish". Its chart looks bearish, and with hundreds
of thousands of census-related jobs being added over the next couple of
months the T-Bond will temporarily lose the boost it has been getting
from the dismal employment picture.
In our opinion, there's a reasonable prospect of a T-Bond decline to around 105 within the next two months.
The Stock
Market
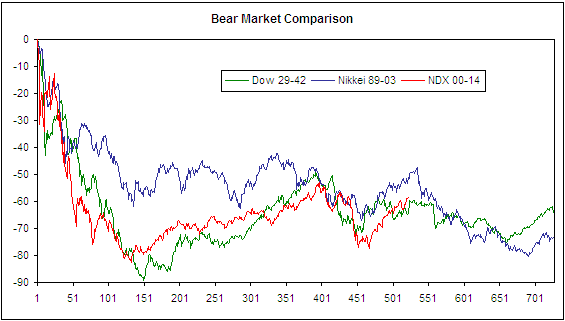
Another (hopefully clearer) perspective on the long-term bear market comparison
The two most famous equity bear markets of the past century followed
broadly similar patterns. We are referring to the bear market in US
equities that extended from 1929 to 1942 and the bear market in
Japanese equities that extended from 1989 to 2003. In each case there
was a severe decline lasting about three years (the first cyclical bear
within the secular bear), followed by a 4-5 year period of recovery or
stabilisation, and, finally, a choppy 5-7 year decline (the second
cyclical bear within the secular bear). Furthermore, the patterns
turned out to be similar despite some stark differences in the
fundamental backdrops.
The point is that similar market outcomes don't require similar events
to be happening in the background. There must, however, have been
something that caused the two great equity bears of the past century to
trace out patterns that ended up looking alike when viewed through a
wide-angle lens.
Our best guess is that the similarities resulted from the Herculean
efforts made by the government in each case to arrest the bear market
and 'stimulate' the economy after the bursting of a private-sector
credit bubble. These efforts curtailed natural corrective processes and
generally prolonged the agony. Following WWII the US government removed
a lot of controls and largely got out of the way, thus setting the
stage for a real recovery and a new secular bull market in stocks.
Unfortunately, the Japanese government is 'still crazy after all these
years' and is still trying desperately to stimulate its economy in
accordance with the Keynesian script. This is why Japan's recoveries
keep failing and why the secular bear market in Japanese equities drags
on.
Turning to the current situation, the US government has made, and
continues to make, the same mistakes that were made by the Japanese
government during 1989-2003 and the US government during 1929-1942.
Moreover, today's government is magnifying and adding to the mistakes
of the earlier periods. It's therefore a good bet that when measured in
terms of gold the current secular bear market will outdo its
predecessors. When measured in nominal currency terms the outcome may
be no worse and could even look a little better, depending on how much
the Treasury-Fed combination depreciates the dollar.
The following chart shows the paths that were taken by the Dow and the
Nikkei following their August-1929 and December-1989 peaks (the
vertical axis is the percentage decline from the peak and the
horizontal axis is the number of weeks from the peak). It also plots
the NASDAQ100 Index (NDX) from its March-2000 peak. Notice that the
line representing the NDX (the red line) has done a reasonable job
until now of tracking the other lines, and that the NDX line is
presently between the lines representing the two earlier bear markets.
If there's a good reason other than currency depreciation to expect the
current bear market to end markedly sooner and/or higher than its
predecessors, we'd like to hear/read it.
Although historical
comparisons such as the one charted above can be useful in framing 'big
picture' views, they can't reliably be used to anticipate and trade
short-term or intermediate-term trends. Based on the way the US
government and Federal Reserve are behaving it is likely that the
performance of the US stock market over the next few years will be AT
LEAST as bad as the performances of the Dow and the Nikkei during the
final few years of their 1929-1942 and 1989-2003 bear markets, but
aggressive bearish speculations aren't appropriate at this time and for
most people will never be appropriate. In our opinion, the best way to
handle today's market and economic risk is to have plenty of cash in
reserve AND substantial exposure to gold-related investments. The gold
position protects against the combination of economic weakness and
monetary inflation, while the cash position provides liquidity and
protects against the possibility that the next intermediate-term stock
market decline will create another deflation scare.
Current Market Situation
Up until the past couple of weeks the US stock market's 'internals' had
generally been confirming the rallies in the senior stock indices, but
bearish divergences have begun to appear. For example, down-volume was
greater than up-volume on the NASDAQ last Thursday even though the
market made a new 52-week high. Also, neither the Russell2000 Small Cap
Index nor the number of individual stocks making new highs confirmed
last week's new 52-week highs in the large-cap indices. This is what we
would expect to see during the lead-up to an important peak.
Despite the broad US stock market looking 'overbought' and showing
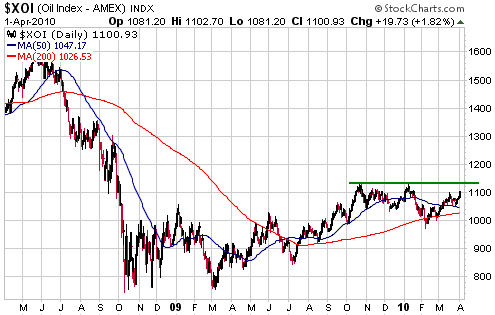
signs of being close to a top, the chart of the AMEX Oil Index (XOI)
has begun to look constructive. Unlike the broad market, the XOI has
been in consolidation mode since last October and is definitely not
'overbought'. It made a short-term bottom in early February at its
200-day moving average and is now approaching its October and January
highs.
The XOI's chart suggests the potential for significant gains over the
coming 1-2 months. Assuming they materialise, these gains will create a
good opportunity to reduce exposure to oil and gas stocks ahead of the
next global economic downturn (the next phase of the depression).
The Shanghai and Hong
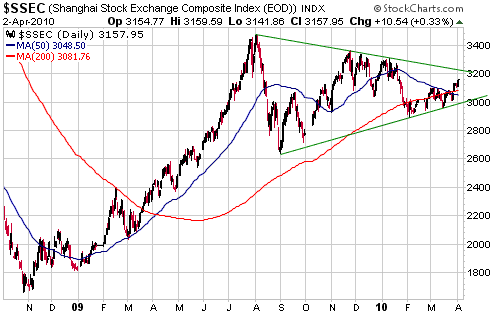
Kong stock markets are in interesting positions. The Shanghai Stock
Exchange Composite Index (SSEC) peaked 8 months ago and has since
traced out a chart pattern that could turn out to be either a rounded
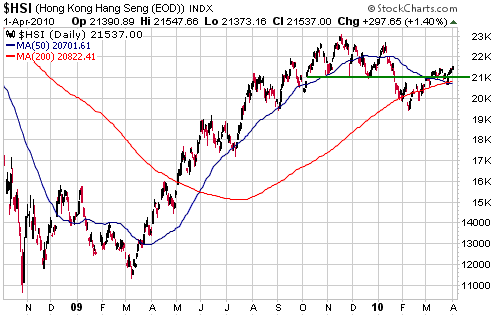
top or a consolidation within a longer-term upward trend. Hong Kong's
Hang Seng Index (HSI) peaked 4.5 months ago and also has a chart
pattern that could be interpreted as either a rounded top or a
consolidation. Charts of the SSEC and the HSI are displayed below.
In the cases of both the SSEC and the HSI, the 50-day moving average
has just crossed below the 200-day moving average (MA). 'Technical
analysts' tend to view this type of MA crossover as bearish, but our
experience has been that bull market corrections regularly end around
the time of such an event. In other words, MA crossovers don't tell us
anything in isolation. What we can say is that if the SSEC and the HSI
now move decisively below their 50-day MAs it will suggest that the MA
crossovers did, indeed, confirm downward reversals in these indices'
intermediate-term trends.
Updating earlier comments on put options
In the 8th March Weekly Update we wrote:
"Holding a lot more cash
than usual is our preferred method of dealing with unusually large
downside risk, although we sometimes complement our cash position with
some put options to provide additional protection. Our current plan is
to accumulate a small (relative to overall portfolio size) put-option
position over the next few weeks. Any put options that we buy in the
near future will have expiry dates of December-2010 or later and will
be selected to hedge our commodity-related exposure. Two likely
candidates are SLV (silver) and FCX (Freeport McMoran, the world's
largest listed copper producer) put options, because silver has more
downside risk than gold and copper stocks have more downside risk than
gold stocks. Hopefully, we will get the opportunity over the next few
weeks to purchase SLV put options with silver trading above $18 and FCX
put options with FCX trading above $85."
We haven't bought any put options yet, but the opportunity to purchase
SLV put options with silver trading above $18 and FCX put options with
FCX trading above $85 has arrived (in the case of FCX) or is probably
about to arrive (in the case of SLV). The reason for this update is to
mention that we do NOT intend to buy SLV put options at this time, even
though the silver price is approaching resistance. This is due to the
evidence that gold is commencing a multi-week rally. If gold rallies
then silver should do the same.
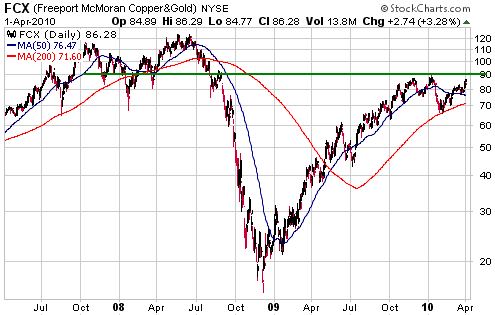
We do, however, intend to average into FCX January-2011 put options
over the next several weeks, beginning immediately. As indicated by the
following chart, FCX is 'overbought' on an intermediate-term basis and
is nearing important resistance at US$90. If it breaks above $90 then
it will probably rise to the big round number ($100).
This week's
important US economic events
| Date |
Description |
Monday Apr 05
| Pending Home Sales
ISM Non-Manufacturing Index
| | Tuesday Apr 06 | FOMC Minutes
| | Wednesday Apr 07
| Consumer Credit
| | Thursday Apr 08
| No important events scheduled
| | Friday Apr 09
| No important events scheduled
|
Gold and
the Dollar
Gold and Silver
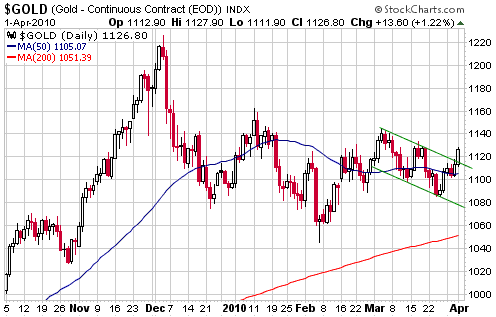
In last week's Interim Update we wrote: "...both
of the most likely short-term scenarios involve the gold price heading
up to the high-$1100s over the next few weeks. The first of these
possible outcomes entails a quick move down to the mid-$1000s followed
by a move up to the high-$1100s, while the second possibility is that a
move up to the high-$1100s is already underway. A daily close above
$1120 would skew the odds in favour of the second possibility."
The gold price closed above $1120 on Thursday, thus skewing the odds in
favour of the second of the aforementioned possible outcomes.
The following chart shows Thursday's break above the top of the
short-term channel, but the gold futures market was closed on Friday so
the chart doesn't show a reaction to the US Employment Report. Gold
futures will probably decline on Monday, but if they can hold above
$1120 on a daily closing basis it will be further evidence that a
multi-week rally is underway.
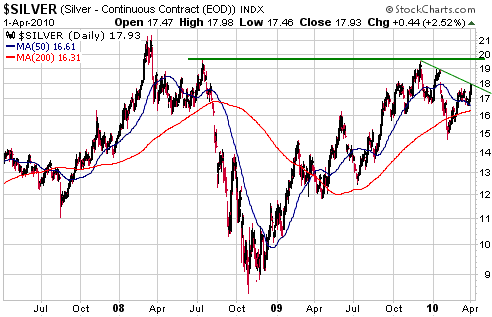
The silver price
ended last week at minor trend-line resistance, but if gold's upside
breakout holds during the early part of this week then silver is
probably on its way to the more important lateral resistance that lies
at $19.50 (the July-2008 and December-2009 peaks) or $21.00 (the
March-2008 peak).
Gold Stocks
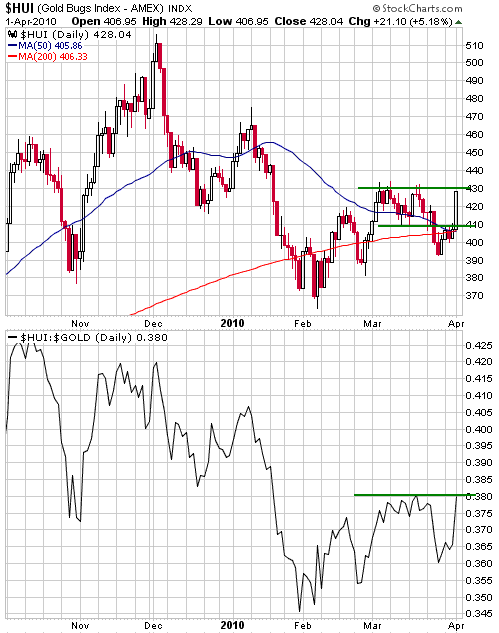
In last week's Interim Update we said that the HUI was probably on its
way to the mid-to-high 400s, with 470 being a realistic short-term
target. There was, however, a risk that it would pull back to the 370s
before commencing a rally.
Thursday's action suggests that the anticipated rally is underway, but
Monday's market reaction could be telling. A pullback in the HUI early
this week that holds at 420 or higher on a daily closing basis would be
additional evidence that a multi-week rally has begun.
The top section of the following chart shows the HUI and the bottom
section shows the HUI/gold ratio. At this stage the HUI has done
nothing more than move back into the horizontal range in which it
oscillated during the first three weeks of March, but it is probably
significant that the late-March break below the bottom of the range was
quickly negated. In our experience, false downside breakouts are more
reliably bullish than upside breakouts.
Currency Market Update
We expect that the euro will trade below 1.20 against the US$ before
this year is over, but it might have just made a short-term bottom. If
so, it wouldn't surprise us to see the euro rebound to around 1.42 over
the next several weeks before resuming its downward trend.
A daily close above 1.36 in the June euro would be preliminary evidence
of a short-term bottom. As illustrated by the following daily chart,
the euro reversed downward after testing 1.36 late last week. A daily
close above 1.38 would be definitive evidence of a short-term bottom.
Update
on Stock Selections
(Notes: 1) To review the complete list of current TSI stock selections, logon at http://www.speculative-investor.com/new/market_logon.asp
and then click on "Stock Selections" in the menu. When at the Stock
Selections page, click on a stock's symbol to bring-up an archive of
our comments on the stock in question. 2) The Small Stock Watch List is
located at http://www.speculative-investor.com/new/smallstockwatch.html)
 Small Stocks Watch List Small Stocks Watch List
In the future we will only put a new stock into the TSI Stock
Selections List if it is liquid enough that a suggestion by us to buy
or sell it won't significantly affect its price. To put it another way,
when it comes to the TSI Stocks List we will try to avoid stocks that
will potentially surge in reaction to being added to the List and
plunge in reaction to subsequently being removed from the List. This
doesn't mean that we will be switching our focus from junior stocks to
mid- and large-cap stocks (we won't make such a switch because the best
bull market at this time is the gold bull market and the best
gold-related speculations are at the junior end of the gold sector);
rather, it means that as far as the TSI Stocks List is concerned we
will be focusing on juniors with reasonable liquidity and steering
clear of thinly-traded microcaps.
Having said that, we don't want to completely ignore the thinly traded
stocks at TSI. This is because we know of some illiquid small-cap
stocks that have excellent risk/reward ratios and that could be of
interest to risk-tolerant TSI readers with sufficient expertise to do
their own company research. We have therefore created a Small Stocks
Watch List (SSWL) that will be built up over time. The members of the
SSWL will not be formal recommendations and will not necessarily have
their progress updated via the TSI commentaries, but if a stock is in
the SSWL it means that we view it as an interesting speculation near
the current price. If a member of the SSWL loses its attractiveness due
to a change in the underlying business fundamentals or an increase in
its price, it will be removed.
It is likely that some stocks will start out as members of the SSWL and
subsequently graduate to the TSI Stocks List due to growth in the
underlying business.
The Small Stocks Watch List can be found at http://www.speculative-investor.com/new/smallstockwatch.html.
It has three initial members, one of which (Greenscape Capital) was
discussed in the 22nd February 2010 Weekly Update. Here are brief
descriptions of the other two initial members:
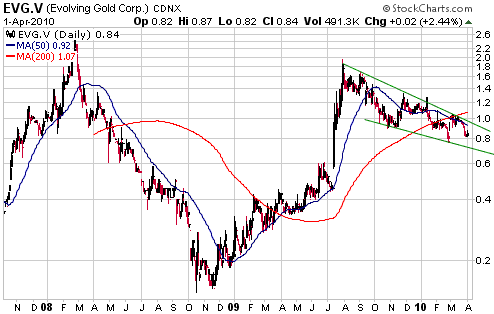
1. Evolving Gold (TSXV: EVG)
EVG hasn't yet announced its first resource estimate, but based on the
drilling results that have been released to date it is almost certain
that the company's Rattlesnake Hills project in Wyoming has a
multi-million ounce gold resource. Also, there is a decent chance that
its Carlin project in Nevada has a multi-million ounce gold resource.
The stock has been written up by Bob Moriarty a few times over the past
18 months, most recently on 1st March in response to drilling results
from the Carlin project. Refer to http://www.321gold.com/editorials/moriarty/moriarty030110.html.
EVG actually has reasonable liquidity (average daily trading volume is
around 500K shares), but in the absence of a resource estimate we have
no way of valuing the stock. For a company that is yet to do its first
resource estimate its current C$96M market cap is quite high, but it
could POTENTIALLY be worth a multiple of that if a) its projects
contain as much gold as drilling results suggest, and b) it can be
established that the projects would be economic using conservative
metal-price assumptions.
The chart (see below) shows a moon-shot last July in response to
spectacular news on the drilling front, followed by a slow decline that
has retraced the bulk of the moon-shot. Obviously, the stock got well
ahead of itself in July of 2009.
2. Silver Bear Resources (TSX: SBR)
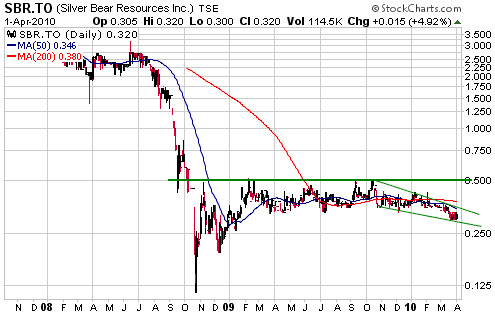
SBR owns the Mangazeisky project in Russia, a project with a high-grade
47M-oz silver resource (18M ounces M&I plus 29M ounces inferred).
It has a market cap of only C$12M at Thursday's closing price of C$0.32
and C$12M of cash, meaning that its current enterprise value is zero.
To put it another way, the stock market is presently assigning no value
whatsoever to the aforementioned 47M-ounce silver resource.
The CEO of SBR is Randall Oliphant, the former CEO of Barrick Gold and the current chairman of New Gold (NGD).
A recent press release stated: "Silver
Bear's focus in 2010 will include reviewing strategic alternatives for
the company to enhance shareholder returns. This may include: continued
exploration/development of the Mangazeisky project, joint venture of
the project, or combination with another mineral focused company." That is, SBR's management appears to be looking to do a deal with the aim of boosting the company's market valuation.
SBR traded above C$2 in mid-2008 and is now languishing more than 85% lower.
 Khan Resources (TSX: KRI). Shares: 54M issued, 59M fully diluted. Recent price: C$0.89 Khan Resources (TSX: KRI). Shares: 54M issued, 59M fully diluted. Recent price: C$0.89
Our suggestion was that KRI shareholders accept CNNC's C$0.96/share
cash bid at the end of last week unless a superior bid emerged in the
mean time. The CNNC bid expires on Tuesday 6th April.
No other bid has emerged, so for record purposes we will assume that
KRI has been exited at C$0.96. This is near the high of the past 18
months, but substantially below our original entry.
Full value for KRI's stake in the Dornod uranium project is probably in
excess of C$2.50/share, but the best chance of getting anywhere near
full value was a higher bid from the Russian company that also has a
stake in the project. Unfortunately, the Russian company (ARMZ)
attempted to gain control via political rather than financial means,
which had the effect of pushing KRI's market price below the CNNC offer
and making it more likely that CNNC's bid will be successful. Also of
significance is that KRI's senior managers have accepted the CNNC bid
for their own shares.
Note that the CNNC bid is subject to conditions that may not be
satisfied, the most important being the condition that CNNC obtains at
least two-thirds of all outstanding KRI shares. This means that
acceptance of the bid does not guarantee receipt of the C$0.96/share
cash payment. There is a possibility that the bid's conditions won't be
satisfied and that any shares submitted will subsequently be returned.
 Long-dated gold stock warrants Long-dated gold stock warrants
The Franco Nevada March-2012 C$32 warrants (TSX: FNV.WT) and the
Kinross Gold September-2013 C$32 warrants (TSX: K.WT.C) are suitable
for new buying near their current prices of C$4.40 and C$2.80,
respectively. The FNV warrants are closer to the money and offer
slightly better value, but the K warrants offer the benefit of more
time to expiry.
Out-of-the-money warrants are always high risk.
 New short-term natgas trade New short-term natgas trade
The United States Natural Gas Fund (NYSE: UNG) declined in almost a
straight line from mid February through to 31st March, but there was a
key reversal to the upside on Thursday 1st April (an April Fool's
joke?). After trading at a new all-time low early in the day, UNG
reversed direction and closed above its highs of the previous five
trading days. Furthermore, this happened in the face of bearish news
regarding natgas storage.
We like UNG's short-term risk/reward right now, because a) Thursday's
action has defined a logical 'stop' for risk management purposes, b)
natural gas is very low on an absolute basis and relative to oil, and
c) the seasonal influence is positive into May. We are therefore adding
(returning) UNG to the TSI Stocks List as a short-term trade at
Thursday's closing price of US$7.29. The initial sell stop is a daily
close below US$6.79 (just below Thursday's low).
Chart Sources
Charts appearing in today's commentary
are courtesy of:
http://stockcharts.com/index.html
http://www.futuresource.com/

|

