|
-- Weekly Market Update for the Week Commencing 5th May 2008
Big Picture
View
Here is a summary of our big picture
view of the markets. Note that our short-term views may differ from our
big picture view.
Bonds commenced a secular BEAR market in
June of 2003. (Last
update: 22 August 2005)
The stock market, as represented by the S&P500 Index, commenced
a secular BEAR market during the first quarter of 2000, where "secular
bear market" is defined as a long-term downward trend in valuations
(P/E ratios, etc.) and gold-denominated prices. This secular trend will bottom sometime between 2014 and 2020. (Last update: 22 October 2007)
The Dollar commenced a secular BEAR market during the final quarter of 2000. The
first major downward leg in this bear market ended during the first
quarter of 2005, but a long-term bottom won't occur until 2008-2010. (Last update: 28 March 2005)
Gold commenced a
secular bull market relative to all fiat currencies, the CRB Index,
bonds and most stock market indices during 1999-2001. This secular trend will peak sometime between 2014 and 2020. (Last update: 22 October 2007)
Commodities, as
represented
by the CRB Index, commenced a secular BULL market in 2001. The first
major upward leg in this bull market ended during the second quarter of
2006, but a long-term
peak won't occur until at least 2008-2010. (Last update: 08 January 2007)
Copyright
Reminder
The commentaries that appear at TSI
may not be distributed, in full or in part, without our written permission.
In particular, please note that the posting of extracts from TSI commentaries
at other web sites or providing links to TSI commentaries at other web
sites (for example, at discussion boards) without our written permission
is prohibited.
We reserve the right to immediately
terminate the subscription of any TSI subscriber who distributes the TSI
commentaries without our written permission.
Outlook Summary
Market
|
Short-Term
(0-3 month)
|
Intermediate-Term
(3-12 month)
|
Long-Term
(1-5 Year)
|
Gold
|
Neutral
(05-May-08)
|
Neutral
(21-Apr-08)
|
Bullish
|
US$ (Dollar Index)
|
Bullish
(10-Mar-08)
| Bullish
(31-May-04)
|
Neutral
(19-Sep-07)
|
Bonds (US T-Bond)
|
Neutral
(03-Mar-08)
|
Bearish
(23-Jan-08)
|
Bearish
|
Stock Market (S&P500)
|
Neutral
(05-May-08)
|
Neutral
(26-Mar-07)
|
Bearish
|
Gold Stocks (HUI)
|
Neutral
(05-May-08)
|
Neutral
(21-Apr-08)
|
Bullish
|
| Oil | Bearish
(14-Jan-08)
| Bearish
(22-Oct-07)
| Bullish
|
Industrial Metals (GYX)
| Bearish
(05-May-08)
| Bearish
(09-Jul-07)
| Bullish
|
Notes:
1. In those cases where we have been able to identify the commentary in
which the most recent outlook change occurred we've put the date of the
commentary below the current outlook.
2. "Neutral", in the above table, means that we either don't have a
firm opinion or that we think risk and reward are roughly in balance with respect to the timeframe in question.
3. Long-term views are determined almost completely by fundamentals,
intermediate-term views by giving an approximately equal weighting to
fundmental and technical factors, and short-term views almost
completely by technicals.
Changes to short-term views
We expect that gold bullion
and the HUI will break below last week's lows before the gold
correction comes to an end. However, the views shown in the Outlook
Summary Table included at the top of every Weekly Market Update are not
based on what we think will PROBABLY happen; they are based on our
assessment of risk versus reward. For example, if we think a market has
an 80% chance of rising 5% and a 20% chance of falling 30% then we will
either be bearish or neutral on the market with respect to the
timeframe in question even though we expect the market to rise. The
reason is that in this hypothetical case the greater magnitude of the
downside risk outweighs the higher probability of an upward move.
We will give our reasons later in this report, but we think the decline
of the past two weeks has mitigated downside risk by enough to warrant
upgrading our short-term views on gold and gold stocks from "bearish"
to "neutral". If things go according to plan then we will further
upgrade our short-term views on these markets -- to "bullish" -- later
this month, but we will cross that bridge when we come to it.
We turned short-term bullish on the broad US stock market on 18th March
in anticipation of a rebound lasting at least 2 months. The rebound is
probably not over, but we are now downgrading our short-term stock
market outlook to "neutral" on the basis that the rally of the past
several weeks has substantially reduced the upside potential. If things
go according to plan then we will further downgrade our short-term view
on this market -- to "bearish" -- at some point over the next few
weeks, but, again, we will cross that bridge when we come to it.
The final change is the downgrading of our short-term view on
industrial metals from "neutral" to "bearish". This is due to our
perception that downside risk is increasing within this sector.
In summary: our perception is that the short-term risk/reward for
cyclical (growth-oriented) markets has deteriorated while the
short-term risk/reward for gold, the primary counter-cyclical market,
has improved.
Commodities
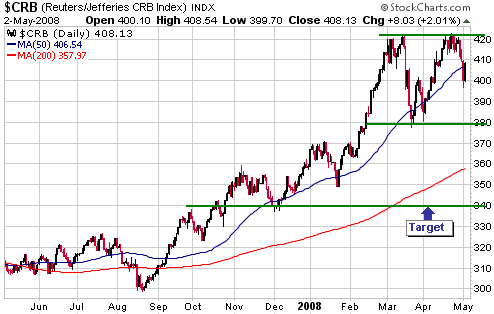
The CRB Index
With reference to the following daily chart, the CRB Index rocketed
upward between late February and mid March, pulled back sharply,
rebounded to test its March peak, and now appears to be rolling over
into the next phase of its intermediate-term correction. This downward
correction in the commodity world is linked to the upward correction in
the US$.
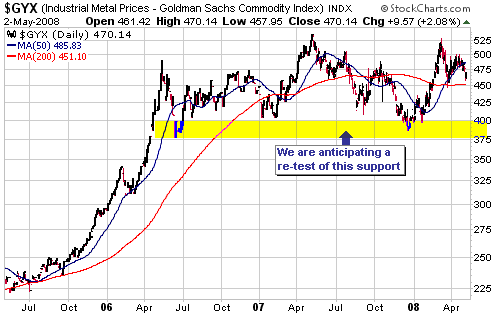
Over the past two months the one thing that has prevented us from
downgrading our short-term view on industrial metals to "bearish" has
been the bullish price action in the copper market. However, we made
the following comment in last week's Interim Update:
"A daily close below $3.80 [by May copper] would be a clear sign that
copper's short-term supply problems were close to being resolved or
about to be trumped by falling demand. Such an outcome would
immediately cause us to downgrade our short-term outlook for the
industrial metals sector from "neutral" to "bearish"."
The copper price plunged below $3.80 last Thursday, but then 'muddied
the waters' by closing back above $3.80 on Friday. The reversal is
therefore not as definitive as we'd like, but a short-term bearish
outlook is appropriate given the downside risk to global economic
growth and the upside risk to the US dollar's exchange value.
As noted on the following chart, our expectation is that the Industrial
Metals Index (GYX) will drop back to near the bottom of its 2-year
range.
The Stock
Market
Following the selling climax
of 22-23 January our view was that the US stock market had set its low
for the first half of the year, regardless of whether or not a bear
market was in progress. Our reasoning was that the sort of selling
climax seen in January had ALWAYS resulted in a low that had held for
at least 5 months irrespective of whether the longer-term trend was up
or down.
Some people claimed that the stock market's performance would be
different this time round because the US was experiencing the worst
financial crisis ever, but in real time the latest crisis will usually
feel like the worst crisis ever. The current crisis could well prove to
be the worst ever as far as the banking industry is concerned, but it's
not close to being the worst ever for the majority of US corporations.
For example, with some notable exceptions such as the banking and
homebuilding sectors, corporate America is in much better shape today
than it was during 2000-2002. Furthermore, valuations, while still high
by historical standards, are a lot lower today than they were at the
beginning of the last recession.
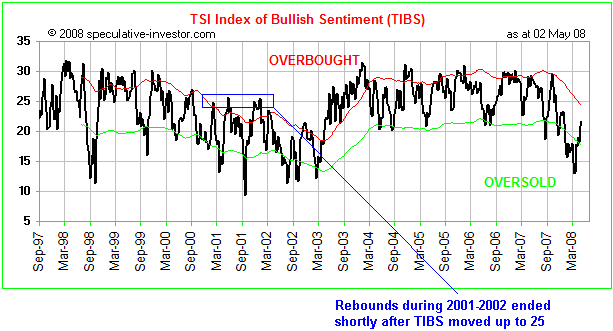
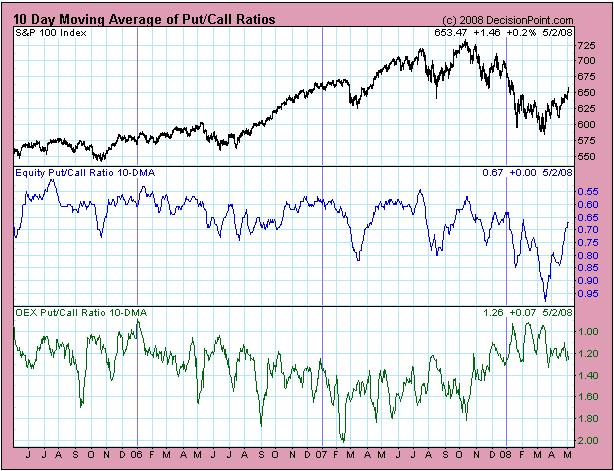
Our view is that the stock market's current rebound is the bear market
variety and will be followed by a decline to new multi-year lows.
However, we don't expect the rebound to end until sentiment has moved
back to 'optimistic territory'. Two indicators that we will be using to
identify when that happens are the TSI Index of Bullish Sentiment (TIBS
-- a weighted average of six different sentiment indicators) and the
10-day moving average of the put/call ratio. Charts of these indicators
are displayed below.
Near the end of the stock market's rebound we expect that:
a) TIBS will be 25 or above. (Note - we picked 25 because this is
roughly where the multi-month counter-trend rebounds ended during the
2000-2002 bear market.)
b) The 10-day moving average of the equity put/call ratio (the blue
line on the second chart) will be 0.60 or lower -- indicating
complacency on the part of the 'dumb money' -- AND the 10-day moving
average of the OEX put/call ratio (the green line on the second chart)
will be above 1.60 -- indicating concern on the part of the 'smart
money'. (Note - the scales are inverted on the put/call chart, so peaks
on this chart correspond with put/call lows.)
This week's
important US economic events
| Date |
Description |
| Monday May 05 | ISM Services
|
| Tuesday May 06 | No important events scheduled
| | Wednesday May 07
| Consumer Credit
Pending Home Sales
Q1 Productivity
| | Thursday May 08
| No important events scheduled
| | Friday May 09
| Trade Balance
|
Gold and
the Dollar
Gold
The case for additional near-term weakness
Indicators of gold market sentiment, such as the Commitments of Traders
(COT) data and the results of Market Vane's daily survey of gold
traders, show that there has been a sufficient reduction in optimism to
set the stage for the next multi-month rally. However, for the reasons
outlined below we doubt that a sustainable price low is already in
place.
We expect the gold price to bottom during May or June, but it's
unlikely to bottom until the stock market's rebound has run out of
steam; and as things currently stand, the stock market is poised to
continue its short-term upward trend.
From our perspective, the likelihood of the US$ making significant
additional gains also points to new correction lows for gold over the
weeks ahead. It is reasonable to expect that gold will bottom against
the US$ well before the US$ peaks against the euro, but we don't think
it's reasonable to expect gold to bottom at such an early stage of the
US dollar's recovery. Our thinking is that gold's correction low will
roughly coincide with the end of the dollar's INITIAL rally (the end of
the first wave of a multi-wave rebound).
The third reason we expect some additional price weakness in gold
relates to our general commodity outlook. Specifically, we think the
world of commodities has successfully tested its March peak and has
begun to roll over into a downtrend that will probably last at least a
few months. Gold's fundamentals are very different to those of any
other commodity, but if non-monetary commodities begin to accelerate to
the downside then the monetary commodity (gold) will, at least
initially, get dragged along for the ride. But like the case with the
US$-gold relationship, gold should only have a problem during the first
phase of the commodity decline because some of the expected drivers of
weakness in industrial commodities, such as slowing economic growth and
the resumption of the debt crisis, are positives for gold.
Current Market Situation
Since the beginning of gold's correction we've had $800 in mind as a
worst-case target. This remains so. As illustrated by the following
daily chart of June gold futures, $800 coincides with intermediate-term
support and is just below the 200-day moving average (bull-market
corrections often bottom just below the 200-DMA).
If we are right to assume that gold will do no worse than drop to
around $800 before resuming its long-term advance then the current
downside risk is only about 7%; hence, the upgrade to our short-term
outlook.
By the way, we think the downside risk in silver is approximately
double the downside risk in gold (we expect that a 5-7% decline in the
gold price would be accompanied by a 10-15% decline in the silver
price).
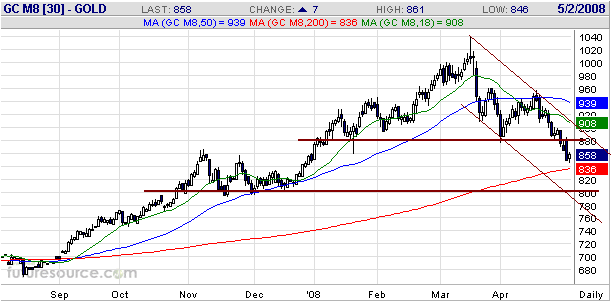
Any near-term rebound
in the gold market will probably be limited by former support (now
resistance) in the low-$880s and should definitely be limited by the
top of the downward-sloping channel drawn on the above chart. By the
same token, a solid daily close above the channel top would be a clear
sign that the correction low was already in place.
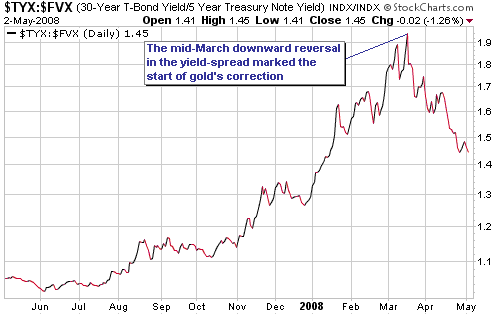
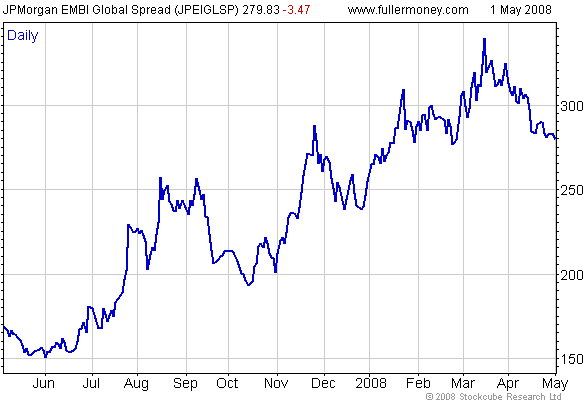
Intermediate-term Outlook
Yield spreads (differences between the yields on long-term and
short-term Treasury debt) and credit spreads (differences between the
yields on high-risk and low-risk debt securities of the same duration)
are two of the most important drivers of the gold price. In particular,
gold tends to fare well when yield spreads and credit spreads are
rising, that is, when long-term interest rates are rising relative to
short-term interest rates and when the yields on high-risk debt
securities are rising relative to the yields on investment-grade
securities.
The first of the following charts shows that a measure of the US
yield-spread -- in this case, the TYX/FVX ratio (the yield on the
30-year T-Bond divided by the yield on the 5-year T-Note) -- trended
higher from June of 2007 through to mid March of 2008, while the second
of the following charts shows that a measure of credit spreads -- in
this case, the JP Morgan EMBI Global Spread (the difference between the
yield on a basket of emerging market debt and US Treasury debt of
comparable duration) did something similar. The charts make the point
that the financial crisis peaked in mid March, which, not
coincidentally, was also the peak for the gold price.
We are operating
under the reasonable assumption that the financial crisis has not
ended. At least, it seems like a reasonable assumption to us given that
you can't expect to wring-out all, or even most, of the adverse
ramifications of a decade of credit-related excesses within the space
of only 9 months, especially when the central bank and the government
are trying to 'help' (read: delay the healing process). Therefore, a
resumption of the crisis is likely within the next few months.
A resumption of the crisis will almost certainly be signaled by upward
reversals in yield and credit spreads, which will, in turn, be evidence
that gold's intermediate-term trend had again turned up or was about to
do so. Gold should be a major beneficiary of both the realisation that
the crisis is not over and the attempts that officialdom will
undoubtedly make to inflate-away the consequences of earlier mistakes.
In other words, the beginning of gold's next intermediate-term advance
should coincide with, or be led by, upward reversals in yield and
credit spreads.
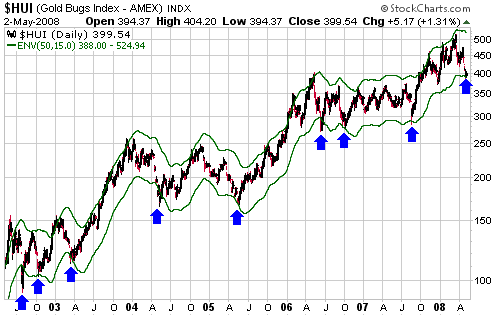
Gold Stocks
Current Market Situation
Based on a simplistic chart-based measurement, the HUI's recent
breakdown from a "head and shoulders" top created a downside target of
320. We do not believe the actual downside risk to be that great, but
due to the factors mentioned in our gold discussion under "The case for
additional near-term weakness" there is a good chance that last week's
low will be breached before the correction comes to an end.
One reason we view a drop to 320 (20% below Friday's closing price) as
highly improbable is that gold stocks are already very cheap relative
to gold bullion and, as discussed above, we think gold's additional
downside potential is only about 7%. Another reason is illustrated by
the following chart.
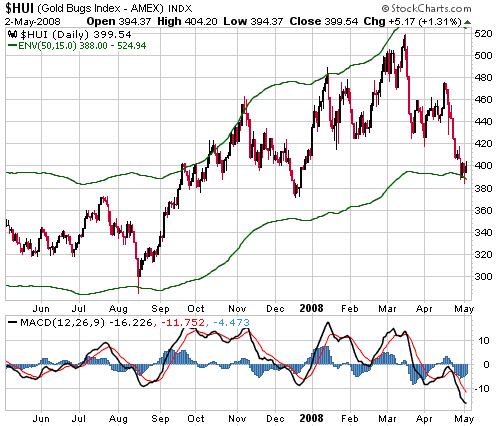
The chart shows the performance of the HUI over the past 6 years
relative to a Moving-Average (MA) envelope. The lines of the MA
envelope are determined by the 50-DMA +/- 15%, so the HUI will touch
the lower green line when it is 15% below its 50-DMA and the upper
green line when its is 15% above its 50-DMA. Moves to the upper edge of
the MA envelope have not been reliable signals of intermediate-term
highs, but moves to the lower edge have done an extremely good job of
pinpointing intermediate-term lows. In fact, prior to last week the HUI
had dropped to the lower edge of its MA envelope on eight separate
occasions over the past six years, and each time it did so the gold
sector was within three weeks of an intermediate-term bottom. On five
of these occasions the touch of the envelope's bottom edge set the
price low for the correction, whereas on three occasions -- July of
2002, April-May of 2004 and June of 2006 -- the HUI ended up spiking
10-15% below the bottom of its MA envelope before the final correction
low was in place.
The 'envelope-based' analysis therefore suggests that at last week's
low the HUI was within three weeks and 10-15% of its ultimate
correction low.
Considering the message of the 'envelope' alongside the relative
valuations of gold bullion and gold stocks we come to the conclusion
that the HUI's downside potential is limited to the mid-300s and that a
bottom will be in place by the end of the third week of May.
The following daily
chart shows a close-up view of the HUI relative to its MA envelope, and
also includes the HUI's MACD at the bottom of the chart. When the HUI
becomes as oversold as it is right now an upturn in the MACD --
indicated by the black line crossing above the red line -- is a
reliable signal that a correction low is in place.
Further to the above,
we will upgrade our short-term view on gold stocks to "bullish" when
the HUI drops to the 350s or when the HUI's MACD turns higher,
whichever happens first.
By the way, confirmation of a bottom in the gold sector would be a bearish omen for the broad stock market.
Bullion versus Stocks
There's no good reason to own any gold stock unless you are confident
that the stock will out-perform gold bullion by a wide margin. However,
such confidence has generally been misplaced over the past year in that
most gold stocks have not only failed to out-perform gold bullion by a
healthy margin, they have actually UNDER-performed gold bullion. A lot
of investors in gold stocks are therefore wondering why they should
bother.
The increasing popularity of bullion ETFs is widely considered to be at
least partly responsible for the lacklustre performance of the average
gold share, but we disagree with this view. We see the advent of
bullion ETFs as a net positive for the gold-mining sector because the
additional investment demand for bullion created by the ETFs helps
boost the bullion price, which, in turn, increases the value of the
average gold-mining company.
Our thinking with regard to the gold-mining sector's relatively poor
performance has been covered in earlier TSI commentaries, but here's a
very quick recap:
1. Gold mining shares haven't done a good job of leveraging gains in
the gold price because gold-mining companies haven't done a good job of
leveraging gains in the gold price. In other words, the cost of mining
gold has risen almost as fast as the gold price.
2. Share inflation (the supply of gold mining shares has been growing
rapidly due to equity financings, employee option plans, and the
floating of new companies)
3. Political risk (a.k.a. government stupidity)
Share inflation and concerns about political risk will continue to dog
the sector, but Newmont Mining's recent financial results suggest that
the gains in the gold price are finally beginning to generate serious
profits for the mining companies. Also, the risks posed by share
inflation and government stupidity can be mitigated to a significant
extent via prudent stock selection.
We are going to maintain a strong focus on the junior end of the
gold/silver sector, despite its lousy performance over the past 9
months, because we don't think the recent trend should be extrapolated.
There are legitimate concerns, but these concerns can be managed and
are more than fully discounted in current prices. Rather than give up
on the sector that served us so well prior to the past year, we find
ourselves becoming increasingly bullish.
Update
on Stock Selections
(Note: To review the complete list of current TSI stock selections, logon at http://www.speculative-investor.com/new/market_logon.asp
and then click on "Stock Selections" in the menu. When at the Stock
Selections page, click on a stock's symbol to bring-up an archive of our comments on the stock in question)
 As
promised in last week's Interim Update, we present, below, an
alphabetically-sorted shortlist of current TSI gold/silver stocks that
may be suitable for new buying immediately or following some additional
near-term weakness. With two exceptions, the stocks we've chosen to
highlight are either in production or close to production. In some
cases these stocks don't have as much upside potential as the
earlier-stage exploration plays in the TSI Stock Selections List, but
we expect them to be amongst the first movers during the next gold
rally. As
promised in last week's Interim Update, we present, below, an
alphabetically-sorted shortlist of current TSI gold/silver stocks that
may be suitable for new buying immediately or following some additional
near-term weakness. With two exceptions, the stocks we've chosen to
highlight are either in production or close to production. In some
cases these stocks don't have as much upside potential as the
earlier-stage exploration plays in the TSI Stock Selections List, but
we expect them to be amongst the first movers during the next gold
rally.
The two exceptions mentioned above are Andina Minerals (TSXV: ADM) and
Keegan Resources (TSXV: KGN), both of which are years away from
production. We've singled out these two explorers due to the high
quality, large scale and relatively secure location of their respective
gold deposits.
1. Andina Minerals (TSXV: ADM). Shares: 64M issued, 81M fully diluted. Recent price: C$3.59
ADM gained 15% on higher-than-average volume on Friday, breaking its
downward trend and leaving little doubt that it bottomed at just below
C$3 during the week before last. Friday's surge was in response to good
drilling results announced after the close of trading on Thursday. More
good drilling-related news and an upgraded resource estimate are likely
over the next two months.
Buy at around C$3.50.
2. First Majestic Silver (TSX: FR). Shares: 63M issued, 77M fully diluted. Recent price: C$4.03
FR continues to make steady progress with regard to increasing the
silver production and resources at its Mexican mines. This year's
silver production is expected to be around 5M ounces.
Buy following a pullback to the mid-C$3 area or a daily close above C$4.20.
3. Great Basin Gold (AMEX: GBN, TSX: GBG). Shares: 203M issued, 245M fully diluted. Recent price: US$2.95
An emerging gold producer with development-stage projects in South
Africa and the US. It offers substantial leverage to gold due to the
relatively low valuation of its in-ground resources.
Buy the stock at US$2.55-2.75 and/or buy the warrants (TSX: GBG.WT)
below C$0.40. Note that the warrants are much riskier than the stock.
4. Keegan Resources (TSXV: KGN, AMEX: KGN). Shares: 26M issued, 35M fully diluted. Recent price: C$4.34
KGN was hit hard over the past couple of weeks due to
political-risk-related concerns -- Ghana's Mining Minister made some
comments implying that the government would attempt to obtain a higher
return for itself from its mining industry -- and the resultant sell
recommendation of another newsletter. Given what has recently
transpired in Ecuador and Venezuela it is both natural and appropriate
to pay more attention than ever to political risk, but we don't think
Ghana's government will do anything to seriously degrade the economics
of mining in that country. We therefore think that the recent fears
were overblown and created a terrific buying opportunity.
We highlighted KGN in last Wednesday's email alert when it was trading
at C$3.45 and in last week's Interim Update when it was trading at
C$3.72. It has since rebounded to the C$4.30s, but may pull back to the
mid-C$3 area if the gold-stock indices break to new lows over the
coming weeks. If such a pullback occurs it would be another buying
opportunity.
5. Minefinders Corp. (AMEX: MFN). Shares: 48M issued, 60M fully diluted. Recent price: US$10.46
A sizeable short position has built up in MFN, most likely in
anticipation of the company experiencing similar start-up problems at
its Dolores gold/silver mine over the remainder of this year to those
experienced by Gammon Gold over the past year. This means that MFN will
be given a hefty boost by a bout of short covering IF the mine start-up
goes relatively smoothly.
Buy at around US$9.50.
6. Metallica Resources (AMEX: MRB, TSX: MR). Shares: 93M issued, 119M fully diluted. Recent price: US$6.45
In our opinion: a 'must-own' gold stock. It hasn't pulled back very far
up until now, but a break to new lows by the HUI would probably result
in MRB dropping to US$5.75-6.00. If this happened it would constitute a
buying opportunity.
7. Northgate Minerals (AMEX: NXG, TSX: NGX). Shares: 255M. Recent price: US$2.94
On a cash flow and earnings basis, NXG is the most under-valued gold stock we know of.
Buy below US$3.00.
8. Resolute Mining (ASX: RSG). Shares: 278M issued, 280M fully diluted. Recent price: A$1.97
2008 should be a good year for RSG as the company brings its Syama gold
project into production and transitions from a junior to a mid-tier
miner.
Buy below A$2.00
As also promised in last week's Interim Update, here is a shortlist of
potential future TSI gold/silver stock selections and the prices at
which we would, or might, be interested in adding them. It's unlikely
that these prices will be attained over the next few weeks unless the
HUI drops to at least the mid-300s.
| Symbol |
Market |
Company Name |
Current Price
|
Comment |
| ATW |
TSXV |
ATW Ventures |
C$0.83
|
Would probably add at C$0.75 |
| EDV |
TSX |
Endeavour Mining Capital
|
C$6.95
|
Would probably add at C$6.35 |
| FVI |
TSXV |
Fortuna Silver
|
C$1.97
|
Would definitely add at C$1.60 |
| GSS |
AMEX |
Golden Star Resources |
US$3.30 |
Would consider adding at US$3.00 |
| HL |
NYSE |
Hecla Mining |
US$10.29
|
Would consider adding at around US$9.00 |
| RGLD |
NYSE |
Royal Gold
|
US$27.33 |
Would definitely add at US$24.00 |
| TGB* |
AMEX |
Taseko Mines
|
US$5.17 |
Would definitely add at US$3.50 |
| WGW |
AMEX |
Western Goldfields |
US$2.82 |
Would probably add at US$2.25 |
*TGB is a copper producer
Tax consequences
When we present investing/trading ideas at TSI we never take income-tax
consequences into account, for these two main reasons: First,
taxation-related implications/issues are outside TSI's scope and
outside our area of knowledge. Second, our subscribers are spread over
more than 30 tax jurisdictions, so we couldn't possibly provide
relevant tax-related information that catered for all, or even most, of
our subscribers even if we wanted to. The bottom line is that
subscribers must do their own research as far as personal income tax
issues are concerned.
Personal tax-related matters could be important considerations when it
comes to investments such as the Canadian energy trusts and Exchange
Traded Notes (ETNs). As far as we tell from reading the info at
http://www.ipathetn.com/Exchange-Traded-Notes-taxation.jsp#q1, the
livestock ETN (COW) that was added to the TSI Stocks List a couple of
weeks ago should be treated like a common stock for tax purposes; but
because they are debt securities ETNs can sometimes have unexpected tax
consequences.
Chart Sources
Charts appearing in today's commentary
are courtesy of:
http://stockcharts.com/index.html
http://www.futuresource.com/
http://www.decisionpoint.com/
http://www.fullermoney.com/

|
