|
-- Weekly Market Update for the Week Commencing
5th May 2014
Big Picture
View
Here is a summary of our big picture
view of the markets. Note that our short-term views may differ from our
big picture view.
In nominal dollar terms, the BULL market in US Treasury Bonds
that began in the early 1980s ended in 2012. In real (gold)
terms, bonds commenced a secular BEAR market in 2001 that will continue
until 2018-2020. (Last
update: 20 January 2014)
The stock market, as represented by the S&P500 Index,
commenced
a secular BEAR market during the first quarter of 2000, where "secular
bear market" is defined as a long-term downward trend in valuations
(P/E ratios, etc.) and gold-denominated prices. This secular trend will bottom sometime between 2014 and 2020.
(Last update: 22 October 2007)
A secular BEAR market in the Dollar
began during the final quarter of 2000 and ended in July of 2008. This
secular bear market will be followed by a multi-year period of range
trading.
(Last
update: 09 February 2009)
Gold commenced a
secular bull market relative to all fiat currencies, the CRB Index,
bonds and most stock market indices during 1999-2001.
This secular trend will peak sometime between 2014 and 2020.
(Last update: 22 October 2007)
Commodities,
as represented by the Continuous Commodity Index (CCI), commenced a
secular BULL market in 2001 in nominal dollar terms. The first major
upward leg in this bull market ended during the first half of 2008, but
a long-term peak won't occur until 2014-2020. In real (gold) terms,
commodities commenced a secular BEAR market in 2001 that will continue
until 2014-2020.
(Last
update: 09 February 2009)
Copyright
Reminder
The commentaries that appear at TSI
may not be distributed, in full or in part, without our written permission.
In particular, please note that the posting of extracts from TSI commentaries
at other web sites or providing links to TSI commentaries at other web
sites (for example, at discussion boards) without our written permission
is prohibited.
We reserve the right to immediately
terminate the subscription of any TSI subscriber who distributes the TSI
commentaries without our written permission.
Outlook Summary
Market
|
Short-Term
(1-3 month)
|
Intermediate-Term
(6-12 month)
|
Long-Term
(2-5 Year)
|
|
Gold
|
Bullish
(26-Mar-14) |
Bullish
(26-Mar-12) |
Bullish
|
|
US$ (Dollar Index)
|
Bearish
(16-Apr-14) |
Bearish
(27-Jan-14) |
Neutral
(19-Sep-07) |
|
Bonds (US T-Bond)
|
Bullish
(11-Dec-13)
|
Neutral
(18-Jan-12)
|
Bearish |
|
Stock Market
(DJW)
|
Bearish
(07-Apr-14) |
Bearish
(28-Nov-11) |
Bearish
|
|
Gold Stocks
(HUI)
|
Bullish
(03-Mar-14) |
Bullish
(23-Jun-10) |
Bullish
|
|
Oil |
Bearish
(12-Mar-14) |
Neutral
(31-Jan-11) |
Bullish
|
|
Industrial Metals
(GYX)
|
Neutral
(17-Feb-14) |
Bullish
(28-Apr-14) |
Bullish
(28-Apr-14) |
Notes:
1. The date shown below the current outlook is when the most recent outlook change occurred.
2. "Neutral", in the above table, means that we either don't have a
firm opinion or that we think risk and reward are roughly in balance with respect to the timeframe in question.
3. Long-term views are determined almost completely by fundamentals,
intermediate-term views by
fundamentals, sentiment and technicals, and short-term views by sentiment and
technicals.
The T-Bond continues to
surprise the crowd
The market for long-dated US Treasuries has
defied the expectations of most pundits so far this year. The refrain at the
beginning of the year was that T-Bond yields were bound to rise, but, instead,
bond yields have trended lower. The downward trend in yields goes hand-in-hand
with the upward trend in the price of the iShares 20+ Year Treasury Bond Fund (TLT).
The question is: with the following daily chart showing that TLT is now
short-term overbought and nearing channel resistance, is the rally in T-bond
prices and the decline in T-bond yields almost over?
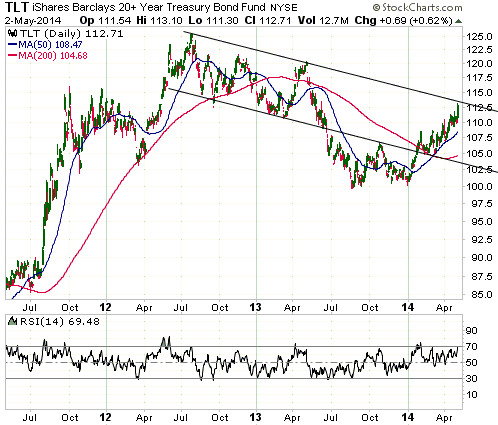
The short answer is: probably not. The longer answer is that while a multi-week
consolidation to eliminate the overbought condition could begin at any time,
there are good reasons to believe that significant additional gains in the TLT
price will occur over the next few months and that a short-term bullish outlook
is still appropriate (we have been short-term bullish on this market since
December).
One reason is sentiment. Despite the 4-month upward trend in the prices of
T-bonds and T-notes, most pundits continue to predict higher interest rates
(lower bond prices) and speculators collectively remain bearish in anticipation
of lower prices. We know that this is so due to the substantial speculative
net-short position in the combination of T-bond and T-note futures revealed by
the COT data. Based on the historical record it's unlikely that the upward trend
will end until after speculators, as a group, have become net-long.
Another reason is that safe havens, including both the Treasury market and the
gold market, will likely be boosted by stock market weakness over the next 6
months.
The Stock
Market
Due to the market action late last week it
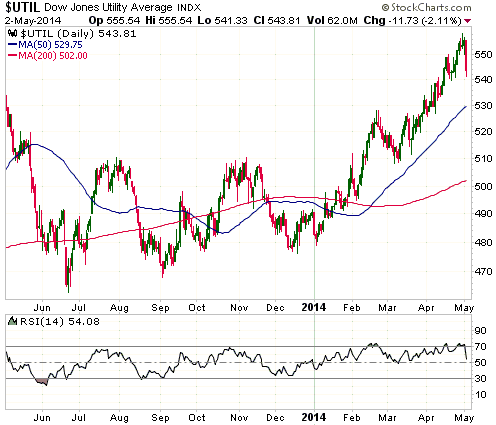
is appropriate for us to re-visit the Dow Jones Utility Average (UTIL), even
though we discussed this particular index in last week's Interim Update.
In the 30th April Interim Update we wrote:
"...the Dow Jones Utility Average (UTIL) has finally exceeded its 2007 peak.
However, it is very 'overbought' and is possibly tracing out a similar topping
pattern to the one that unfolded during 2007-2008. We are referring to the fact
that the UTIL made a high during Q2-2007 and then a marginally higher high in
Q4-2007 before rolling over into a major decline. This time around it made a
high in Q2-2013 and a marginally higher high in Q2-2014.
We certainly do not think that something akin to the 2008 crash lies in store
for the UTIL over the coming several months, but we do suspect that this year's
top is being put in place right now.
With the UTIL having recently 'gone parabolic', a daily close below the 50-day
MA would now be a reliable signal that a top of at least intermediate-term
importance was in place."
A daily close below the 50-day MA would be a reliable signal that an important
top is in place, but last Friday's downward reversal currently looks like it
could have longer-term significance. The reason is that it occurred in the face
of falling bond yields (the 'utes' benefit from lower long-term interest rates)
and OK economic data.
The S&P500 Index (SPX) ended last week within 1% of its all-time high, so it
won't be surprising if the SPX makes a new high this week. However, a new high
by the SPX over the days ahead will definitely not be confirmed by the NASDAQ100
Index, the NASDAQ Composite Index or the Russell2000 Index, and will probably
not be confirmed by the Dow Utility Average.
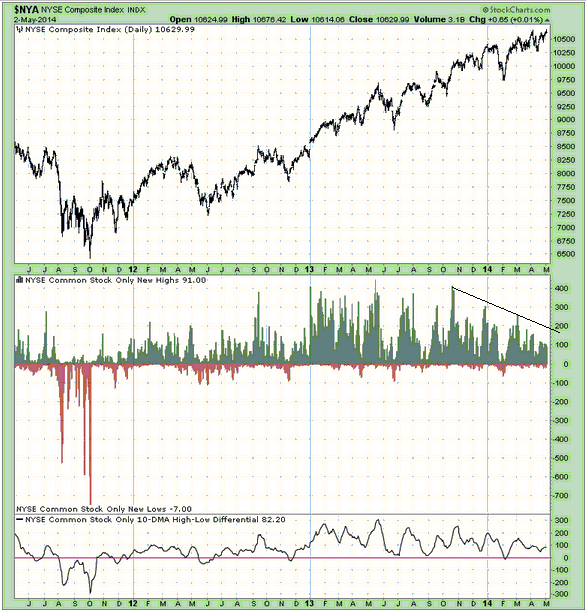
It is also worth noting that the number of individual stocks making new 52-week
highs has not confirmed any of the new 52-week highs in the SPX over the past 6
months. In fact, the following chart shows that the number of individual NYSE
common stocks making new highs has been trending lower since October of last
year.
A narrowing of the advance tends to happen as a market approaches an important
peak.
This week's
important US economic events
| Date |
Description |
| Monday May 05 |
ISM Non-Mfg Index | | Tuesday
May 06 |
International Trade Balance | | Wednesday
May 07 |
Q1 Productivity and Costs
Consumer Credit | | Thursday
May 08 |
No important events scheduled
|
| Friday May 09 |
No important events scheduled |
Gold and
the Dollar
Gold and Silver
Gold fundamentals now bullish
The fundamental backdrop was unequivocally gold-bearish during the first half of
last year. Around the middle of last year it began to shift in gold's favour
with the upside breakout in the US yield-spread (the difference between 10-year
Treasury yields and 2-year Treasury yields) and the rolling over of the BKX/SPX
ratio, but at the beginning of this year it could best be described as mixed
(neither definitively bullish nor definitively bearish). It remained 'mixed'
throughout the first quarter, but due to two recent developments it is now
bullish. One of these developments is the downside breakout in the BKX/SPX ratio
discussed in last week's Interim Update. The other is the downside breakout in
the HYG/TLT ratio, a credit-spread indicator. HYG/TLT rises when credit spreads
are contracting (indicating rising economic confidence, which is bearish for
gold) and falls when credit spreads are expanding (indicating declining economic
confidence, which is bullish for gold).
Here is a chart comparing the gold price and the HYG/TLT ratio. The inverse
relationship of the past 3.5 years is clear.
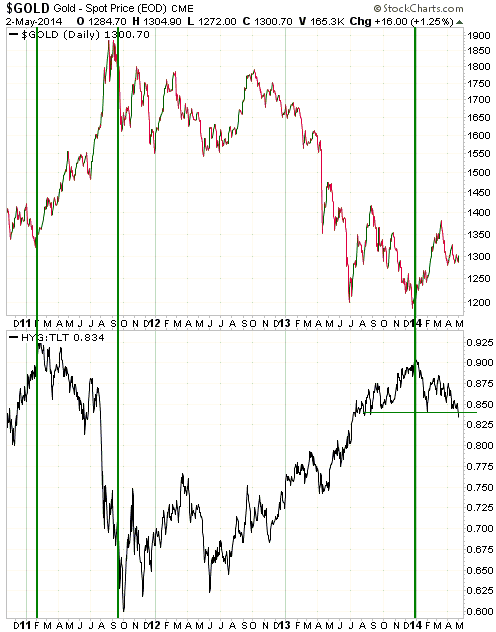
By the way, in addition to being a bullish omen for gold, last week's downside
breakout in the HYG/TLT ratio is a bearish omen for the broad stock market.
Current Market Situation
Trends in market prices almost never change in reaction to economic data, but
the market reaction to economic data can be informative. For example, the
posting last Friday of a superficially bullish (for the economy) US employment
report initially caused the US$ to rally and gold and T-Bonds to fall, but
prices quickly reversed and by the end of the day gold and T-Bonds had made
significant gains. The market reaction to Friday's economic news provides us
with additional evidence that gold's correction is over and that a new
short-term upward trend has begun.
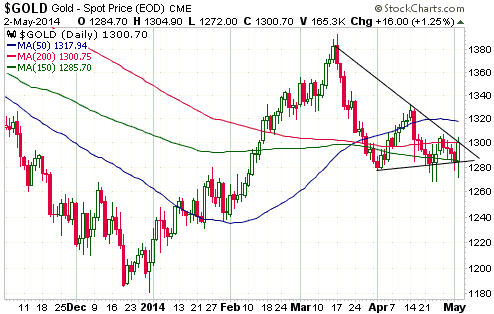
Due to the recent price action, gold's near-term price parameters are more
clearly defined. With reference to the following daily chart, notice that gold
has spiked below $1280 five times over the past two weeks without once closing
below this level. A daily close below $1280 could therefore now be used a 'stop'
for short-term bullish positions. Going the other way, a daily close above $1305
would now constitute an upside breakout that would provide further evidence of a
short-term trend reversal.
There will almost certainly be a breakout in the gold market in one direction or
the other during the first half of May. We obviously expect that the breakout
will be to the upside.
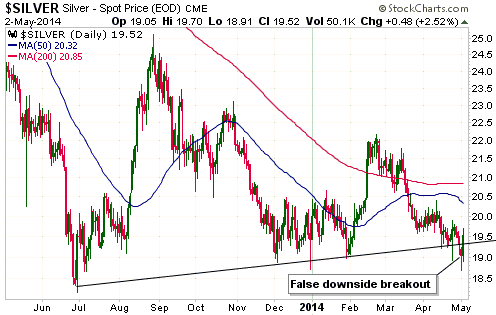
In the silver market there was a spike below intermediate-term support to a new
multi-month low during the second half of last week. This break below support
(see chart below) was quickly reversed, however, creating what currently looks
like a false downside breakout. So far this year, false downside breakouts have
marked the ends of downward trends in the A$, the C$, the copper market and now,
possibly, the silver market.
Increasing the potential significance of silver's Thursday-Friday spike to a new
low and upward reversal is that it happened on the 3-year anniversary of the
2011 major peak. In our experience, reversals in the precious metals and the
associated mining stocks that happen on anniversary dates tend to be important.
What we were saying in 2011
When the silver price was rocketing upward in April of 2011 there were obvious
signs that a large decline would soon begin. Many gold and silver bulls got
caught up in the excitement of the moment and ignored these signs, but we
weren't among them. We saw the signs that a large decline was coming and
repeatedly warned our readers during the weeks leading up to the ultimate price
top. Gold's run-up to its peak in August-September 2011 didn't generate such
obvious warning signs, but the yellow metal became sufficiently 'overbought' in
nominal currency terms and expensive in real terms to suggest that considerable
caution was warranted. We thought that it was a time for gold investors to be
hedging their positions and taking chips off the table, not a time for being
aggressive. It turned out that we greatly under-estimated the eventual magnitude
of gold's decline from its 2011 peak (due to our own analytical errors, not
market manipulation), but we were certainly not part of the "gold to da moon!"
chorus.
Getting more specific, below are examples from TSI commentaries of the warnings
and concerns we expressed near the 2011 tops in silver and gold. Our warnings
about the downside risk in silver were more definitive because the silver market
was far more stretched to the upside. We think that this is important
information for old (in terms of subscription time, not age) subscribers to
remember and recent subscribers to discover, because it is evidence that we will
not always be bullish on gold and silver.
First, here are some examples of what we were saying in the lead-up to the
April-May 2011 silver top:
- From the 11th April 2011 Update:
"...for insurance purposes we bought some more SLV July put options when
silver moved above $40 on Friday and our plan is to add another tranche of
'insurance puts' if silver moves up to around $43 within the next few weeks.
There is a decent chance that the next intermediate-term correction will take
the silver price down by 35%-50% from whatever intermediate-term peak it happens
to make."
- From the 19th April 2011 Update:
"...the silver/gold ratio will likely provide us with the most reliable
signal of a downward trend reversal -- by diverging bearishly from the gold
price over a period of at least 2 weeks or by quickly declining by at least 7%.
Such a signal hasn't yet been generated, but we suspect that it will be
generated by mid May."
- From the 24th April 2011 Update:
"...the direction of the silver/gold ratio over the past several months is
consistent with the long-term relationship between this ratio and economic
confidence (usually, silver does better than gold during periods when economic
confidence is rising and the broad stock market is strong). However, the
magnitude of the advance has gone beyond the bounds of normality due to silver
becoming the focal point of inflation-induced speculation. In 1998-2000 it was
the tech sector of the stock market, in 2004-2005 it was the homebuilding sector
of the stock market, in 2007-2008 it was the oil market, and now it is the
silver market.
We can be confident about HOW silver's parabolic advance will end (it will end
in a spectacular decline), but we can't be confident about WHEN it will end. Our
guess is that it will end by the middle of next month [May-2011]."
- From the 27th April 2011 Update:
"Market Vane's survey indicates that on Monday 25th April, 97% of traders
were bullish on silver. This is the sort of sentiment extreme that usually only
occurs in the vicinity of a very important top. It doesn't mean that an
important top is already in place, but it strongly suggests that traders and
investors should approach the silver market very cautiously.
Both silver and the silver/gold ratio are in parabolic blow-off mode. As
mentioned in our 24th April market update, we can be confident about HOW these
parabolic advances will end (they will end in spectacular declines), but we
can't be confident about WHEN they will end.
Our guess is that the blow-offs will end by the middle of next month [by the
middle of May-2011]. This guess is consistent with the marked increase in
volatility that has occurred over the past three trading days, because the price
action tends to encompass greater swings as an important top is approached.
However, there is no evidence, yet, that a top is in place. In particular, we
note that on a daily closing basis the silver/gold ratio made a new high for the
move on Wednesday 27th April, meaning that as at the close of trading on
Wednesday the short-term trend was still heading upward.
Gold is not stretched to the upside, but it is still likely to reach an
intermediate-term peak of its own within three weeks of a peak in the silver
market.
To hedge our exposure to precious-metals-related investments, we are continuing
to accumulate SLV July put options in response to surges in the silver price."
- From the email alert sent after the close of trading on Monday 2nd May
2011 (the first day of silver's bear market):
"We interpret Monday's sharp decline in the silver/gold ratio as clear-cut
evidence that an intermediate-term peak is now in place for this ratio."
-
From the 4th May 2011 Update:
"...the historical record suggests that silver/gold's recent peak will hold
for at least 2 years."
Second, here are some examples of what we were saying in the lead-up to the
August-September 2011 gold top:
- From the 1st August 2011 Update:
"...US residential property is nearing a 100-year low in gold terms. As a
matter of fact, if the gold price were to rise another 30% while house prices
remained roughly the same, the average US home would be as cheap, in gold terms,
as it was at the depths of the 1930s' Great Depression.
The house/gold ratio will possibly overshoot its 1934 and 1980 lows this time
round, but the point is that gold is no longer cheap relative to houses."
- From the 17th August 2011 Update:
"Gold has returned to the vicinity of last week's high, so we have begun to
scale into a put-option-based insurance position."
- From the 22nd August 2011 Update:
"The gold market has 'gone parabolic' over the past few weeks. This type of
price action usually only happens near the END of an upward trend, but there is
no telling exactly where the end will be."
And: "...the downside risk is increasing as rapidly as the price. If gold
surges to $2,000/oz over the coming fortnight then the odds will be heavily in
favour of the next correction being the intermediate-term variety. An
intermediate-term correction is one that lasts at least 6 months and takes the
price down to the 200-day moving average or lower."
And: "Gold's upside blow-off has pulled silver out of its range of the past
few months, but silver's risk/reward hasn't significantly changed. The risk of a
large gold correction has increased and will become greater still if gold's
upside blow-off continues for another couple of weeks."
- From the 12th September 2011 Update:
"...the gold price is now quite high in real terms. We note, in particular,
that gold didn't reach the inflation-adjusted equivalent of its current price
until the final few weeks of the 1979-1980 blow-off (in today's money, gold was
at $1690/oz at the end of November-1979 and $2186/oz at the end of
December-1979). Due to the debilitating effects of monetary inflation on the
economy's productivity over the intervening years, it's likely that gold will
eventually exceed its Jan-1980 peak in real terms. It would be wrong, though, to
think that gold is still a bargain."
Gold Stocks
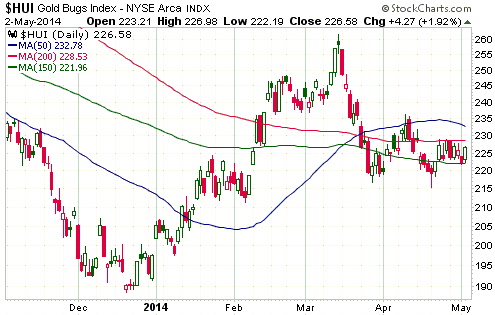
We continue to suspect that the gold-mining sector's short-term correction ended
on 21st April when the HUI spiked down to a marginal new correction low of 215
and then reversed upward. However, the evidence that the correction is complete
is not yet conclusive.
As illustrated by the following daily chart, the HUI has now spent eight
consecutive trading days oscillating between its 150-day and 200-day moving
averages. As a result of this price action, a daily close above the 200-day MA
(229) would now constitute the next piece of evidence that the correction is
over. Also as a result of this price action a daily close below the 150-day MA
would warn that our interpretation of the 21-22 April reversal was wrong,
although to minimise the chance of being 'whipsawed' we suggest using a daily
close below 215 as a 'stop' for short-term bullish positions.
The Currency Market
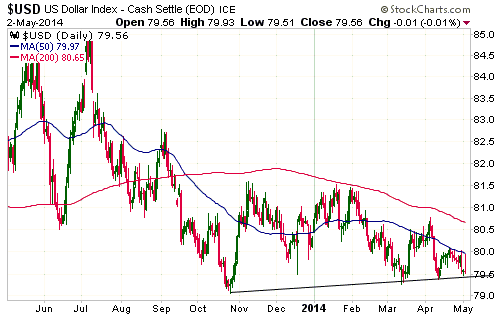
Last Friday's bullish reversals in the gold and T-Bond markets following the US
employment news was accompanied by a bearish reversal in the Dollar Index. The
knee-jerk reaction to the employment news took the Dollar Index up to its 50-day
MA at around 80. It then gave up its news-related gains and ended the day flat
-- precariously poised just above intermediate-term support.
We expect the Dollar Index to break below support at 79.0-79.5 this month.
By the way, imagine what the reaction of the gaggle of manipulation-centric gold
commentators would have been if, rather than positive employment data being
followed by a downward reversal in the Dollar Index, negative employment data
had been followed by a downward reversal in the gold price. DATA (the Dollar
Anti-Trust Action Committee) is up in arms about Friday's blatant downward
manipulation of the US$ and is demanding an investigation.
Updates
on Stock Selections
Notes: 1) To review the complete list of current TSI stock selections, logon at
http://www.speculative-investor.com/new/market_logon.asp
and then click on "Stock Selections" in the menu. When at the Stock
Selections page, click on a stock's symbol to bring-up an archive of
our comments on the stock in question. 2) The Small Stock Watch List is
located at http://www.speculative-investor.com/new/smallstockwatch.html
 Company
news/developments for the week ended Friday 2nd May 2014: Company
news/developments for the week ended Friday 2nd May 2014:
[Note: AISC = All-In Sustaining Cost, FS = Feasibility Study, IRR =
Internal Rate of Return, MD&A = Management Discussion and Analysis,
M&I = Measured and Indicated, NAV = Net Asset Value, NPV(X%) = Net
Present Value using a discount rate of X%, P&P = Proven and
Probable, PEA = Preliminary Economic Assessment, PFS =
Pre-Feasibility Study]
*Batero Gold (BAT.V) issued its mandatory reports for the quarter
ended 28th February 2014. Based on these reports, the company
probably now has about $13.5M of working capital. This amounts to
about C$0.15/share.
BAT is effectively in hibernation pending a higher gold price. Its
cash burn rate is low, but it probably won't generate market-moving
news anytime soon.
The large discount to its cash at which BAT is now trading suggests
that the stock could be a reasonable short-term speculation in the
C$0.10-C$0.11 range (buy at C$0.11 or lower with the aim of selling
at around C$0.15), but liquidity is minimal.
*Dragon Mining (DRA.AX) reported its results for the March
quarter. The company produced 16.4K ounces of gold at its operations
in Finland and Sweden at a cash cost of US$1289/oz. The high cash
cost is somewhat misleading, because some of the costs that were
accounted for in the March quarter were actually incurred during
previous quarters. Consequently, DRA managed to add $3.5M of cash to
its balance sheet during the March-2014 quarter despite the high
cost of production.
DRA will probably need a gold price of at least $1500/oz to be
consistently profitable, but with working capital at quarter-end of
$13.4M the company does not appear to be in danger of suffering a
'cash crunch' in the short term. Furthermore, the new management
appears to be taking the right steps to ensure the company's
survival. The question we are wrestling with is: does it make sense
to persevere with DRA, or are there better uses of our time and
money?
*Sabina Gold and Silver (SBB.TO) reported that it will donate
money to assist the local Inuit population in the region of its Back
River project. This will involve a) an initial payment of $1.4M into
a trust that has been established to fund "community initiatives" in
the region, b) the provision of financial assistance to the
organisation representing the Inuit people to enable it to fulfill
its role in the back River environmental assessment and permitting,
and c) the payment of 3% of Sabina's net proceeds from the Hackett
River silver royalty.
This is an unavoidable cost, because mine permitting and development
will require the support of the local population.
*UEX Corp. (UEX.TO), a uranium explorer with two projects in
Athabasca, issued its MD&A and financial statements for the March
quarter. The financial statements showed that UEX has about $8M of
working capital, which should be enough to fund the company for at
least another 12 months.
 List
of candidates for new buying List
of candidates for new buying
From within the ranks of TSI stock selections, the best candidates for new
buying at this time are:
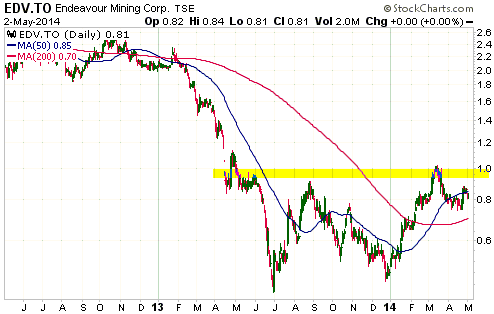
1) EDV.TO (last Friday's closing price: C$0.81).
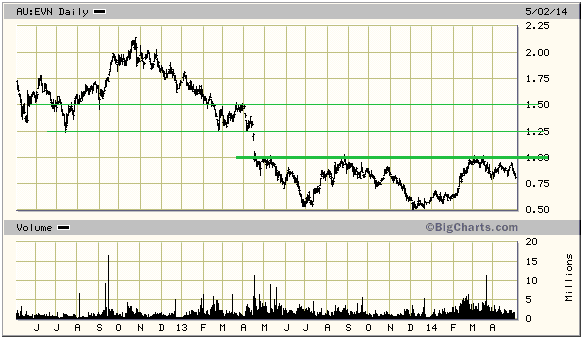
2) EVN.AX (last Friday's closing price: A$0.81).
3) PG.TO (last Friday's closing price: C$2.03).
4) RIOM (last Friday's closing price: US$1.98).
5) RSG.AX (last Friday's closing price: A$0.58).
 New
short-term trading positions New
short-term trading positions
This is a good time to establish some additional short-term gold-stock trading
positions, because the recent price action increases the probability that the
gold sector's correction is over and more clearly defines the risk management
parameters. We have therefore added short-term positions in Endeavour Mining (EDV.TO)
and Evolution Mining (EVN.AX) to the TSI List at last Friday's closing prices of
C$0.81 and A$0.81, respectively. These stocks were already in the TSI List as
longer-term positions, so they now appear in both the "Gold and Silver" part of
the List and the "Trading Positions" part of the List.
We have selected EDV.TO and EVN.TO for short-term (1-3 month expected holding
period) trades for two main reasons. First, as profitable producers with solid
balance sheets and multiple mines they have relatively low risk. Second, their
charts (see below) suggest that large basing patterns are close to being
completed.
Both stocks have resistance at $1.00 and support at around $0.75. In each case
$1.50 would be the chart-related price objective created by a break above $1.00,
but we would probably take profits in the $1.20s.
Both positions would be 'stopped out' by a daily HUI close below 215.
 OK
to accumulate some long-dated gold-stock call options OK
to accumulate some long-dated gold-stock call options
The TSI Stocks List contains January-2016 $5.00 call options in Gold Fields Ltd
(GFI) and Kinross Gold (KGC). It would be reasonable for high-risk speculators
to take new positions or add to existing positions in these options near current
prices.
GFI has been one of the strongest gold-mining stocks over the past two months
and is not far from its March high. KGC, on the other hand, has been the weakest
of the major gold-mining stocks over the past two months, thanks to the general
perception that the risk of investing in Russia has risen dramatically (KGC's
most profitable mining assets are located in Russia). We think that
Russia-related risk has temporarily been overblown, although we do believe that
Russia is a high-risk country for reasons that have nothing to do with the
Ukraine conflict.
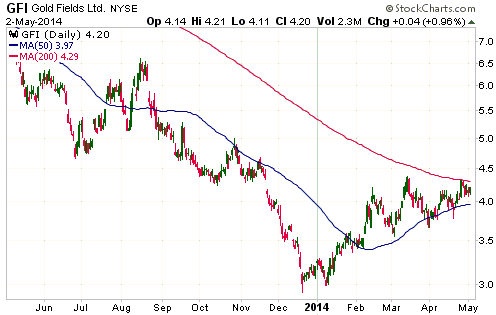
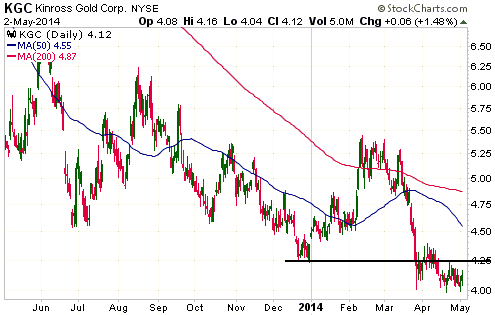
Chart Sources
Charts appearing in today's commentary
are courtesy of:
http://stockcharts.com/index.html
http://bigcharts.marketwatch.com/

|

