|
-- Weekly Market Update for the Week Commencing 5th October 2009
Big Picture
View
Here is a summary of our big picture
view of the markets. Note that our short-term views may differ from our
big picture view.
In nominal dollar terms, the BULL market in US Treasury Bonds
that began in the early 1980s will end by mid-2010. In real (gold)
terms, bonds commenced a secular BEAR market in 2001 that will continue
until 2014-2020. (Last
update: 09 February 2009)
The stock market, as represented by the S&P500 Index, commenced
a secular BEAR market during the first quarter of 2000, where "secular
bear market" is defined as a long-term downward trend in valuations
(P/E ratios, etc.) and gold-denominated prices. This secular trend will bottom sometime between 2014 and 2020. (Last update: 22 October 2007)
A secular BEAR market in the Dollar
began during the final quarter of 2000 and ended in July of 2008. This
secular bear market will be followed by a multi-year period of range
trading. (Last
update: 09 February 2009)
Gold commenced a
secular bull market relative to all fiat currencies, the CRB Index,
bonds and most stock market indices during 1999-2001. This secular trend will peak sometime between 2014 and 2020. (Last update: 22 October 2007)
Commodities,
as represented by the Continuous Commodity Index (CCI), commenced a
secular BULL market in 2001 in nominal dollar terms. The first major
upward leg in this bull market ended during the first half of 2008, but
a long-term peak won't occur until 2014-2020. In real (gold) terms,
commodities commenced a secular BEAR market in 2001 that will continue
until 2014-2020. (Last
update: 09 February 2009)
Copyright
Reminder
The commentaries that appear at TSI
may not be distributed, in full or in part, without our written permission.
In particular, please note that the posting of extracts from TSI commentaries
at other web sites or providing links to TSI commentaries at other web
sites (for example, at discussion boards) without our written permission
is prohibited.
We reserve the right to immediately
terminate the subscription of any TSI subscriber who distributes the TSI
commentaries without our written permission.
Outlook Summary
Market
|
Short-Term
(0-3 month)
|
Intermediate-Term
(3-12 month)
|
Long-Term
(1-5 Year)
|
Gold
|
Bullish
(02-Sep-09)
|
Bullish
(12-May-08)
|
Bullish
|
US$ (Dollar Index)
|
Neutral
(28-Sep-09)
| Neutral
(02-Sep-09)
|
Neutral
(19-Sep-07)
|
Bonds (US T-Bond)
|
Neutral
(28-Sep-09)
|
Neutral
(09-Sep-09)
|
Bearish
|
Stock Market (S&P500)
|
Bearish
(21-Sep-09)
|
Bearish
(11-May-09)
|
Bearish
|
Gold Stocks (HUI)
|
Neutral
(20-May-09)
|
Neutral
(16-Sep-09)
|
Bullish
|
| Oil | Neutral
(02-Sep-09)
| Bearish
(25-May-09)
| Bullish
|
Industrial Metals (GYX)
| Bearish
(21-Sep-09)
| Bearish
(25-May-09)
| Bullish
|
Notes:
1. In those cases where we have been able to identify the commentary in
which the most recent outlook change occurred we've put the date of the
commentary below the current outlook.
2. "Neutral", in the above table, means that we either don't have a
firm opinion or that we think risk and reward are roughly in balance with respect to the timeframe in question.
3. Long-term views are determined almost completely by fundamentals,
intermediate-term views by giving an approximately equal weighting to
fundmental and technical factors, and short-term views almost
completely by technicals.
Elements of the inflation/deflation issue
We have written a great deal
about the inflation-versus-deflation issue in TSI commentaries over the
years and we will maintain a strong focus on it in the future. The
reason is that under the current monetary system -- a system that
enables money and credit to be expanded independently of real savings
-- the investment landscape will often be dominated by inflation or
deflation (as the case may be), or by inflation/deflation expectations.
Over the past 10 years we have argued -- ad nauseam, some would say --
that there will be inflation and nothing but inflation for the
foreseeable future, with periodic deflation scares serving only to
provide the cover/justification for even more monetary inflation. After
taking into account our arguments and the contrary arguments it may be
possible for our readers to confidently conclude which view makes the
most sense, and to act accordingly. Alternatively, after weighing all
aspects of the issue a person may reasonably conclude that the outcome
(inflation or deflation) is not clearly discernable, and therefore
decide to 'sit on the fence' for now. Fortunately, there is no law that
forces you to bet everything on one particular outcome. At least, there
isn't yet, although we wouldn't be surprised if lawmakers were working
on it.
As far as we can tell, all the important elements of the
inflation/deflation debate have been dealt with in copious detail in
previous TSI reports. For something a little different, in today's
report we present a list that contains many of these elements -- in no
particular order -- without much in the way of supporting explanation.
The explanations can be found in previous TSI commentaries. In fact,
every one of the following points has been discussed in a TSI
commentary within just the past two months.
Elements of the Inflation/Deflation Issue:
1. There is no longer any correlation between bank reserves and the
economy-wide money supply; that is, the "money multiplier" taught in
economics classes no longer applies.
2. The government-Fed combination can increase the money supply to
almost any extent, independently of the private banks; that is,
monetary inflation does not rely on the expansion of credit via the
private banking industry.
3. The Fed is not constrained in any way by the need/desire to maintain a strong balance sheet.
4. The central bank is capable of monetising almost anything, meaning
that the central bank can increase the money supply without increasing
the economy-wide quantity of debt.
5. A motivated central bank will always be able to increase the money
supply, and growth in the money supply always leads to higher prices
somewhere in the economy.
6. The bond and currency markets could eventually impose practical
limits on government borrowing and monetary inflation, but the
government will be free to borrow and the Fed will be free to inflate
as long as the bond and currency markets remain cooperative.
7. A corollary of point 5 is that the probability of the US
experiencing deflation will remain low until after the T-Bond and/or
the US$ tank.
8. There are long and variable time delays between changes in the money
supply and the appearance of the price-related effects of these
changes. This leads to an inverse relationship between the rate of
monetary inflation and the fear of inflation, because the average
person's fears/expectations are based on the effects of previous
money-supply changes as opposed to what's currently happening on the
monetary front.
9. An increase in the general price level is not the most important
effect of monetary inflation. Of far greater importance: monetary
inflation changes the STRUCTURE of the economy in an adverse way, by a)
distorting relative prices, leading to mal-investment on a grand scale,
and b) transferring undeserved benefits to the first users of the new
money at the expense of everyone else.
10. Because monetary stimulus changes the structure of the economy its
bad effects cannot be cancelled-out by the subsequent withdrawal of the
stimulus. Instead, the distortions/wastage caused by monetary stimulus
will be revealed after the flow of new money is restricted. An attempt
to sustain the stimulus indefinitely, and thus avoid the collapse that
inevitably follows a period of inflation-fueled 'growth', will end in
hyperinflation.
11. "Money velocity" is a redundant concept at best and a very
misleading one at worst. The same can be said about the famous Equation
of Exchange (MV = PT).
12. Falling prices are never a problem -- they are either the natural
consequence of increasing productivity (real economic growth) or part
of the solution to a problem (in the case of a bursting credit bubble).
13. Credit expansion can only foster sustainable economic growth when
it involves the lending of real savings by private individuals or
corporations.
14. Economic growth is driven by savings and production, not consumer spending.
15. The government and the central bank have no real capital or wealth
that can be used to help the economy in times of trouble. Therefore,
monetary and fiscal "stimulus" programs involve stealing from one set
of people and giving to another set of people. Obviously, the economy
cannot really be strengthened by large-scale theft.
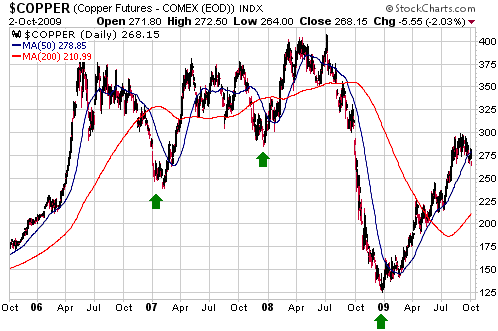
Quick note on the copper market
A daily chart of the copper price is displayed below. The green arrows
on the chart indicate the three most important price lows of the past
three years.
During each of the past three years, the copper market has peaked
during July-October and then trended lower to an intermediate-term
bottom during December-January. The smallest decline from the
July-October peak to the December-January low was 25%.
Recent price action in the copper market suggests that this year's
July-October peak is in place and that a short-term downward trend has
begun. Based on the way this market has cycled over the past three
years we expect that the new downward trend will continue until around
year-end. Given that the copper market and the stock market have risen
together since early in the year, this expectation is supported by the
stock market's recent downward reversal.
If copper does no worse than match the smallest peak-to-trough decline
of the past three years, then the December-January low will be around
$2.25.
The Stock
Market
Current Market Situation
Below is a DecisionPoint.com chart of the NYSE Composite Index and the
NYSE Common-Stock-Only McClellan Oscillator (MO). Notice that even
though the pullback from the 22nd September peak has been fairly minor
to date, it has caused the MO to become as 'oversold' as it was at the
March bottom. The NASDAQ's MO is nearing a similar extreme.
Note: The MO is based on market breadth (advancing stocks minus
declining stocks), so it can become 'overbought' or 'oversold'
independently of the senior stock indices. For example, the MO can
reach an 'oversold' extreme even though senior stock indices such as
the S&P500 are not remotely close to being 'oversold'.
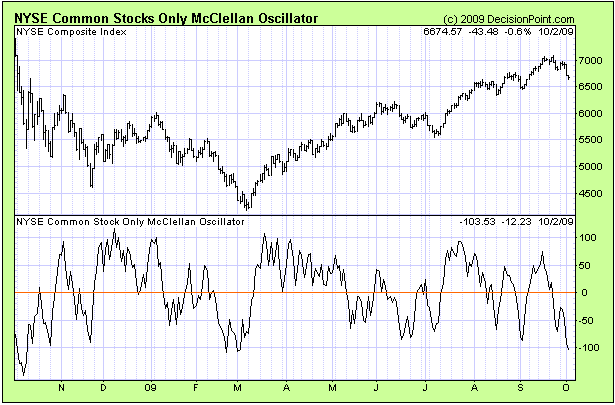
A downward spike in
the NYSE's MO to an extremely low level (-80 or lower) does not usually
coincide with a significant price low. Rather, extreme lows for the MO
tend to occur in advance of price lows. And over the past three years,
the time from an extreme low in the NYSE's MO to a low for the NYSE
Composite Index has generally been 1-3 weeks. In other words, the MO's
message is that the stock market is probably 1-3 weeks away from a
short-term price low.
The next short-term price low will mark either the end of another
routine correction within a continuing post-crash rebound, or, more
likely, the end of the INITIAL decline in a larger-degree downturn. In
the latter case, the current (initial) decline would be followed by a
rebound to test the September peak and then another decline to below
the October low.
Economic Data
We don't normally devote any space to discussing the economic
statistics reported by governments because the reported numbers are
generally either totally bogus or backward-looking. For example, GDP
numbers and so-called measures of inflation such as the CPI fall into
the "totally bogus" category, while consumer sentiment and retail sales
numbers may well be valid but tell you nothing about the future.
However, the US monthly employment numbers reported last Friday warrant
a brief mention.
Although the employment data say more about the past than the future
and are subject to large errors/revisions, they are less distorted by
monetary and fiscal stimulus than some of the other high-profile data.
For example, positive GDP growth numbers can be concocted via the
injection of new money even while the economy is shrinking, but it's
difficult to show job growth where none exists. In other words, at a
time when there is a lot of monetary inflation the picture painted by
the employment numbers will likely be more accurate than that painted
by the GDP numbers.
The September employment data showed that while the pace of
deterioration continues to slow, the US economy is still haemorrhaging
jobs. Moreover, it showed that the average work week fell from 33.1
hours to 33.0 hours, a new ALL-TIME low. This is significant because
employers will almost certainly increase the hours of their existing
workers before they start hiring new workers.
Some analysts have pointed out that the current employment situation is
nowhere near as bad as it got during the 1930s, as if this were a
reason for optimism. Well, the fact is that the US unemployment rate
was 8.7% during 1930 (the first year of the Great Depression), versus
9.8% or 17.0% now (depending on whether discouraged and partly attached
workers are counted). The current unemployment rate is therefore no
cause for optimism. It should also be noted that the extraordinarily
high (28%) unemployment rate reached at the peak of the 1930s
depression was due to the government's efforts to prop-up wages and
reduce production (the government deliberately set about reducing
production based on the idiotic notion that less supply would lead to
higher prices, and, therefore, a stronger economy). If similar policies
are going to be implemented this time around then the unemployment rate
is destined to move MUCH higher.
This week's
important US economic events
| Date |
Description |
Monday Oct 05
| ISM Non-Manufacturing Index
| | Tuesday Oct 06 | No important events scheduled
| | Wednesday Oct 07
| Consumer Credit
| | Thursday Oct 08
| No important events scheduled
| | Friday Oct 09
| Trade Balance
|
Gold and
the Dollar
Gold and Silver
As mentioned in last week's Interim Update, it looks like gold's price
correction is complete and that a rise to new highs has begun. But even
if this is not the case, we expect that any additional near-term
weakness will be relatively minor and that December gold will hold
above support at $974 on a daily closing basis.
Silver and gold will probably peak at the same time, so we are also
monitoring silver for clues regarding gold's situation. One of the
interesting things about the silver market is that it usually doesn't
leave you guessing for long after an important peak has been put in
place. What we mean is that silver usually reaches a peak and then
immediately plunges. Furthermore, it typically reaches a peak via an
almost-vertical advance. There was a sharp advance leading up to the
September peak, but the ensuing decline has been steadier, to date,
than would normally be the case if the peak had been of
intermediate-term significance.
The following chart shows that silver is presently testing former
resistance (now support) at $16. This support could provide the floor
for the current correction, but for the short-term upward trend that
began in July the more important support lies at $15. Silver needs to
hold above $15.
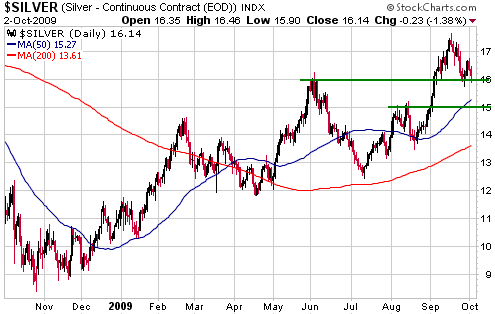
The silver/gold ratio
has turned downward over the past couple of weeks, which meshes with
the idea that the stock market's post-crash rebound is over (silver
usually trends lower relative to gold when the stock market is in an
intermediate-term decline). The relationship between the silver/gold
ratio and the broad stock market means that silver has considerably
greater downside risk than gold, although if the stock market's topping
process extends for many months -- a likely outcome, in our opinion --
then silver could at least hold its ground relative to gold for a while
yet.
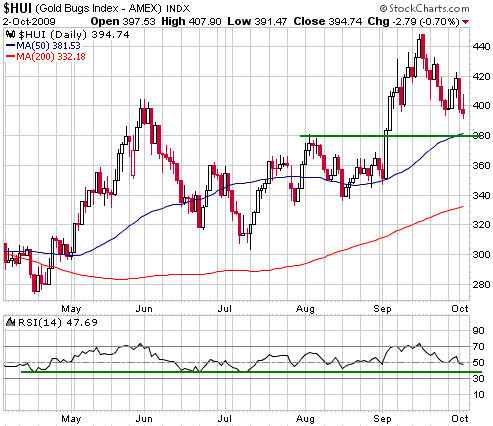
Gold Stocks
After solid up-days last Tuesday and Wednesday we weren't sure if the
gold sector's correction had ended at a higher level than originally
expected or there was additional downside in store. The HUI made a new
low for the move on Friday, so it was obviously the latter.
If this is a routine short-term correction (our assumption) then it
will probably end this week. Ideally, there will be some additional
downside during the early part of the week -- enabling the HUI to test
support in the low-380s and the HUI's RSI to drop to around 40 --
followed by an upward reversal.
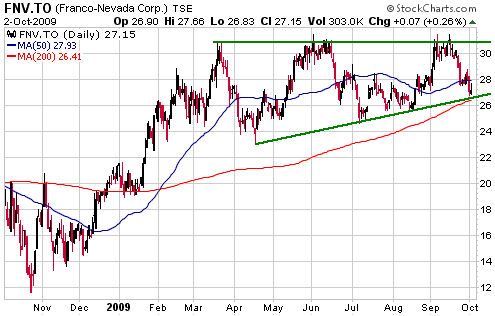
The current positions
of the premier gold royalty stocks (RGLD and FNV.TO) suggest that the
gold sector is close to a correction low. This is the case because both
stocks ended Friday's session just above the support ranges mentioned
in the 28th September Weekly Update. A chart of FNV.TO is displayed
below.
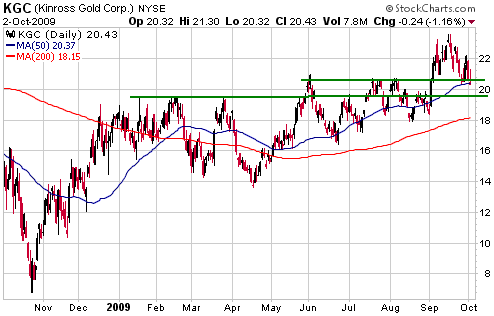
Also, in most cases
the stocks of the major gold producers are nearing support levels that
should limit their declines IF we are seeing normal corrections within
on-going upward trends. For example, the following chart shows that
Kinross Gold (KGC) ended last week near the top of a support range that
extends from US$20.80 down to US$19.50.
Currency Market Update
After a market that has been trending upward for several months begins
to decline, how can you tell in timely fashion if the decline is a
routine correction to the upward trend or the start of a new downward
trend?
In general, you can't tell for sure; but a warning signal that
something of greater importance than a routine correction is underway
would be the market doing something it hadn't done during previous
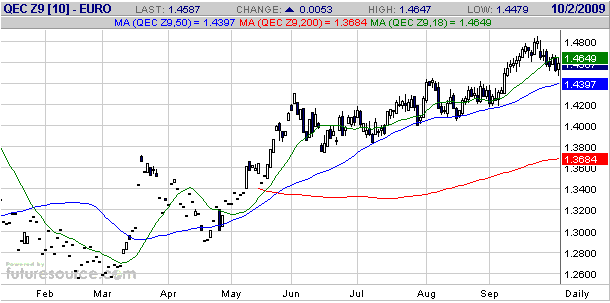
routine corrections. For example, the euro experienced many minor
setbacks as it trended upward over the past six months, but none of the
setbacks since mid April have resulted in consecutive daily closes
below the 50-day moving average. Therefore, a trader could reasonably
operate on the assumption that the December euro's current decline is a
routine pullback within a continuing upward trend unless it leads to
consecutive daily closes below the 50-day moving average. As evidenced
by the following daily chart, this moving average is presently at 1.44
and rising.
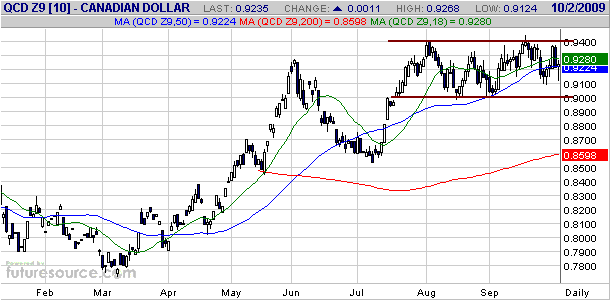
The daily chart
inserted below shows that the December Canadian Dollar futures contract
has been oscillating within a 4-point horizontal range over the past
2.5 months. A breakout from this range would project an additional
4-point move in the direction of the breakout.
Because the C$ was trending upward before it entered its horizontal
range, the eventual breakout will more likely be to the upside than the
downside.
As stated in recent
TSI commentaries, we suspect that the downward trend in the US$ that
began in March is nearing its end in terms of both time and price, but
there is no evidence, yet, that a sustainable bottom is in place. The
above charts, for example, indicate the potential for the euro and the
C$ to rise to the low-1.50s and the high-0.90s, respectively, within
the next couple of months.
Update
on Stock Selections
(Note: To review the complete list of current TSI stock selections, logon at http://www.speculative-investor.com/new/market_logon.asp
and then click on "Stock Selections" in the menu. When at the Stock
Selections page, click on a stock's symbol to bring-up an archive of our comments on the stock in question)
 Copper Fox (TSXV: CUU). Shares: 243M issued, 385M fully diluted. Recent price: C$0.11 Copper Fox (TSXV: CUU). Shares: 243M issued, 385M fully diluted. Recent price: C$0.11
In our 3rd June write-up of CUU, a tiny exploration-stage company with
a huge copper/gold resource in British Columbia, we discussed the
massive dilution that was about to occur as the result of an equity
financing. Our suggestion at the time was that existing shareholders
try to mitigate the extent to which their stakes were diluted by
participating in the financing. We also stated that although the
financing would bring about a huge increase in CUU's fully-diluted
share count, the most important consideration was that the company's
market cap would still be very low relative to the potential value of
its Schaft Creek project.
There has since been some additional dilution, but including the funds
that will be received from the exercising of warrants the company
should now be fully financed through to the completion of the Schaft
Creek Feasibility Study (FS).
Completion of the FS is a critical milestone because it starts the
clock ticking on Teck's right to claw back a 75% stake in the project,
leaving CUU with 23.35%. Specifically, Teck will have 120 days to
exercise its back-in right after the FS is complete. To exercise this
right in full, it must match 4-times CUU's expenditure on the project
and arrange the financing required to take the project through to
production. As far as we can tell, CUU will have spent at least $45M on
the project by the time the FS is complete, meaning that Teck would
have to fund the next $200M of expenditure in order to claw back 75% of
the project. We'll call this Option 1.
Alternatively, Teck could decide not to exercise its back-in right, in
which case CUU would end up with 93.4% of the project (Option 2). Or,
Teck could decide to make a bid for CUU with the aim of taking the
junior partner out of the picture (Option 3).
In our opinion, Option 1 would be best outcome for CUU shareholders
whereas Option 2 would be the worst. Option 2 would be the worst
outcome because there is no chance that CUU would be able to advance
Schaft Creek to the next stage of development in the absence of a major
partner. We think that Option 2 is also the least likely outcome.
We don't see a good reason to be short- or intermediate-term bullish on
the copper market, but the performance of CUU's stock price over the
next several months will be driven far more by speculation regarding
the FS and Teck's subsequent decision than by changes in the copper
price.
For patient risk-tolerant speculators, CUU is an interesting
proposition at C$0.10-C$0.11. The reason is that the stock would
probably trade at a multiple of its current price under either Option 1
or Option 3, whereas it would probably languish in the C$0.07-C$0.15
range under Option 2.
Technically, the stock has been building a base since late last year. A
break above C$0.15 would project a move up to C$0.25-C$0.30.
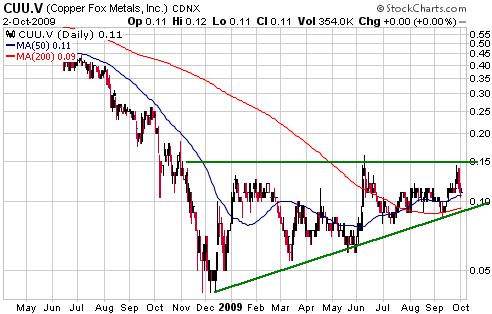
Chart Sources
Charts appearing in today's commentary
are courtesy of:
http://stockcharts.com/index.html
http://www.futuresource.com/
http://www.decisionpoint.com/

|