|
-- Weekly Market Update for the Week Commencing 5th November 2007
Big Picture
View
Here is a summary of our big picture
view of the markets. Note that our short-term views may differ from our
big picture view.
Bonds commenced a secular BEAR market in
June of 2003. (Last
update: 22 August 2005)
The stock market, as represented by the S&P500 Index, commenced
a secular BEAR market during the first quarter of 2000, where "secular
bear market" is defined as a long-term downward trend in valuations
(P/E ratios, etc.) and gold-denominated prices. This secular trend will bottom sometime between 2014 and 2020. (Last update: 22 October 2007)
The Dollar commenced a secular BEAR market during the final quarter of 2000. The
first major downward leg in this bear market ended during the first
quarter of 2005, but a long-term bottom won't occur until 2008-2010. (Last update: 28 March 2005)
Gold commenced a
secular bull market relative to all fiat currencies, the CRB Index,
bonds and most stock market indices during 1999-2001. This secular trend will peak sometime between 2014 and 2020. (Last update: 22 October 2007)
Commodities, as
represented
by the CRB Index, commenced a secular BULL market in 2001. The first
major upward leg in this bull market ended during the second quarter of
2006, but a long-term
peak won't occur until at least 2008-2010. (Last update: 08 January 2007)
Copyright
Reminder
The commentaries that appear at TSI
may not be distributed, in full or in part, without our written permission.
In particular, please note that the posting of extracts from TSI commentaries
at other web sites or providing links to TSI commentaries at other web
sites (for example, at discussion boards) without our written permission
is prohibited.
We reserve the right to immediately
terminate the subscription of any TSI subscriber who distributes the TSI
commentaries without our written permission.
Outlook Summary
Market
|
Short-Term
(0-3 month)
|
Intermediate-Term
(3-12 month)
|
Long-Term
(1-5 Year)
|
Gold
|
Neutral
(15-Oct-07)
|
Neutral
(15-Aug-07)
|
Bullish
|
US$ (Dollar Index)
|
Bullish
(11-Jun-07)
| Bullish
(31-May-04)
|
Neutral
(19-Sep-07)
|
Bonds (US T-Bond)
|
Bullish
(22-Oct-07)
|
Neutral
(23-Jul-07)
|
Bearish
|
Stock Market (S&P500)
|
Neutral
(29-Oct-07)
|
Neutral
(26-Mar-07)
|
Bearish
|
Gold Stocks (HUI)
|
Neutral
(29-Oct-07)
|
Neutral
(15-Aug-07)
|
Bullish
|
| Oil | Bearish
(23-July-07)
| Bearish
(22-Oct-07)
| Bullish
|
Industrial Metals (GYX)
| Bearish
(11-Jun-07)
| Bearish
(09-July-07)
| Bullish
|
Notes:
1. In those cases where we have been able to identify the commentary in
which the most recent outlook change occurred we've put the date of the
commentary below the current outlook.
2. "Neutral", in the above table, means that we either don't have a
firm opinion or that we think risk and reward are roughly in balance with respect to the timeframe in question.
3. Long-term views are determined almost completely by fundamentals,
intermediate-term views by giving an approximately equal weighting to
fundmental and technical factors, and short-term views almost
completely by technicals.
Commodities
Commodities and the Currency Market
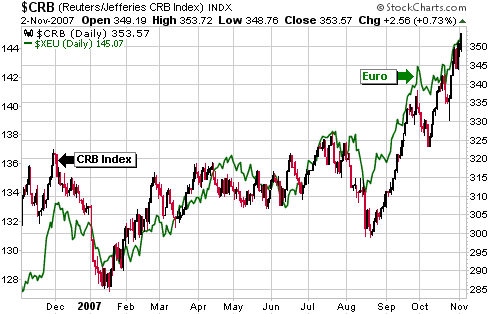
We thought it was worth re-presenting the following chart comparison of
the euro (the green line on the chart) and the CRB Index. The chart's
message is that the CRB Index will peak at around the same time as the
euro.
Industrial Metals
In the 22nd October Weekly Market Update we wrote: "Copper
is the base metal of greatest interest to us at this time because it
would only have to move a relatively small amount in one direction or
the other to effect an upside breakout (and signal the resumption of
its long-term bull market) OR reaffirm the consolidation that began
back in May of 2006. To be specific, a daily close above 3.70 by the
December futures would suggest that the next upward leg in copper's
long-term bull market had begun, whereas a daily close below 3.40 would
suggest that the major consolidation was very much intact."
The December futures contract closed below 3.40 last week, suggesting that the major consolidation is very much intact.
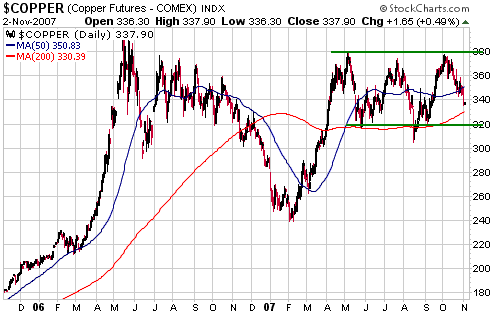
The following chart shows that copper peaked way back in May of 2006
and has spent the past 7 months oscillating between 3.20 and 3.80. Last
week's action tells us that the bottom of this range will probably be
tested at some point over the coming few weeks, but it doesn't really
tell us anything more. It's quite possible, for example, that some
additional near-term weakness will be followed by a rally that takes
the price above the top of this year's range and signals the resumption
of the long-term bull market.
Our view is that copper's intermediate-term risk/reward remains skewed
towards risk. There is the omni-present risk that the US$ will reverse
upward and there is the continuing risk that the dramatic weakness in
the US homebuilding industry will take a significant toll on the demand
side of copper's supply/demand equation. We also note that there has
been a marked increase in the amount of copper stored in LME
inventories over the past month, albeit from a very low base, and that
the copper market is close to moving from backwardation into contango
(this is a sign that there is ample near-term supply).
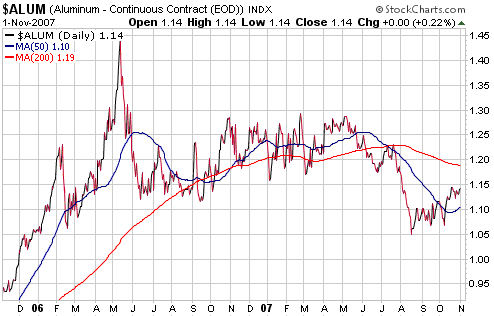
Like copper,
aluminium peaked way back in May of 2006; but unlike copper, which
remains within touch of its May-2006 peak, the following chart suggests
that the aluminium market is in the grip of a 'cyclical bear'.
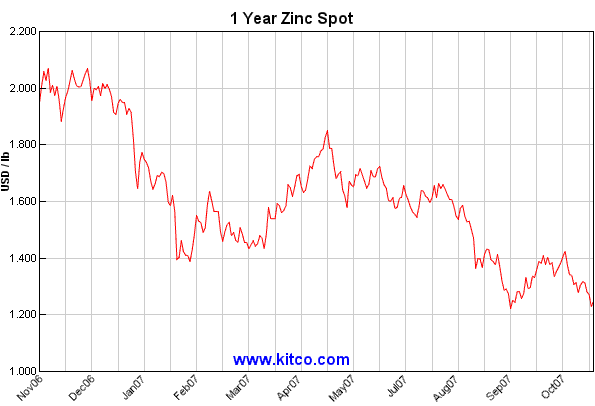
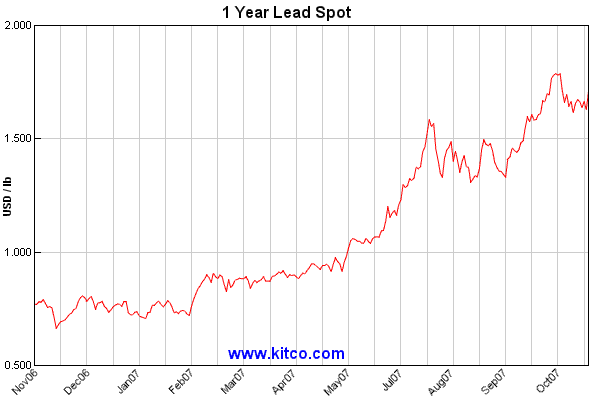
The following charts
show that zinc and lead have taken divergent paths over the past year,
with zinc trending downward and lead trending upward. One of these
markets is giving a false signal regarding the underlying strength in
the world of base metals.
We think the false signal is coming from lead, although "false signal"
is probably not a good choice of words. The lead price has been given a
hefty boost over the past 7 months by genuine supply disruptions, but
these supply disruptions won't have any bearing on the metal's
prospects beyond the short-term, assuming, as we do, that they will be
overcome. Moreover, the recent build in lead inventories, admittedly
from ultra-depressed levels, could be indicating that the market is
already overcoming the effects of these supply disruptions.
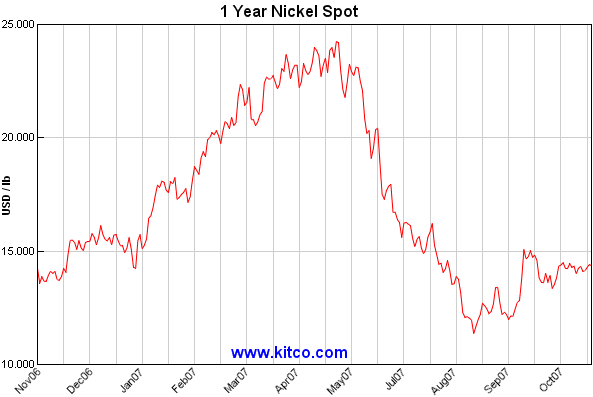
Spectacular run-ups
in price are almost always followed by equally spectacular price
declines, and such has been the case for the nickel market over the
past 12 months. As evidenced by the following chart, the nickel price
rocketed up to around $25/pound during the first 5 months of this year
and was then quickly cut in half.
We think it will be years before nickel exceeds its May-2007 peak, but
over the next few months we won't be surprised to see some additional
retracing of the May-August plunge.
When we look through
the charts of the industrial metals and take into consideration the
likely future effects of the US housing downturn on metal demand it
occurs to us that a cyclical BEAR market got underway in this commodity
sector between May of last year and May of this year. However, when we
look at the terrific stock market performances over the past year of
the major mining companies we wonder what on earth is going on. For
example, since the copper price peaked in May of 2006 the stock price
of the world's largest privately-owned copper producer (FCX) has
doubled. It's like the bull market in the industrial metals sector came
to an end but investors in the large-cap companies that produce these
metals never received the memo.
By the way, although it is more of an industrial metal than a monetary
metal we exclude silver from our short- and intermediate-term
bearishness on the industrial metals sector.
In Real Terms
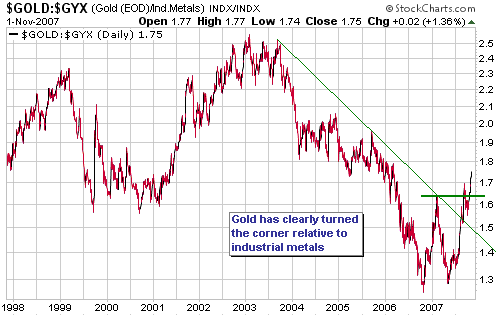
In nominal dollar terms the base metals will probably go on to make new
all-time highs over the next several years. In other words, we think
that if a cyclical bear market is underway then it is occurring within
the context of a long-term upward trend. However, in real terms --
relative to gold, that is -- we suspect that a major (long-term) peak
is in place in the industrial metals sector. The following chart of the
gold/GYX ratio (the gold price divided by the Industrial Metals Index)
supports this view.
Natural Gas
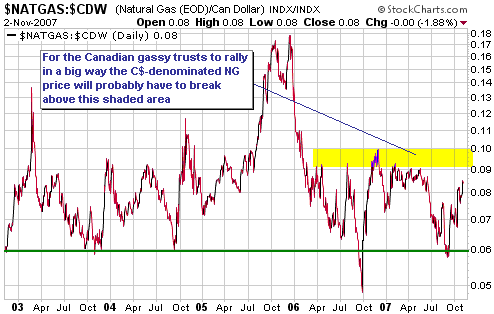
For the Canadian 'gassy' energy trusts it's the C$-denominated natural
gas (NG) price, not the NG price in US$ terms, that really matters
because it's the C$-denominated NG price that determines how much cash
flow these trusts generate.
The following chart shows that the NG price in C$ terms has recently
rebounded, but considering the extent to which production costs have
risen over the past few years it will need to move to significantly
higher levels -- above C$10, we think (0.10 on the chart) -- before the
'gassy' trusts will begin to generate the sort of cash flow that will
lead to strong gains in their unit prices.
The ideal situation for the trusts would involve weakness in the C$
combined with strength in the US$ NG price as this is the combination
that would maximise profit margins. However, the US$ NG price tends to
make much bigger short-term moves than the C$/US$ exchange rate, so
changes in the US$ NG price can be expected to dominate in the
short-term.
One of the most important short-term drivers of the US$-denominated NG price is the amount of NG in storage in the US.
Unfortunately (for those of us who are 'long'), the amount of gas in
storage has just risen above the top of its 5-year range. This means
that unless there's an above-average weather-related surge in demand in
the near future the current rally will probably end within the next few
weeks.
That having been said, sentiment in the NG futures market is
sufficiently depressed right now that the market will react very
positively to any bullish surprise.
The Stock
Market
Some sectors of the US stock
market have recently tested or have breached their August lows while
other sectors remain comfortably above their July highs. This makes it
difficult to talk about the market as a whole.
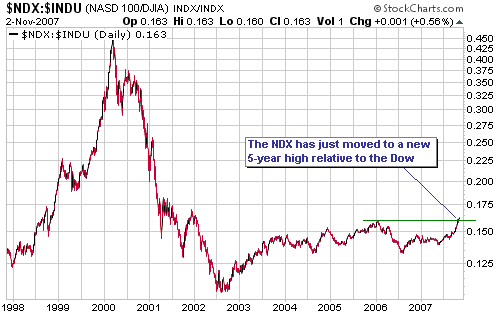
One of the significant trends in the US stock market over the past
several months has involved relentless strength in the NASDAQ100 Index
(NDX) relative to the Dow Industrials Index. In fact, the following
chart shows that there has recently been sufficient strength in the NDX
relative to the Dow to push the NDX/Dow ratio above its early-2006 peak
to its highest level in more than 5 years.
Part of the reason
for this year's surge in the NDX/Dow ratio is that the NDX does not
contain any financial companies (banks, brokers, mortgage lenders,
etc.). This is obviously a big plus in the current environment and
should result in NDX/Dow making additional gains over the coming 6-12
months, although it is overbought on a short-term basis and could pull
back for a few weeks before resuming its climb.
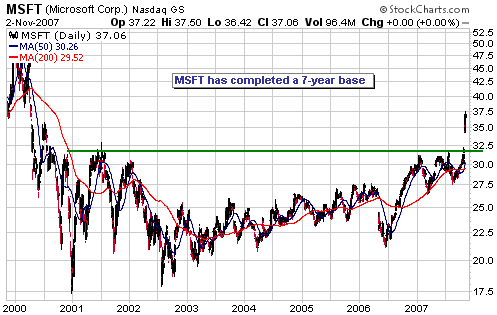
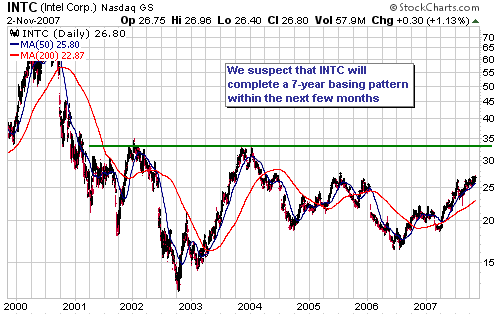
This year's rise in NDX/Dow is also related to the strong earnings
growth being achieved by a number of large-cap tech stocks. For
example, Microsoft (MSFT) and Intel (INTC), long-term charts of which
are displayed below, recently reported earnings growth that was both
very strong and above the market's expectations. In response to this
news MSFT broke out to the upside from a basing pattern that has been 7
years in the making. We would be buyers of MSFT following a pullback to
around $33.
We expect that over the coming year the NDX will continue to benefit from positive earnings news stemming from the tech sector.
We remain "neutral"
on the overall market (as represented by the S&P500 Index),
although a sharp pullback over the next 2-3 weeks that generated
considerable fear might prompt us to shift our short-term outlook to
"bullish".
This week's
important US economic events
| Date |
Description |
Monday Nov 05
| ISM Services
|
| Tuesday Nov 06 | No important events scheduled
| | Wednesday Nov 07
| Consumer Credit
Q3 Productivity (revised)
| | Thursday Nov 08
| No important events scheduled
| | Friday Nov 09
| Import and Export Prices
Trade Balance
|
Gold and
the Dollar
Gold
We correctly identified the 16th August plunge in the gold sector as a
buying opportunity, but since the second week of September we've been
very wrong about gold and the gold-stock indices in that we've been
constantly anticipating a peak that hasn't arrived. Most of our
indicators have been 'gold bullish' over this period, but we've been
concerned -- obviously far too concerned -- about the prospect of a
strong US$ rebound.
We'll get ourselves back in synch with the markets' sort-term trends
sooner or later (hopefully sooner), but as long as gold and the
gold-stock indices keep powering upward with only minor 1-2 day
pullbacks along the way we will probably remain off-side because price
action such as this only exacerbates the extended nature of the
advances. In other words, in the absence of a meaningful correction in
the world of gold it probably won't make sense for us to alter the
short-term gold-related views in our Outlook Summary Table to
"bullish".
But what if the gold market is presently in the early part of a
spectacular 1979-style run-up? Will we remain "neutral", at best, while
the gold price tacks on several hundred dollars within the space of
about 6 months?
Maybe, but there's very little chance of a 1979-style surge occurring
over the next several months. The reason is that explosive upward moves
of the type experienced by gold during 1979-1980 (and the NASDAQ during
1999-2000) only ever occur at the ENDS of long-term bull markets, and
we don't think the long-term bull market in gold that began during
1999-2001 is remotely close to being over.
So what, in our book, would constitute a meaningful correction?
Given that the purpose of a correction in a bull market is to lay the
foundation for the next rally by moderating the general level of
optimism, it probably makes more sense to consider what would have to
happen to sentiment indicators than to fixate on any particular
magnitude of price decline. After all, a price decline that doesn't
create at least a modicum of angst within the speculating community
doesn't really 'correct' anything. Following this line of reasoning and
bearing in mind that Market Vane's bullish consensus for gold is
presently above 90%, let's now review the extent of corrective activity
that proved to be necessary during prior occasions over recent years
when the bullish percentage moved into the 90s.
Since the beginning of gold's long-term bull market there have been
only four prior occasions when Market Vane's bullish percentage got as
high as 90: February-2003, December-2005, February-2006 and April-May
of 2006. The rise to '90% bullish' in early February of 2003 was
quickly followed by a 2-month decline that reduced the gold price by
almost 20% and took the bullish percentage back to around 50%. This
correction established the foundation for a multi-quarter rally. The
rise to '90% bullish' at the beginning of December-2005 was followed by
a minor (around 10%) pullback in the gold price that took the bullish
percentage to just below 80%. This brief pullback set the stage for a
multi-week rally to new highs. The rise to '90% bullish' in early
February of 2006 was followed by 6 weeks of sideways consolidation that
resulted in the bullish percentage falling to around 80%. This
consolidation laid the groundwork for the rally that culminated in the
May-2006 intermediate-term peak. And lastly, the bullish percentage
reached 90% in mid April of 2006 and remained at this elevated level
for 3-4 weeks. The gold price then fell by around 25% within the space
of 5 weeks, causing the bullish percentage to plunge to the mid-50s.
The upshot of the above is that a routine pullback within the context
of a short-term upward trend should, at a minimum, drag the bullish
percentage back to around 80. However, the longer the bullish
percentage remains in the 90s the more likely that the next correction
will be of the intermediate-term variety (a correction lasting months,
rather than weeks, and taking at least 20% off the price).
Another sentiment indicator worth mentioning at this point is the
Commitments of Traders (COT) report. Even the routine pullbacks that
began in December of 2005 and February of 2006 didn't end until after
the Commercial net-short position had dropped by around 50,000
contracts from its peak.
Gold Stocks
Although we've been very wrong about the short-term directions of gold
and the gold-stock indices, one partial saving grace has been our
relentless advocacy of maintaining a substantial core position in gold
stocks in line with gold's ultra-bullish long-term trend.
A consistent theme of ours over the years has been the critical
importance of keeping one's portfolio in synch with the long-term trend
(what some call the "primary trend"). If you do this then you will
never miss any of the upward surges and will always be positioned to
take advantage of the positive surprises that periodically occur during
bull markets; it's just that if a large rally occurs during a period
when you happen to be more focused on short-term risk than on
short-term reward then you won't make as much money as would otherwise
have been the case.
Of course, the downside to always maintaining a substantial core
position during a long-term bull market is that you will experience a
significant portfolio draw-down whenever there's a large counter-trend
move. But while this downside can be mitigated by scaling into
positions during extreme weakness and scaling out of positions during
extreme strength, we don't think it can be avoided altogether. In fact,
our view is that those who attempt to catch all the rallies AND miss
all the corrections by switching between '100% in' and '100% out' at
the appropriate times will eventually come unstuck. At some point they
will almost certainly make a timing error -- they will either find
themselves marooned on the sidelines during a large rally or 100%
invested during a large decline -- that will cost them very dearly.
We discussed, above, what a gold market correction would have to do to
sentiment indicators in order for it to really be a correction at all.
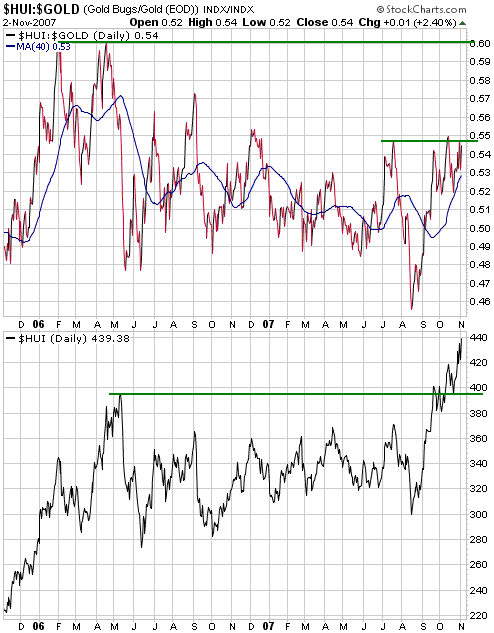
With respect to the gold stocks we've noted in previous commentaries
that a correction worthy of the name should, at a minimum, push the
HUI/gold ratio at least a few percent below its 40-day moving average.
This has looked like it was about to happen on a couple of occasions
over the past few weeks, but every time the gold-stock indices appear
ready to experience decent pullbacks we get an extraordinary day like
last Friday.
The following charts show the current positions of the HUI/gold ratio
and the HUI relative to support and resistance (the HUI has no overhead
resistance because it just closed at a new all-time high).
We can't like the
gold-stock indices here and haven't liked them for the last 90 HUI
points because they are being powered onward and upward by stocks that
are generally very extended from both technical and valuation
perspectives. However, we continue to find plenty of individual gold
stocks to like (and have been highlighting them in the TSI
commentaries).
With regard to our own portfolio we are benefiting from the gold
sector's rally thanks to our substantial core exposure to this sector
(our current exposure is actually a bit more than what we would
consider "core exposure"); but we are unsatisfied because a) our
exposure SHOULD have been well above the "core", and b) the small
gold/silver mining stocks that we tend to focus on have not, as a
group, caught on fire up until now. Having said that, we don't recall
ever being totally satisfied with our performance because during strong
rallies we have always felt that we were not 'long' enough and during
intermediate-term declines we have always felt that we were too 'long',
regardless of how we were actually positioned.
Our plan, which we are determined to stick with, is not to move well
beyond our core exposure unless a meaningful correction in the gold
sector occurs in the absence of a major upward reversal in the US$. The
US$ could rebound by 2-3 points over the space of a few weeks without
de-railing the gold rally, but if the US$ were to commence a new
intermediate-term upward trend then gold-related investments would
almost certainly trend lower for at least a few months. As noted in
previous commentaries, a single-week upward move in the Dollar Index of
2 points or more would be a clear signal that a major trend reversal
had occurred.
A silver indicator at an interesting juncture
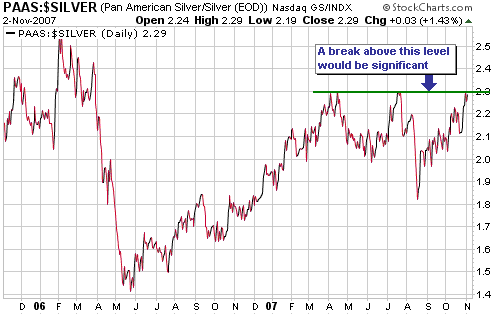
The following chart shows that the PAAS/silver ratio (the stock price
of Pan American Silver divided by the silver price) ended last week at
the same level at which it peaked in April and July. Therefore,
PAAS/silver is either about to complete a significant upside breakout
or reverse downward from the level at which it peaked on two prior
occasions. If it were to break out to the upside it would be indicating
that the gold/silver rally still had at least a few weeks to run.
As a minimum we expect silver to test resistance defined by its
May-2006 high ($15.00-$15.25) before the current rally comes to an end,
but the ability (or otherwise) of the PAAS/silver ratio to break out to
the upside will tell us whether we should expect silver's rally to do
considerably more than simply test its prior high.
Update
on Stock Selections
(Note: To review the complete list of current TSI stock selections, logon at http://www.speculative-investor.com/new/market_logon.asp
and then click on "Stock Selections" in the menu. When at the Stock
Selections page, click on a stock's symbol to bring-up an archive of our comments on the stock in question)
 Gammon Gold (AMEX: GRS). Shares: 117M issued, 127M fully diluted. Recent price: US$10.35 Gammon Gold (AMEX: GRS). Shares: 117M issued, 127M fully diluted. Recent price: US$10.35
Just a quick note that GRS is as much a silver stock as it is a gold
stock. In this respect it is quite similar to Hecla Mining (HL), except
that HL bills itself as a silver miner whereas GRS bills itself as a
gold miner. We are pointing this out because GRS stands to be a major
beneficiary if silver builds on its recent upside breakout.
Unlike gold, silver is not overbought. And unlike most of the large-
and mid-tier North American gold producers, GRS is not close to being
overbought.
 Kinross
Gold Warrants (TSX: K.WT.B). Exercise price C$10.00, expiry date
Sep-2011, 2.2487 warrants per share. Recent price: C$3.10 Kinross
Gold Warrants (TSX: K.WT.B). Exercise price C$10.00, expiry date
Sep-2011, 2.2487 warrants per share. Recent price: C$3.10
We mentioned last week that if Kinross Gold traded up to the low C$20s
then our Series B warrants would probably sell for around C$4. Things
are moving very quickly, so it is quite possible that the warrants will
trade up to around C$4 in the near future.
If the market offers us C$3.80 for these warrants at some point over
the next few weeks then we will take it (we will make our exit).
 Junior Base Metal Miners Junior Base Metal Miners
We reiterated our bearish outlook for the base metals group earlier in
today's report, but even though we perceive more downside risk than
upside potential in these metals we are interested in maintaining --
and perhaps even adding to -- positions in a few exploration-stage base
metal stocks. Our reasoning is two-fold. First, in many cases these
stocks were clobbered during August's market-wide sell-off and remain
at relatively depressed levels. That is, it seems that a good deal of
pessimism is factored into today's prices. Second, there is a tendency
for this group of stocks to perform extremely well during the first
quarter of the year.
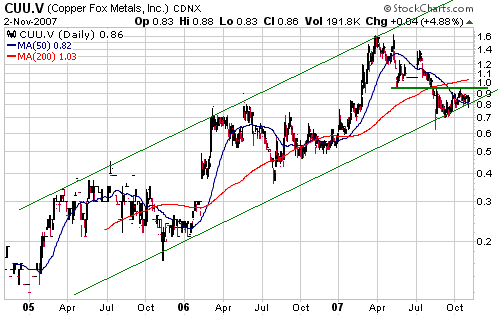
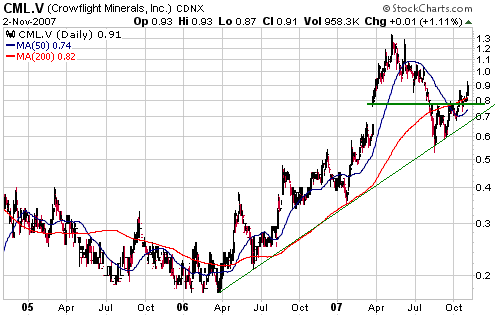
Below are charts showing junior copper stock Copper Fox (TSXV: CUU) and
junior nickel stock Crowflight Minerals (TSXV: CML), two
exploration-stage miners that look particularly interesting right now.
CUU's chart shows that the stock is presently consolidating near the
bottom of its long-term channel. Note that it has resistance at C$0.95
and that a daily close above this resistance would create a near-term
objective of C$1.20. Also take note of how well the stock performed
during the first quarters of 2005, 2006 and 2007. In fact, ALL the
gains made by this stock over the past three years have been made
during the first quarter of the year.
CML's chart shows that support held during the August swan dive and
that short-term resistance has just been overcome. We were impressed
that CML gained 10% on above-average volume last Thursday -- a day on
which almost every stock in the market was down.
In our opinion it will make sense to accumulate stocks such as CUU and
CML on weakness between now and year-end in anticipation of a
traditional Q1 rally.
 Claude Resources (AMEX: CGR, TSX: CRJ). Shares: 93M issued, 96M fully diluted. Recent price: US$1.69 Claude Resources (AMEX: CGR, TSX: CRJ). Shares: 93M issued, 96M fully diluted. Recent price: US$1.69
We thought that Northgate Minerals (AMEX: NXG) might use part of its
huge cash reserve to purchase CGR. It may still do so because such an
acquisition would make a lot of sense, but the probability of this
happening has been lessened by NXG's recent decision to buy
Perseverance (ASX: PSV).
Things are progressing reasonably well for CGR in that production at
its Seabee mine has increased from 50,000 ounces/year to 60,000
ounces/year and it is now cashed-up having just completed an equity
financing at US$1.95/share. Funds from the financing will be put to
work at the exploration-stage Madsen project, which is where the
stock's blue-sky potential lies.
We would be buyers of CGR on a pullback to around US$1.40 and would
exit the stock at US$2.20 or above if given the opportunity to do so
within the next several weeks.
Chart Sources
Charts appearing in today's commentary
are courtesy of:
http://stockcharts.com/index.html
http://www.futuresource.com/

|

