


--
Weekly Market Update for the Week Commencing
5th December 2016
Big Picture
View
Here is a summary of our big picture
view of the markets. Note that our short-term views may differ from our
big picture view.
The BULL market in US Treasury Bonds
that began in the early 1980s ended in early-2015, but there will be many years
of topping action in bond prices and bottoming action in bond yields before
major new trends get underway. (Last update: 29 June 2015)
The stock market, as represented by the S&P500 Index,
commenced
a secular BEAR market during the first quarter of 2000, where "secular
bear market" is defined as a long-term downward trend in valuations
(P/E ratios, etc.) and gold-denominated prices. This secular trend will bottom sometime between 2018 and 2020.
(Last update: 29 June 2015)
A secular BEAR market in the
US
Dollar
began during the final quarter of 2000 and ended in July of 2008. This
secular bear market will be followed by a multi-year period of range
trading.
(Last
update: 09 February 2009)
Gold commenced a
secular bull market relative to all fiat currencies, the CRB Index,
bonds and most stock market indices during 1999-2001.
This secular trend will peak sometime between 2018 and 2020.
(Last update: 29 June 2015)
Commodities,
as represented by the CRB Index, commenced a
secular BULL market in 2001 in nominal dollar terms. The first major
upward leg in this bull market ended during the first half of 2008, but
a long-term peak won't occur until 2018-2020.
(Last
update: 29 June 2015)
Copyright
Reminder
The commentaries that appear at TSI
may not be distributed, in full or in part, without our written permission.
In particular, please note that the posting of extracts from TSI commentaries
at other web sites or providing links to TSI commentaries at other web
sites (for example, at discussion boards) without our written permission
is prohibited.
We reserve the right to immediately
terminate the subscription of any TSI subscriber who distributes the TSI
commentaries without our written permission.
Outlook Summary
Market
|
Short-Term
(1-3 month)
|
Intermediate-Term
(6-18 month)
|
Long-Term
(2-5 Year)
|
|
Gold
|
N/A |
Neutral
(21-Nov-16) |
Bullish
|
|
US$ (Dollar Index)
|
N/A |
Neutral
(17-Aug-16) |
Neutral
(19-Sep-07) |
|
US Treasury Bonds (TLT)
|
N/A |
Neutral
(21-Nov-16)
|
Bearish |
|
Stock Market (DJW)
|
N/A |
Neutral
(14-Nov-16) |
Bearish |
|
Gold Stocks
(HUI)
|
N/A |
Neutral
(21-Nov-16) |
Bullish
|
|
Oil |
N/A |
Neutral
(26-Oct-15) |
Bullish
|
|
Industrial Metals
(GYX)
|
N/A |
Neutral
(10-Oct-16) |
Bullish |
Notes:
1. Our short-term expectations are discussed in the commentaries, but except in
special circumstances we won't attempt to assign a "bullish", "bearish" or
"neutral" label to these expectations.
2. The date shown below the current outlook is when the most recent outlook change occurred.
3. "Neutral" means that we think risk and reward are roughly in balance with respect to the timeframe in question.
4. Long-term views are determined almost completely by fundamentals and intermediate-term views
are determined by a combination of fundamentals, sentiment and technicals.
Last week's posts at the TSI Blog
An economy can't be modeled by simple equations
Every central bank wants a weaker US$
Summary of current
thinking/positioning
1) Continuing to expect that the
overall corrections/downturns for gold and the associated mining indices
will extend into Q1-2017, but anticipating an intervening rebound.
2) Expecting that 2017 will be a bullish year for commodities. Maintaining
long-term exposure to non-gold commodities while acknowledging that the
early-2016 lows could be tested in Q1-2017 prior to the start of the
aforementioned bullish period.
3) Expecting a decline in the oil
price to a January-February bottom and positioned for this outcome via USO
put options expiring in February. Took advantage of last week's
OPEC-inspired surge in the oil price to add to the position. Note that in
addition to being a speculation, these options have been purchased as a
hedge against short-term weakness in the commodity markets.
4)
Thinking that government bonds have commenced a long-term bear market, but
that the US Treasury Bond is close to a short-term price bottom.
5)
Expecting a further 6-12 month extension to the equity bull market and
looking for opportunities to add to general non-US equity exposure, but
maintaining a very small short-term bearish speculation via QID (leveraged
NDX bear fund) call options expiring in January-2017.
6) Thinking
that the Dollar Index is close to a 1-2 month top, but that it will move
to new multi-year highs during the first quarter of 2017 and won't reach a
major top before the second quarter of 2017.
7) Maintaining a large
cash reserve in recognition of the downside risk in almost all equities
(current cash percentage is about 40%).
US Recession
Watch
The latest iteration of the
monthly ISM Manufacturing New Orders Index (NOI) was published last
Thursday. It was for the month of October and came in at 53, which is 0.9
points higher than the September reading and 5 points above the level that
it would have to fall below (the red line on the following chart) to
signal an imminent recession.
The NOI's message is that a US
economic recession will not begin within the next two months, while the
message of our favourite long-term indicator (Real Gross Private Domestic
Investment - RGPDI) is that a recession will begin by the second quarter
of next year. Taken together the indicators suggest that a recession will
begin no earlier than February-2017 and no later than June-2017.
That being said, we acknowledge the possibility that it could be different
this time, meaning that the lag between a downward reversal in RGPDI and
the start of a recession could be longer, this time around, than it has
ever been before. This is mainly due to the unprecedented behaviour of the
Fed during the current business cycle, but it's a possibility that has
been given a higher probability by the new US President's plan to
immediately implement aggressive fiscal 'stimulus' in the form of a large
deficit-funded (meaning: unfunded) tax cut.
As an aside, it's
extraordinary that the US looks set to have the combination of ultra-easy
monetary policy and aggressive fiscal stimulus more than 7 years into an
economic recovery. In essence, the US government and central bank are
going to be acting as if the economy were in the grip of a severe
recession at the same time as they report that the economy is perfectly
fine.
A record-long recession lag would potentially pave the way
for the strength in commodity prices and the additional weakness in bond
prices that we've forecast for 2017.
The limitations
of sentiment
Most participants in the
financial markets get swept up by the general mood. As a result, after
valuations have become very high they buy into the idea that prices are
going much higher despite the high valuations, and after valuations have
become very low they buy into the idea that prices will continue to slide
despite the attractive valuations. This causes them to be very optimistic
near important price tops and either very pessimistic or totally
disinterested near important price bottoms.
It must always be this
way because a major price/valuation trend can't end until it has been
fully embraced by 'the public'. There is therefore no chance that the
investing public will ever collectively enter or exit any market at an
opportune time.
That's why it is helpful to track the public's
sentiment and use it as a contrary indicator.
However, sentiment is
not the Holy Grail of investing/speculating. There are, in fact, two
potential pitfalls associated with using sentiment to guide buying/selling
decisions, the first of which is linked to the reality that sentiment
generally follows price.
Because sentiment generally follows the
price, it is a near certainty that the overall mood will be at an
optimistic extreme when the price is near an important top and a
pessimistic extreme when the price is near an important bottom. However,
just as all poodles are dogs but not all dogs are poodles, an important
price top will always be associated with a high level of optimism but a
high level of optimism won't always mean that an important price top is at
hand. Similarly, while an important price bottom will always be associated
with a high level of pessimism, a high level of pessimism won't always
indicate that the price is near an important bottom. This means that it is
dangerous to take large positions based solely on sentiment.
The
second potential pitfall associated with using sentiment to guide
buying/selling decisions is that what constitutes a sentiment extreme will
vary over time, meaning that there are no absolute benchmarks. Of
particular relevance, what constitutes dangerous optimism in a bear market
will often not be a problem in a bull market and what constitutes extreme
fear/pessimism in a bull market will often not signal a good buying
opportunity in a bear market. In other words, context is critical when
assessing sentiment. Unfortunately, the context is always a matter of
opinion.
The gold-mining sector's performance over the past
several years provides a good example. By the first quarter of 2013 there
were enough signs of fear and pessimism within this sector to indicate
that an important price bottom might not be far away, but the downward
trend continued for almost three more years. The view that sentiment was
pointing to an important price bottom for the gold-mining sector in
Q1-2013 would most likely have been right if the decline from the 2011
peak had been a bull-market correction, but the long-term trend had
changed. The sentiment levels that indicate attractive buying
opportunities in a bull market do not work the same way in a bear market.
The bottom line is that sentiment can be a useful indicator, but it
does have serious limitations.
Copper Update
The copper price spiked up to
the mid-$2.70s three weeks ago and then pulled back. It again spiked up to
the mid-$2.70s last week and might have just made a 'double top' in that
area.
As we wrote three weeks ago, even if copper has commenced a
major rally there is likely to be a significant short-term correction. A
decline to the $2.30s to 'test' the breakout would be normal even if we
are dealing with a new bull market, but a deeper decline is possible given
that the speculative net-long position in Comex copper futures hit an
all-time high early last week.

The Stock Market
The US
Oh how the narrative has changed!
The change in the dominant narrative over the past few weeks is remarkable
and also a little funny. Prior to the US Presidential Election the popular
story was: Clinton is probably going to win and it will be business as
usual, but in the unlikely event of a Trump victory all hell will break
loose. There will be a big decline in the stock market and a rush into
safe havens.
Now here we are, four weeks and a 'surprising' Trump
victory later, and the popular story is: Due to the combination of tax
cuts, infrastructure spending and de-regulation that he will bring about,
there's no doubt that the Trump Presidency will be very bullish for both
the stock market and the economy.
In the meantime, Trump's message
hasn't changed at all. It's just that as soon as the stock market started
to rally the commentariat's interpretation of the message suddenly
changed. It changed for no reason except that prices were rising.
Which goes to show that much of what passes for fundamental analysis is
not genuine fundamental analysis. Instead, it's the concoction of a story
to match the price action.
Current Market
Situation
We are fixating on the NASDAQ100 Index (NDX) due
to its importance and the fact that it did not confirm the recent upside
breakouts in many other US stock indices. The NDX is at the same level now
as it was 4 months ago. It is also at the same level now as it was 12
months ago.
Over the past few months it oscillated within the
rectangle drawn on the following daily chart. It tested the top of the
rectangle early last week and then reversed direction.
If the NDX breaks upward from the 4650-4900 range it will confirm the
upside breakouts achieved by the SPX and the Dow Industrials, but if it
breaks downward from this range it will warn that the upside breakouts by
the other indices were false signals.
The probabilities of an
upside breakout and a downside breakout are roughly the same, but we are
positioned to benefit from a downside breakout via QID call options.
Europe
The EURO STOXX50 Index (STOX5E) is
Europe's equivalent of the Dow Industrials Index.
Like the NDX,
STOX5E has oscillated within a horizontal range over the past few months
and is at the same level now as it was 4 months ago. However, that's where
the similarities with the NDX end, because STOX5E is a long way below its
level of 12 months ago and is also below the high reached in April of this
year.
STOX5E is possibly building a long-term base with a double bottom in
February and June. A weekly close above the April high (3150) would
suggest that the base was complete and that a major rally was in progress,
but even if the long-term base interpretation is correct there could be
significant short-term weakness.
A daily close below 2950 would
warn of a short-term decline to 2800 or lower.
This week's
significant US economic events
[Notes:
1) The most important events
(to the markets) are shown
in bold. 2) A list of global economic events can be found
HERE]
| Date |
Description |
|
Monday December 05 |
ISM Non-Mfg Index |
| Tuesday
December 06 |
Q3 Productivity and Costs
(revised)
Factory Orders |
|
Wednesday December 07 |
Consumer Credit |
|
Thursday December 08 |
No important events scheduled |
|
Friday December 09 |
No important events scheduled |
Gold and the Dollar
Gold
Gold Sentiment
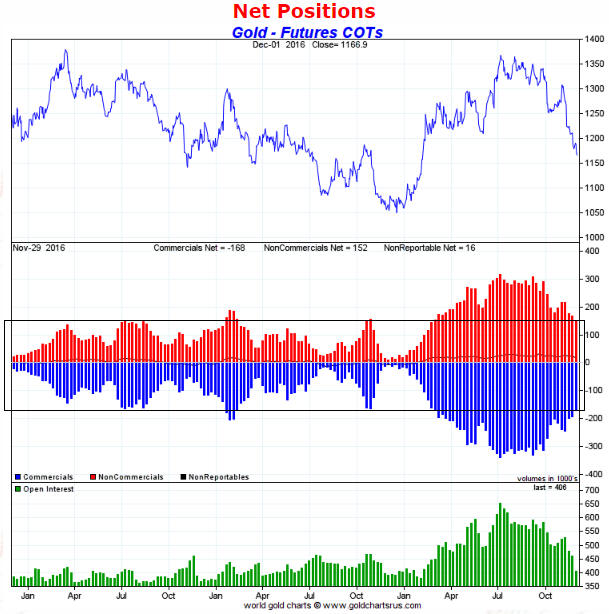
a) The COT (Commitments
of Traders) Situation
There was a sizable decline in the total
speculative net-long position in Comex gold futures during the latest period
(the period ending Tuesday 29th November). The total speculative net-long
position fell by 24K contracts (from 192K to 168K contracts) during the latest
1-week period and has fallen by almost 80K contracts since 8th November.
It's reasonable to view the liquidation of speculative long positions as both an
effect and a cause of the recent weakness in the gold price. Downward pressure
stemming from fundamental deterioration probably caused support levels to give
way, prompting a rush for the exits by technically-oriented speculators that
added to the downward pressure.
The gold price is now $13 lower than it
was on 29th November, so it's likely that there has since been a further
reduction in the total speculative net-long position. In fact, it potentially
reached 150K contracts late last week.
150K contracts is the level that
we previously wrote (in at least 4 commentaries) would probably be reached prior
to the end of the overall correction. So, are we there yet?
The answer to
the above question gets back to the context issue with sentiment indicators that
we discussed earlier in today's report. If a new cyclical gold bull market began
last December then a 150K-contract speculative net-long position would be
consistent with a price bottom. However, fundamental factors currently suggest
that a new gold bull market has NOT yet begun.
If a new gold bull market
has not yet begun then the speculative net-long position has not yet reached
price-bottoming territory. As illustrated below, what we currently have is a
speculative net-long position that has dropped back to near the TOP of its
bear-market range (the range that was established during 2013-2015).
Our
assessment, in a nutshell, is that gold's COT situation has greatly improved,
but given the fundamental backdrop it is not yet consistent with the overall
decline being complete.
b) The GLD (gold bullion ETF) Inventory
The relationship between the
gold price and GLD's inventory of physical gold is generally misunderstood and
misreported. At best, the change in GLD's inventory is an indicator of
gold-market sentiment, and like most measures of sentiment it is a contrary
indicator. Also like most measures of sentiment, it typically follows the price.
Consequently, the change in the GLD inventory usually tells you what
happened to the gold price in the past while telling you very little about what
is likely to happen to the gold price in the future.
The only time it
has the potential to provide useful information about the future is after it has
risen sharply or fallen sharply, in which case it could be warning that the
market price is stretched to the upside (if the GLD inventory has risen sharply)
or stretched to the downside (if the GLD inventory has fallen sharply) on a
short-term basis. Interestingly, however, most commentary on the GLD inventory
portrays the information in the opposite way. For example, it will usually
portray a large/sharp rise in the GLD inventory as bullish, rather than as a
warning that the risk/reward has become skewed towards risk in the short-term.
A final point worth making (reiterating, actually) before we take a look at
the recent changes in the GLD inventory is that a rise in the amount of physical
gold held by GLD and other bullion ETFs does NOT reflect increasing demand for
physical gold; it reflects disproportionately-aggressive buying of 'paper gold'
(GLD shares). This is because physical gold only gets added to GLD's inventory
-- via the arbitrage trading of Authorised Participants -- when the price of a
GLD share rises relative to the price of physical gold. In effect, a rising GLD
inventory indicates rising demand for a type of 'paper gold' relative to
physical gold.
The following chart shows the long-term positive
correlation between the gold price and GLD's physical gold inventory. The
correlation is not perfect, but what it indicates is that traders of GLD shares
generally become more bullish when the gold price is trending upward and less
bullish when the gold price is trending downward.
Zooming in on the past
12 months we see that the GLD inventory bottomed with the gold price last
December and then began trending upward with the gold price. It peaked with the
gold price in early-July and then began to trend downward with the gold price,
hitting a new multi-month low late last week in response to a new multi-month
low in the gold price.
This unfortunately tells us nothing useful,
because there have been no disproportionately-large moves by the GLD inventory
in either direction (meaning: no indications of extreme sentiment) and no
significant divergences between the GLD inventory and the gold price. It simply
tells us that GLD traders became more optimistic as gold trended upward from its
December-2015 bottom and less optimistic as gold worked its way downward from
its early-July peak.
In summary, the GLD inventory is an indicator of the sentiment of GLD
traders that generally doesn't provide useful clues about the future gold price.
In terms of ability to provide clues about what the future holds in store or
warnings based on risk/reward, it is definitely less useful than the COT data.
That's why we rarely mention it.
c) Market Vane
Unlike the COT
data, at no time this year has Market Vane's sentiment survey indicated extreme
enthusiasm for gold. According to Market Vane, the proportion of traders who are
bullish on gold peaked at a fairly modest 63% in early-July. The bullish
percentage has since dropped to 48%.
48% would be consistent with the end
of an intermediate-term correction within a bull market, but would not be
consistent with the end of an intermediate-term decline within a bear market.
The Price Action
The Dollar Index
has edged downward since reaching some sort of a peak during the week before
last, but the US$ gold price has remained under pressure due to relentless
weakness in the bond market. Due to a declining T-Bond price, the bond/dollar
ratio made a new low for the year on Thursday 1st December before rebounding a
little on Friday. The US$ gold price often moves with the bond/dollar ratio
(refer to the following chart for an illustration of the relationship), so in
this respect it wasn't surprising that the gold price made a new multi-month low
on Thursday before bouncing on Friday.
By the way, based on the current
level of the bond/dollar ratio the gold price should now be near its 2015 low of
around $1050/oz. In other words, an argument could be made that the gold price
has held up remarkably well considering the fundamental backdrop. However, the
bond/dollar ratio is a better indicator of gold price direction than absolute
gold price level. Also, the bond/dollar ratio tends to experience bigger swings
than the gold price in both directions.
The downward pressure on the gold
price currently being applied by a declining bond/dollar ratio should soon
switch to upward pressure thanks to a rebound in an extremely 'oversold' T-Bond
market.
The small divergence between the gold price and the HUI became more
significant last week. As illustrated by the following chart, there has now been
about three weeks of a downward-trending gold price combined with a slight
upward bias in the HUI/gold ratio.
Regardless of whether they are
superficially bullish or bearish based on conventional wisdom, any sort of
divergence between the bullion market and the gold-mining indices after prices
have been trending strongly for a few months is a warning to be ready for a
short-term trend reversal.
We continue to anticipate a short-term rebound in the gold market. This view
is now supported by sentiment, divergences, and the extent to which prices in
both the gold market and the T-Bond market are stretched to the downside on a
short-term basis. At the same time, due primarily to the gold-bearish
fundamental backdrop we see no good reason to believe that the intermediate-term
declines are almost over.
Gold Stocks
The HUI
essentially bottomed back on 14th November when the gold price was $1211. It has
since traded a little lower, but has never closed below its 14th November
intra-day low and is now showing incipient signs of strength. This means that
the gold-mining sector pretty much ignored the decline in the gold price from
the $1210s to the $1170s.
An
implication of the gold-mining sector's recent stability in the face of a steady
decline in the gold price is that both the gold price and the gold-mining sector
will soon rally.
The first clear signal that a significant short-term
rally is underway will be a daily close above 196 by the HUI. The top of a
very-well-defined channel lies just above 200 and could temporarily halt any
advance, but we suspect that once a rally gets going it will continue until at
least the 200-day MA.
The Currency Market
The
euro managed to 'hold the line' (major support near 105) over the past two
weeks. It is therefore yet to confirm to upside breakout in the Dollar Index.
A downside breakout followed by a drop to parity (100) or lower is likely
within the next few months, but in the meantime there is the potential for a
euro rebound to as high as 110.
Whether a rebound gets underway from near
the current level or is preceded by a downward spike will depend on the general
perception of the European political and monetary events mentioned in last
week's Interim Update. There is the Italian referendum scheduled for Sunday 3rd
December, the Austrian presidential election scheduled for the same day, and the
ECB meeting scheduled to take place on Thursday 8th December. Although
officially a vote on the power of Italy's upper house of parliament, the Italian
referendum has the greatest potential to move the markets in the near-term
because it has been portrayed as a vote of confidence/no-confidence in Italy's
Prime Minister.
The Canadian Dollar (C$) has our attention at the moment.
The recent rise
in the oil price has led to what is, to date, a weak rebound by the C$. As
illustrated below, the C$ has rebounded by about one point to channel resistance
at around 75.25. This is similar to its position in mid-October -- just prior to
the start of a decline to new multi-month lows.
A daily close above 75.25
would indicate that a larger-degree rebound was underway and that a rise to the
more important resistance near 76.5 was probably on the cards.
We
use the C$ as an oil-price indicator. A daily close above 75.25 by the C$ would
warn that oil's OPEC-inspired rally has more staying power than we currently
perceive, while a solid break by the C$ above 76.5 would largely remove the
oil-C$ divergence on which our short-term oil bearish bearishness is based. By
the same token, if the C$ were to reverse downward early this week without
making additional headway it would be evidence in support of our short-term
bearish outlook for the oil price.
Updates
on Stock Selections
Notes: 1) To review the complete list of current TSI stock selections, logon at
http://www.speculative-investor.com/new/market_logon.asp
and then click on "Stock Selections" in the menu. When at the Stock
Selections page, click on a stock's symbol to bring-up an archive of
our comments on the stock in question. 2) The Small Stock Watch List is
located at http://www.speculative-investor.com/new/smallstockwatch.html
 Company
news/developments for the week ending Friday 2nd December 2016:
Company
news/developments for the week ending Friday 2nd December 2016:
[Note: AISC = All-In Sustaining Cost, FS = Feasibility Study, FY = Financial
Year, IRR = Internal Rate of Return, ISR = In-Situ Recovery, MD&A = Management
Discussion and Analysis, M&I = Measured and Indicated, NAV = Net Asset Value,
NPV(X%) = Net Present Value using a discount rate of X%, P&P = Proven and
Probable, PEA = Preliminary Economic Assessment, PFS = Pre-Feasibility Study]
*Alkane Resources (ALK.AX) provided an update on its
progress.
The company is in the process of securing offtake arrangements
for the various outputs from the Dubbo Zirconia Project (DZP). This involves
providing samples of some of the products to potential customers and must be
done before construction financing can be finalised. Construction financing is
expected to be a mixture of debt and equity, including a possible strategic
investment at project level.
Also, an updated engineering/economic study
using a modular construction method is in progress and is now scheduled to be
completed in April of 2017 (was previously Q1-2017). The updated study should
confirm that the initial capital cost can be substantially reduced, possibly by
as much as half. If so, this will make it easier to arrange the construction
financing.
ALK's recent stock-market performance has been surprising, to
put it mildly. We were surprised when the stock price gained more than 50% for
no apparent reason over a 2-week period in October and then even more surprised
when the stock price lost almost 50% for no apparent reason over a 3-week period
in November.
Near its current price in the low-A$0.30s ALK is back to a
level where new buying would be reasonable.
*Solitario
Exploration and Royalty (XPL) has decided to pay for a PEA to be done
for the Bongara zinc project in Peru. Bongara is 30%-owned by XPL and 70%-owned
by Milpo, a large mining company.
XPL is carried to production at
Bongara, meaning that it isn't obligated to pay anything for the project's
exploration and development until commercial production is achieved. At that
point, XPL would be obligated to start paying-off its 30% share of the
construction cost by using 50% of its share of the net proceeds of production.
In other words, there is no requirement for XPL to fund a PEA or do anything
else to move the Bongara project forward. So, why is XPL spending money it
doesn't need to spend?
The crux of the matter is that whereas Bongara is
the flagship asset of XPL, it is just one of many assets for Milpo. Milpo
obviously likes the asset but does not view its development as a top priority.
Consequently, for XPL to highlight the value of the project within what it
considers to be a reasonable time, it will have to pay for its own economic
analysis. XPL's intention is to have a completed PEA by mid next year.
This is probably a smart move, although much will depend on the cost of doing
the PEA.
*Sprott Resource Corp. (SCP.TO) has
struck a deal to merge with Adriana Resources (ADI.V), a small company with a
40% stake in the Lac Otelnuk Iron Ore Project ("LOM Project") located in
Nunavik, Quebec. Or, to put it more accurately, Arthur Richards Rule IV (a.k.a.
Rick Rule) has put together a deal that involves combining SCP and ADI.
The proposed merger involves SCP shareholders receiving three shares of ADI for
each of their SCP shares and ADI being renamed "Sprott Resource Holdings" (SRH)
after completion of the merger.
The first time we read the press release
announcing the merger we got the impression that it was a bad deal for SCP
shareholders, because the LOM project is a long way from being economic at the
current iron-ore price and there is no good reason to be long-term bullish on
iron-ore. Our initial impression was that SCP was selling almost one-third of
itself to a company with an asset that was almost worthless. However, by the
time we had read the rather complicated press release four times we liked the
deal.
ADI's main contribution to the combined company will actually be
its C$28M of cash, with the 40% stake in the LOM project appropriately being
assigned almost no value. Furthermore, Sprott Inc. and a company controlled by
Rick Rule will be investing C$15M in the combined company at a substantial
premium to the current market price. Specifically, it is expected that the
Sprott/Rule investments will be made at the equivalent of about C$0.70 per
current SRC share.
The post-merger company (SRH) is expected to have
about C$55M of cash, no debt, and a net asset value (NAV) of about C$0.30/share
(equivalent to about C$0.90 per current SCP share). It will also have Rick Rule
as its CIO (Chief Investment Officer), which is important.
Rick Rule is
the ideal person to be making the decisions at a resource-investment company.
This is not only because he is good at identifying high-potential investing
opportunities, but also because he doesn't get sucked-in by the stock market's
manic-depressive swings (he is adept at scaling-in during the depressions and
scaling out during the manic phases). With Rule as CIO, both the selection and
the timing of investments by SRH in the future should be much better than was
the case with the old SCP.
The post-merger company is likely to be one of
the go-to vehicles for investors wanting broad-based exposure to natural
resources. Furthermore, although the price of SCP shares gained a little in
response to last week's news, it is still a long way below both the current NAV
and the implied post-merger NAV. As a result of the planned changes to the
company's management and balance sheet, the large discount to the implied
post-merger NAV seems unjustifiable.
SCP is a good candidate for new
buying near its current price of C$0.54. However, ADI is possibly an even better
buy near its current price of C$0.18. The reason is that even though three new
ADI shares will be paid for each SCP share, the existing ADI shares are worth
slightly more than one-third of an SCP share due to the fact that pre-merger ADI
shareholders will receive one-quarter of a 5-year warrant with an exercise price
of 33.3c to go along with each of their shares. We calculate that fair value for
these warrants would be about C$0.05 at ADI's current price of C$0.18, which
means that they would add about 0.01 to the value of each existing ADI share
(since each existing share would be entitled to one-quarter of a new warrant).
This is obviously not much, but the warrant value will rise exponentially,
making the warrants relatively more important, if the stock price rises. For
example, if the ADI stock price were to rise about 70% to its
currently-estimated post-merger NAV of C$0.30 then our calculated fair value for
the warrants would rise 160% to around C$0.13.
So, to get the warrants we
would be inclined to favour ADI over SCP for new buying as long as ADI is
trading at one-third of SCP or lower. Note, though, that there is slightly
greater risk associated with buying ADI rather than SCP due to the small chance
of the merger not being completed. Due to this risk it wouldn't be wise to pay
more for ADI shares than C$0.19 or one-third of the SCP share price, whichever
is lower.
*Timmins Gold (TGD) announced that its
C$20M equity financing was 'done and dusted'. The company issued about 36M units
at C$0.55/unit, with each unit comprising a share of the company and one-half of
a warrant. The warrants, which have an exercise price of C$0.70 and an expiry
date of 30th May-2018, have been listed on the TSX under the symbol TMM.WT.
At the current Timmins share price we estimate fair value for the warrants
to be C$0.05. They are a high-risk/high-reward speculation. There's at least a
50% probability that they will expire worthless in 18 months' time, but they
have '10-bagger' potential.
List
of candidates for new buying
From within the ranks of TSI stock
selections the best candidates for new buying at this time, listed in
alphabetical order, are:
1) AAU (last Friday's closing price: US$1.05)
2) BLK.AX (last Friday's closing price: A$0.47)
3) EVN.AX (last
Friday's closing price: A$1.89)
4) PG.TO (last Friday's closing price:
C$2.26)
5) SCP.TO (last Friday's closing price: C$0.535)
Note that
the above list is limited to five stocks. It will sometimes contain less than
five, but it will never contain more than five regardless of how many stocks are
attractively priced for new buying.
Chart Sources
Charts appearing in today's commentary
are courtesy of:
http://stockcharts.com/index.html
http://www.goldchartsrus.com/
