![]()
![]()
![]()
![]()
-- Weekly Market Update for the Week Commencing 6th January 2020
Copyright
Reminder
The commentaries that appear at TSI
may not be distributed, in full or in part, without our written permission.
In particular, please note that the posting of extracts from TSI commentaries
at other web sites or providing links to TSI commentaries at other web
sites (for example, at discussion boards) without our written permission
is prohibited.
We reserve the right to immediately
terminate the subscription of any TSI subscriber who distributes the TSI
commentaries without our written permission.
True
Fundamentals Summary
[Notes:
1) The date shown next to the current True Fundamentals Model (TFM) signal is
when the most recent change occurred. 2) Charts of the Gold and Equity
TFMs are included in the "Charts and Indicators" section of the TSI web
site]
| Market | True Fundamentals Model (TFM) |
| Gold (US$ Price) | Bullish (27 Dec 2019) |
| US Equity (SPX) | Bullish (20 Dec 2019) |
| Currency (Dollar Index) | Neutral (15 Mar 2019) |
| Commodities (GNX) | Bearish (01 Jun 2018) |
Last week's posts at the TSI Blog
There were no blog posts last week.
Summary of current
thinking/positioning
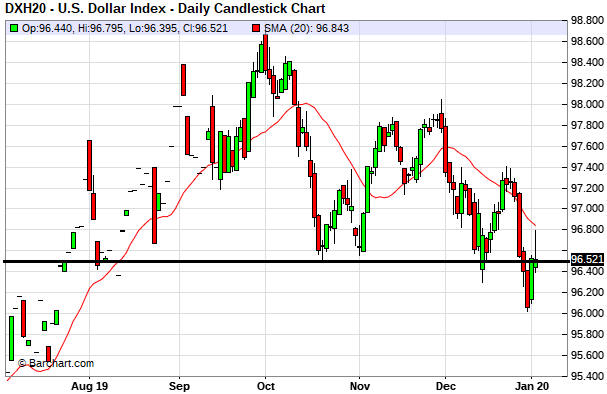
1) The Dollar Index (DX) remains
range-bound, needing a weekly close below 96.5 to signal an
intermediate-term reversal to the downside or a weekly close above 99.5 to
signal an intermediate-term rally.
2) For gold, silver and the
gold-mining indices/ETFs, we expect a multi-month top in January.
3) The senior US stock indices probably will make multi-month tops during
the first half of January. Sentiment indicators are flashing warning
signs, but breadth indicators are saying that the coming decline will be
limited to around 10%.
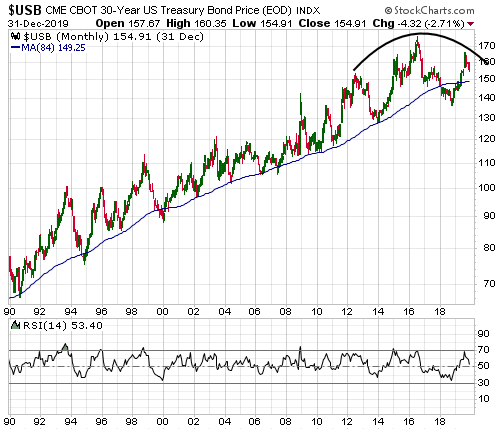
4) The T-Bond is at risk of downward
acceleration over the coming month or two, but regardless of what happens
in the short-term there's a good chance that major price weakness will be
seen in 2020. In other words, it looks like higher interest rates are on
the way.
5) We expect the oil price to trend upward over the next
12 months, but the stage is now set for a multi-month price high in
January.
6) We are holding a cash reserve of 25%-30% and are
looking for opportunities to increase this reserve.
TSI Schedule
Reminder
This is the third week in a row
that we will not be doing an Interim Update, but thereafter we will be
back to our usual two reports per week format.
Revisiting the
Fed's potential game-changer
Over the past four months the
Fed has added about $400B to its balance sheet. To put this into
perspective, since early September the Fed has expanded its balance sheet
at an annualised rate of around 30%. According to the Fed, the purpose of
this dramatic monetary expansion was to address a temporary liquidity
issue in the "repo" market. The question is: If the Fed is dealing with
only a temporary shortage of liquidity in the market for short-term money,
why did it introduce a program in mid-October to supplement the temporary
injections of "repo" money with $60B/month of permanent money?
The
answer is that the Fed is dealing with something more than a temporary
shortage of liquidity in the market for short-term money. The fact that
the Fed sees the need to remove $60B/month of Treasury supply from the
market in addition to the Treasury supply that is being removed on a
temporary basis via "repo" operations implies that the overall demand for
Treasury debt is falling short of Treasury supply at the Fed's targeted
interest rates. Looking from a different angle, it is clear that at
current interest rates the global financial system wants more dollars and
less Treasury debt. The Fed is accommodating this desire by increasing the
supply of dollars to the market and reducing the supply of government debt
that must be absorbed by the market.
The key phrase in the above
paragraph is "at current interest rates". If the supply of and the demand
for money and credit were permitted to balance naturally then interest
rates would now be much higher. However, the Fed doesn't want supply and
demand to strike a natural balance; the Fed has decided that it wants the
price of credit at a certain level and that it will use its power to
create and destroy money to override natural market forces. In this regard
the current situation is unusual only in degree, because the Fed has been
attempting to override market forces for more than 100 years.
The
US Federal government is not about to slow the pace at which it emits new
debt. On the contrary, the rate of growth in government debt supply looks
set to rise. Therefore, one of two things will have to happen if interest
rates are to stay near current low levels: The Fed will have to keep
absorbing Treasury supply at a rapid pace or the market's desire to hold
Treasury debt will have to increase substantially. The latter could occur
in response to a sizable decline in the US stock market or a crisis
outside the US.
Within a week of its mid-October announcement we
wrote that the Fed's promise to inject $60B/month of new 'permanent' money
was a potential game-changer, in that it could extend the current cycle
(prolong the equity bull market) and lead to more "price inflation" than
earlier programs. We continue to think that a cycle extension could be on
the cards, but if so the recession warnings that were generated by leading
indicators during the second half of last year must disappear within the
next couple of months.
US Recession
Watch
Our favourite leading indicators
of US recession are the ISM New Orders Index (NOI), Real Gross Private
Domestic Investment (RGPDI) and the yield curve. Subsequent to our last
discussion of US recession risk the only new information worth mentioning
is an updated NOI (the latest ISM Report was published last Friday).
As mentioned previously, the NOI occasionally generates a false
recession warning. When the signal proved to be false in the past, for
example, in March-April of 2003, the move below the recession line (the
red line on the following monthly chart) was marginal and quickly
reversed. By the same token, when the signal proved to be correct the
initial break below the recession line was followed by a significant
extension to the downside.
Since issuing a recession warning the
NOI has chopped around near the red line, meaning that the signal is
intact. In this respect nothing has changed over the past month. However,
time is running out for the NOI to invalidate its recession warning.
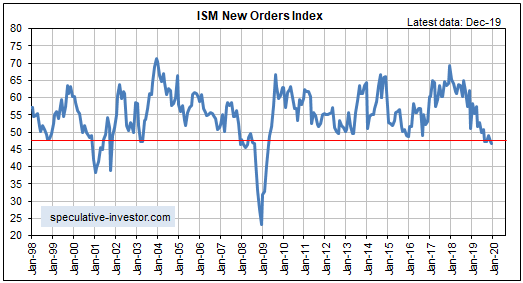
The situation now is similar to what it was a month ago, in that all
three of our favourite leading indicators are warning of recession.
Based on the latest data, our rough estimates of recession start-time
probabilities are:
- H1-2020: 60% (unchanged from a month
ago)
- H2-2020: 20% (unchanged from a month ago)
-
Later than 2020: 20% (up from 10% a month ago).
Note that even if
the US economy doesn't slide into recession anytime soon, the weakness
over the past several months in the ISM NOI suggests that some coincident
economic statistics will continue to deteriorate during the first few
months of 2020. Industrial production is an example.
Also note that
the Fed's recent actions are why 2020 recession risk is skewed towards the
first half of the year. If the Fed's actions are too little too late to
prolong the monetary-inflation-fueled boom, then a recession should get
underway before the middle of this year. Alternatively, if the Fed has
done enough to prolong the boom then a recession probably won't get
underway until 2021.
The Monthly (and Yearly)
Closing Prices
At around this time every month
we review some of the most important (from our perspective) monthly
charts. We do this because monthly closing prices can confirm or deny
intermediate-term trend changes. For December-2019 we'll review the
monthly closes for gold, GDX, the HUI, the S&P500 Index (SPX) and the
T-Bond.
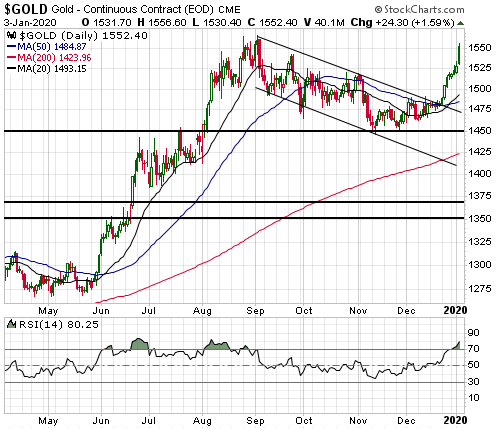
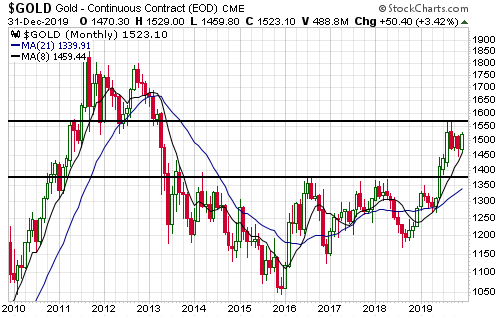
As stated in earlier commentaries, critical monthly-closing
support for gold's intermediate-term upward trend is defined by the
8-month MA. That is, a monthly close below the 8-month MA would confirm
that an intermediate-term top (a top that holds for 6-12 months or longer)
is in place. The following monthly chart shows that this MA was tested in
each of the past two months and has risen to $1460.
We expect that
there will be another test of the 8-month MA during the first quarter of
this year, most likely following a January spike to a new multi-year high.
Note that a monthly close above resistance at $1570 would point to a
test of the 2011 major peak.
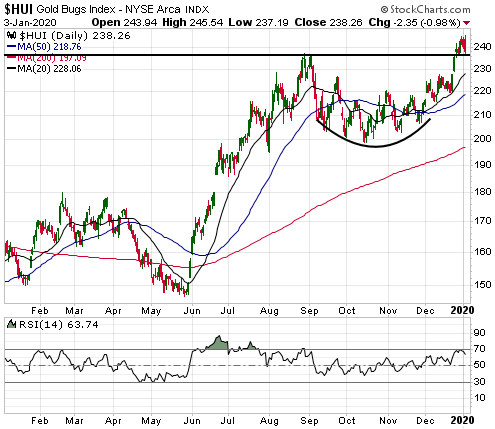
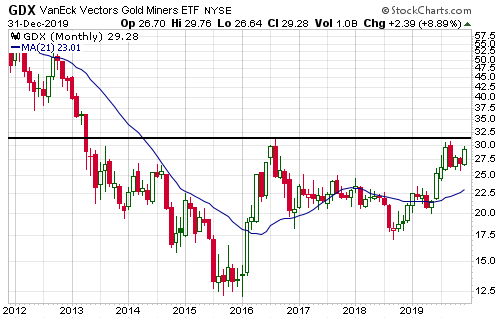
GDX and the HUI completed 2-3 month corrections in November and then
resumed their upward trends. They are in different positions on the
monthly chart, though, because the HUI made a new multi-year high in
December whereas GDX has stayed well below its August-2019 high.
Although the chart patterns suggest that the 2016 highs will be tested
prior to an intermediate-term peak, there are reasons to be cautious about
the gold sector's 2-4 month prospects. One reason is the 1980s comparison,
which projects a substantial decline from a January top.

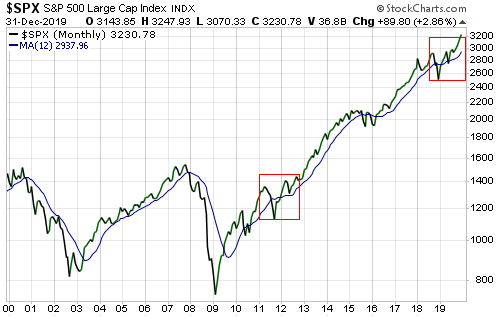
The SPX's price action during the period since September-2018 still
looks similar to the price action that followed the intermediate-term top
in 2011. The similar periods are indicated by the red boxes drawn on the
following monthly chart.
For the post-2011 similarity to be
maintained, the 12-month MA should not be breached on a monthly closing
basis for a long time to come. This is not what we expect, but clearly the
long-term US equity bull market was intact at the end of December-2019.
That's despite the complete lack of earnings growth over the past year and
the high risk that the US economy will slump into recession in 2020.
A monthly close below the 12-month MA (currently at 2938 and rising)
would be the first clear sign on the monthly chart that the bull market is
over.
The T-Bond rocketed up to a top in August-2019 and then fell during
each of the ensuing four months. It is tracing out a long-term top.
The Stock Market
On 27th December a US contractor
was killed in Iraq by a rocket attack that the US blamed on an Iran-backed
Iraqi militia called Kataeb Hezbollah (KH). In retaliation, on 29th
December the US launched airstrikes in Iraq that killed 25 KH fighters. In
retaliation, on 31st December the US embassy in Iraq was attacked by KH
supporters. In retaliation, on 2nd January the US launched a drone attack
in Iraq that killed a high-profile Iranian general, prompting the threat
of harsh retaliation from the Iranian government.
There is a risk
that the sequence of retaliatory actions will spiral out of control and
lead to outright war, but according to the stock market it is a
low-probability risk. We know that's the stock market's assessment because
on 3rd January, in response to the news of the US attack that killed the
Iranian general and the Iranian government's promise to seek a "forceful
revenge", the SPX didn't even fully retrace the preceding day's advance.
The reaction to last week's bearish news was remarkably mild
considering that the market is both 'overbought' in momentum terms and
'overbullish' in sentiment terms (the dangerous sentiment situation was
discussed in our previous two Weekly Updates). In fact, Friday's pullback
is barely noticeable on the 1-year daily SPX chart displayed below. This
implies that a short-term top has not been signaled yet.
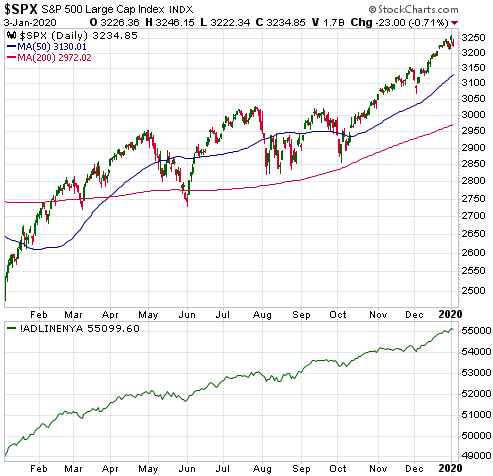
The lower section of the above chart shows the NYSE Advance-Decline
Line (ADL). The ADL made a new all-time high last Thursday and then
dropped a little on Friday.
The US stock market has never commenced
a bear market with the ADL at/near an all-time high, but the ADL's
strength does not preclude a correction of up to 10%. We are anticipating
a correction of up to 10% from a January high.
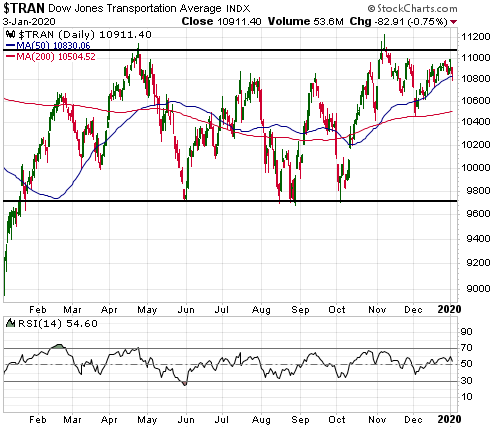
It's still the case
that the obvious lack of strength in the Dow Transportation Average (TRAN)
is the only noteworthy bearish divergence or non-confirmation. As
illustrated below, the TRAN remains below its early-November high and
continues to trade in a lacklustre manner.
The concluding comment from the Stock Market discussion in the
previous Weekly Update remains applicable. Here it is again:
"It
would be reasonable to accumulate new or add to existing bearish
speculations over the coming fortnight. These speculations could take the
form of put options with expiry dates of March-2020 or later that are
5%-10% out of the money, or bear funds such as QID."
This week's
significant US economic events
[Notes:
1) The most important events
(to the markets) are shown
in bold. 2) A list of global economic events can be found
HERE]
| Date | Description |
| Monday Jan-06 | No important events scheduled |
| Tuesday Jan-07 |
ISM Non-Mfg Index International Trade Balance Factory Orders |
| Wednesday Jan-08 | Consumer Credit |
| Thursday Jan-09 | No important events scheduled |
| Friday Jan-10 | Monthly Employment Report |
Gold and the Dollar