|
-- Weekly Market Update for the Week Commencing 6th February 2006
Big Picture
View
Here is a summary of our big picture
view of the markets. Note that our short-term views may differ from our
big picture view.
Bonds commenced a secular BEAR market in
June of 2003. (Last
update: 22 August 2005)
The stock market, as represented by the S&P500 Index, commenced a secular BEAR market during the first quarter of 2000. The rally
that
began in October of 2002 will end by the first quarter of 2006 and will
be followed by a substantial decline to a higher low (above the
Oct-2002 bottom) during the second half of 2006. The ultimate bottom of
the secular bear market won't occur until the next decade. (Last update: 12 December 2005)
The Dollar commenced a secular BEAR market during the final quarter of 2000. The
first major downward leg in this bear market ended during the first
quarter of 2005, but a long-term bottom won't occur until 2008-2010. (Last update: 28 March 2005)
Gold commenced a secular BULL market during 1999-2001. The first major upward leg in this bull market ended in December of 2004, but a long-term
peak won't occur until 2008-2010. (Last update: 28 March 2005)
Commodities, as
represented
by the CRB Index, commenced a secular BULL market in 2001. The first
major upward leg in this bull market ended during the first quarter of
2005, but a long-term
peak won't occur until 2008-2010. (Last update: 28 March 2005)
Copyright
Reminder
The commentaries that appear at TSI
may not be distributed, in full or in part, without our written permission.
In particular, please note that the posting of extracts from TSI commentaries
at other web sites or providing links to TSI commentaries at other web
sites (for example, at discussion boards) without our written permission
is prohibited.
We reserve the right to immediately
terminate the subscription of any TSI subscriber who distributes the TSI
commentaries without our written permission.
Outlook Summary
Market
|
Short-Term
(0-3 month)
|
Intermediate-Term
(3-12 month)
|
Long-Term
(1-5 Year)
|
Gold
|
Neutral
(5-Dec-05)
|
Bearish
(06-Feb-06)
|
Bullish
|
US$ (Dollar Index)
|
Neutral
(12-Dec-05)
| Bullish
(31-May-04)
|
Bearish
|
Bonds (US T-Bond)
|
Bearish
(11-Jan-06)
|
Bearish
(02-Jan-06)
|
Bearish
|
Stock Market (S&P500)
|
Neutral
(10-Jan-06)
|
Bearish
(05-Jan-05)
|
Bearish
|
Gold Stocks (HUI)
|
Neutral
(30-Nov-05)
|
Bearish
(06-Feb-06)
|
Bullish
|
General Commodities (CRB)
|
Neutral
(14-Nov-05)
|
Bearish
(23-Mar-05)
|
Bullish
|
Notes:
1. In those cases where we have been able to identify the commentary in
which the most recent outlook change occurred we've put the date of the
commentary below the current outlook.
2. "Neutral", in the above table, means that we either don't have a
firm opinion on which way the market will move or that we expect the
market to be trendless during the timeframe in question.
3. Long-term views are determined almost completely by fundamentals,
intermediate-term views by giving an approximately equal weighting to
fundmental and technical factors, and short-term views almost
completely by technicals.
While we were away...
Fortunately, nothing
earth-shattering happened in the financial world while we were AWOL.
Stocks, bonds, commodities, gold and the major currencies either
consolidated or continued to move in the directions they had been
moving prior to our 2-week absence.
It didn't provoke much of a market reaction at the time, but something
happened while we were away that will potentially have a big effect on
all the markets over the coming months/years. We are referring to Hamas
becoming the elected government of the Palestinian people. This marks
the first time that a terrorist organisation has been democratically
elected to power and, assuming there is no change to Hamas's platform,
means that there are now two governments in the Middle East -- the
governments of Iran and the Palestinian Authority -- openly calling for
the destruction of Israel.
The Middle East 'pot' therefore continues to heat up and we think it's
only a matter of time before it boils over. As a result we would
definitely not want to be short oil, even though we think the oil price
has a greater chance of falling than rising over the next six
months.
Something else worth commenting on that happened over the past
fortnight was the meeting, on the 31st of January, of the US Federal
Open Market Committee (FOMC). The outcome of this meeting -- another
0.25% hike in the Fed Funds rate and an announcement suggesting at
least one more rate hike -- was neither surprising nor noteworthy, but
the 31st January meeting was Greenspan's finale and therefore marked
the end of an era. Greenspan did an enormous amount of damage during
his 18-year stint as Fed Chairman, but if his performance is measured
against the objectives of the job it is clear that he was a star
performer. The Fed's raison d'être is to inflate (expand the
money supply) whilst keeping inflation expectations in check, and
during Greenspan's term there was a lot of inflation in parallel with
generally low/falling inflation expectations.
Greenspan was, of course, given a huge amount of help by the secular
trends that were already underway when he took the reins at the Fed,
but he certainly made the most of a fortuitous set of circumstances.
The new Fed chairman -- Ben Bernanke -- is unlikely to be anywhere near
as successful as Alan Greenspan, regardless of how adept he is at
keeping the inflation going whilst managing inflation expectations.
This is because the secular trends are not in his favour. Bernanke is
taking over at a time when long-term bull markets in gold and
commodities and a long-term bear market in US equities are still quite
young.
Questions to ponder
Why
do people who know that socialism has never worked and understand why
it can never work believe that central planning is effective/feasible
when it comes to money and interest rates?
Why do people who can readily explain why it makes no sense for the
government to dictate the price of tomatoes believe that it is
reasonable for the government to dictate the price of short-term money?
Why is it widely accepted without question that the Fed is needed to
control inflation, maintain financial stability and promote employment
growth when the historical record clearly shows that there was
generally less inflation, greater financial stability and lower
unemployment BEFORE the establishment of the Fed?
The Stock
Market
Current Market Situation
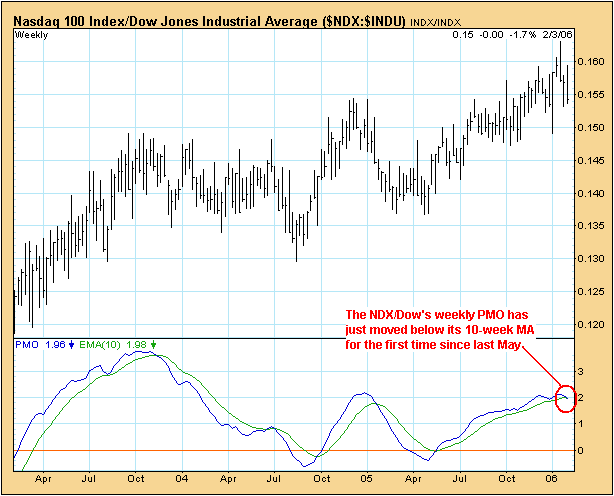
The following chart suggests that an important piece of the bearish
stock market puzzle is falling into place. Specifically, the weekly
Price Momentum Oscillator (PMO) for the NDX/Dow ratio has just moved
below its 10-week moving average, which, in turn, means that the
intermediate-term trend for the NDX/Dow ratio -- one of the most
reliable leading indicators of the US stock market -- is probably in
the process of reversing from up to down. We say "probably" because at
this stage the PMO's cross from above to below its 10-week moving
average is difficult to see without the aid of a magnifying glass, but
any further weakness from here in the NDX relative to the Dow will
confirm the downward reversal.
In previous
commentaries we've noted that the ideal topping formation for the US
stock market would entail the NASDAQ100 Index (NDX) making a peak in
January and the S&P500 and Dow Industrials indices making their
ultimate highs about two months later. A downward reversal in the
NDX/Dow's weekly trend at this time would be consistent with such an
outcome.
The following chart shows that the NDX has important lateral support at
around 1630 and trend-line support at around 1600. A solid close below
1630 would be a clear sign that an intermediate-term peak was put in
place during the first half of January.
This week's
important US economic events
| Date |
Description |
Monday Feb 06
| Leading Economic Indicators
|
| Tuesday Feb 07
| No important events scheduled
| | Wednesday Feb 08
| Existing Home Sales
| | Thursday Feb 09
| Durable Goods
| | Friday Feb 10
| Q4 GDP (Prelim)
New Home Sales
|
Gold and
the Dollar
The Yen and the Gold Sector
...the
strong positive correlation between the HUI and the Japanese Yen that
had been in place for years suddenly became a strong INVERSE
correlation at the beginning of September last year...
The rally in the gold sector that began in May of last year was/is the
first intermediate-term rally in this market that has exceeded our
expectations, the previous intermediate-term rallies during gold's
secular bull market having either just met, or fallen short of, our
expectations. Our view, up to the point where the AMEX Gold BUGS Index
(HUI) broke decisively above its 2003-2004 highs, was that we were
seeing a counter-trend advance within the context of an on-going
correction.
One of our mistakes last year was to focus too much on what the Fed was
doing and not enough on a) the inflation stemming from the monetary
policies of other central banks, and b) the inflation being caused by
an acceleration in US Government borrowing. These other factors began
to dominate the financial landscape at the beginning of September and,
as a result, there were some rather dramatic changes in inter-market
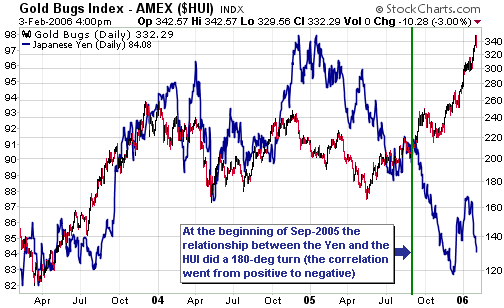
relationships at that time. For example, the following chart shows that
the strong positive correlation between the HUI and the Japanese Yen
that had been in place for years suddenly became a strong INVERSE
correlation at the beginning of September last year (the Yen is
represented by the blue line on the chart). Since then the gold sector
of the stock market has benefited from Yen weakness (US$ strength
relative to the Yen).
The Yen is being
driven lower by the carry trade (borrowing at the near-zero interest
rates available in Japan in order to purchase higher-yielding
US$-denominated debt). When the carry trade starts to unwind there will
be a vicious rally in the Yen, but neither we nor anyone else knows
when this unwinding will begin. In the mean time, the large and
still-expanding interest rate gap between the US and Japan will cause
the Yen carry trade to remain popular.
When the Yen carry trade eventually loses its appeal it will probably
be because of an emerging perception that a material narrowing of the
interest rate gap was about to occur OR because there is sufficient
strength in the Yen -- due to non-interest-rate-related factors -- to
convince carry trade participants that the Yen's intermediate-term
trend has turned up.
We think it is reasonable to average into a position in the Yen at
current levels or lower based on the likelihood that at some point over
the next 18 months there will be an explosive rally in this currency
due to the unwinding of carry trades. Furthermore, with Yen futures
having fallen on 8 of the past 9 trading days some sort of rebound
should begin very soon, although we don't have a strong opinion on
whether this next rebound will take the Yen to new highs for the year.
Taking a 3-5 year view the Yen remains our favourite fiat currency due
to the support that we expect the currency's exchange value to receive
from the combination of Japan's trade surplus and the secular bull
market in Japanese equities. However, if we are right to be long-term
bulls on the Yen then at some point the relationship between gold
stocks and the Yen will have to return to being positive because we are
also long-term bulls on gold stocks.
Gold Stocks
...gold
stocks won't provide indefinite leverage to increases in the gold
price... ...an intermediate-term peak is close at hand.
When gold stocks are trending higher relative to gold bullion it is
bullish for both gold stocks and gold bullion. However, during a time
when most prices are being pushed higher by inflation and a long-term
downward trend in stock market valuations (price/earnings ratios, etc.)
is in force there will be a limit to how high gold stock prices can
become relative to the gold price. In other words, when the costs of
producing gold are increasing and the amount that investors are willing
to pay for a dollar of earnings/cash-flow is falling, gold stocks won't
provide indefinite leverage to increases in the gold price and there
will be a ceiling over the HUI/gold ratio.
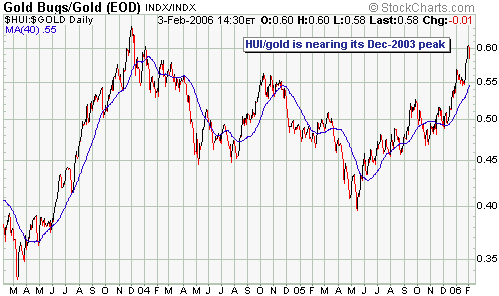
With the HUI/gold ratio nearing its December-2003 peak (see chart
below) it's quite possible that we are now close to the aforementioned
ceiling and that some of the major/mid-tier gold stocks are almost as
high as they are ever going to get RELATIVE TO the gold price. Further
down the food chain there are, however, plenty of stocks that should
continue to provide substantial leverage to gains in the gold price.
There is scant
evidence that the gold stock rally has ended. There are, however, many
signs that an intermediate-term peak is close at hand. For example:
a) The gold stock rally that began in May of 2005 is now as long as the
longest of the intermediate-term rallies that occurred during the first
major upward leg (the one that ended in December-2003), although the
gain achieved since the May-2005 bottom is still about 10% shy of the
gain achieved during the first major upward leg's weakest rally.
b) As mentioned above, the HUI/gold ratio is getting close to its December-2003 peak.
c) Market Vane's bullish percentage is above 90 for both gold and silver.
d) The Central Fund of Canada -- a mutual fund that holds gold and
silver bullion -- is trading at a 10% premium to its net asset value.
e) NovaGold Resources (TSX and AMEX: NG), a stock that tends to be one
of the best performers during the late stages of intermediate-term
rallies in the gold sector, has just hit the top of its long-term
channel (refer to the chart included in the "Updates on Stock
Selections" section).
f) The palladium market is hot and over the past few years the
palladium market has only ever become hot near the ends of metal
rallies.
g) Prior to pulling back on Thursday and Friday of last week the HUI
had risen for 6 trading days in a row. When a lengthy sequence of 'up
days' occurs after a market has already been trending higher for
several months the resultant peak can be important.
As far as the next two months are concerned, one probable outcome is
that there's a pullback followed by another rally with new highs in the
metals (gold and silver bullion) NOT being confirmed by new highs in
the stocks of the major metal producers. This would be a significant
bearish divergence that would pave the way for a substantial correction
(a correction lasting at least 6 months and resulting in a
peak-to-trough decline of at least 25% for the HUI).
We are switching our intermediate-term outlook for the HUI to "bearish"
based on the expectation that the aforementioned correction will begin
within the coming two months.
There is some talk of the current rally evolving into a "runaway bull
market". Such an outcome would surprise us greatly because bull markets
only become "runaway bull markets" in their final stages. For example,
it was only during the final 18 months of its 18-year bull market that
the NASDAQ became a "runaway bull".
Our view is that the bull markets in gold and gold stocks will continue
for an absolute minimum of three more years and will potentially
continue for as many as 14 more years, so we think the "runaway" stage
of the bull market lies well into the future. If we are wrong about
this we will still participate in the surge because we maintain a
substantial core position in line with the long-term trend, we'd just
participate to a lesser extent than would be the case if we thought
that large additional gains were probable over the coming months.
Gold
Gold versus Other Metals
...what
we've actually seen over the past several months is a general metal
rally with gold being one of the worst performers. ...the fact that the
Fed has not been openly promoting inflation the way it was during
2001-2003 has probably caused gold to lag the industrial metals.
Over the past five months gold has surprised us with its strength
relative to the US$, but relative to the most other metals gold has
been surprisingly weak. In particular, the following chart shows that
the gold price has just reached a new 4-year LOW relative to the
Industrial Metals Index (GYX). The gains made by the gold price have
been grabbing a lot of headlines because gold has such a high profile
due to its history as a form of money, but what we've actually seen
over the past several months is a general metal rally with gold being
one of the worst performers.

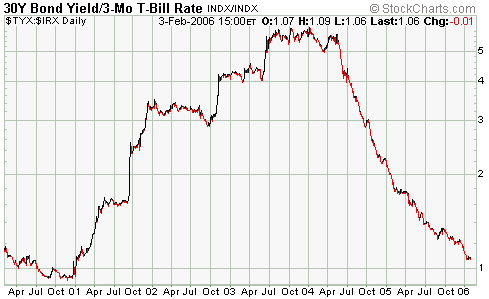
We think gold's
relative weakness can be explained by the on-going contraction of the
US yield-spread as illustrated by the following chart of the TYX/IRX
ratio (the yield on the 30-year T-Bond divided by the yield on the
13-week T-Bill). This chart indicates that the Fed is telling the truth
when it says, in the monetary policy statement issued after every FOMC
Meeting, that "longer-term inflation expectations remain contained". (The Fed is, of course, lying when it goes on to say that "possible increases in resource utilization as well as elevated energy prices have the potential to add to inflation pressures" because money-supply growth is the ONLY thing that can add to inflation pressures).
Although the Fed's
efforts to make monetary conditions less accommodative have been
countermanded to a large extent by the US Government's borrowing binge
and the inflationary practices of other central banks, the fact that
the Fed has not been openly promoting inflation the way it was during
2001-2003 has probably caused gold to lag the industrial metals. The
situation should reverse, however, once there's enough weakness in the
economy and the stock market to prompt the Fed to begin its next
rate-cutting campaign. At that point the yield-spread will begin to
widen and we will probably be at the start of a 2-3 year period
characterised by strength in gold relative to the industrial metals.
This relative strength might initially be due to gold falling by less
than the other metals during a general downturn, but should eventually
involve all metals rising with gold rising the fastest.
Current Market Situation
Our short- and intermediate-term outlooks for gold are the same as they are for gold stocks, for the same reasons.
Silver
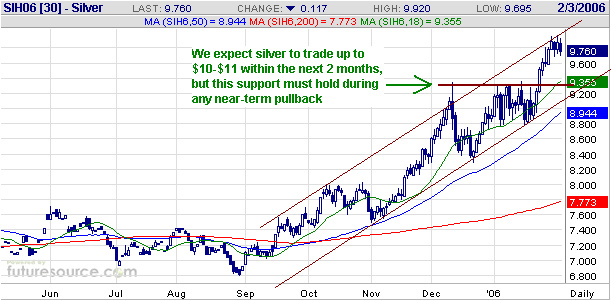
Below is a daily chart of March silver futures. We continue to expect a
move to above $10 before a substantial correction gets underway.
Currency Market Update
The consolidation in the currency market over the past 2.5 months has
resulted in speculators in currency futures becoming net-flat the US$
relative to the Swiss Franc. Ideally there will be enough additional
weakness in the dollar over the coming month or so to prompt
speculators to build-up a significant net-short position in the US
currency, but the fact that a large speculative net-long position in
the dollar has been eliminated without the need for anything more
serious than a routine pullback is a good sign as far our
intermediate-term bullish view on the dollar is concerned.
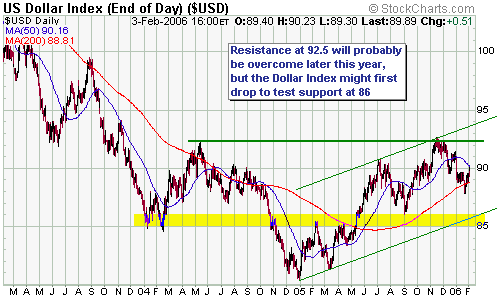
As things currently stand, the Dollar Index is mid-way between
intermediate-term resistance at 92.5 and intermediate-term support at
86. A drop to test this support will remain a likely short-term
prospect as long as the 50-day MA is not exceeded. However, if the
Dollar Index achieves consecutive daily closes above its 50-day MA then
we will conclude that a correction low is already in place.
Below is a daily chart of the Canadian Dollar.
The Canadian Dollar has moved up and down in synch with the gold price
over the past year, although this relationship has broken down to some
extent over the past 6 weeks in that the C$ has failed to match gold's
strength. In particular, when gold was surging to new multi-year highs
during the first half of January the C$ was threatening to break below
intermediate-term support at 85.
The C$ finally traded at a new multi-year high during the first half of
last week, but its upward progress has been laboured and the path of
least resistance for this currency appears to be down.
We expect to see a sharp decline in the C$ once an intermediate-term top is in place in the gold market.
Update
on Stock Selections
 NovaGold
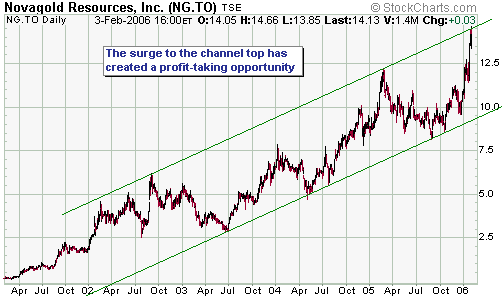
Resources (TSX and AMEX: NG) is our favourite gold stock investment for
the long haul, but every stock we own is for sale at the right price
and NG has just reached a price at which some profit taking would be
appropriate. Specifically, the stock has just hit the top of its
long-term channel (see chart below) and now looks fully valued with
respect to our intermediate-term outlook for metal prices. In our
opinion it would make sense to sell 30%-50% of your position in NG near
the current price, but it would NOT make sense to completely exit the
stock. NovaGold
Resources (TSX and AMEX: NG) is our favourite gold stock investment for
the long haul, but every stock we own is for sale at the right price
and NG has just reached a price at which some profit taking would be
appropriate. Specifically, the stock has just hit the top of its
long-term channel (see chart below) and now looks fully valued with
respect to our intermediate-term outlook for metal prices. In our
opinion it would make sense to sell 30%-50% of your position in NG near
the current price, but it would NOT make sense to completely exit the
stock.
We are going to keep NG in the Stocks List, but will exit the NovaGold
warrants (TSX: NG.WT) to reflect our view that some profit taking is
appropriate at this time. The realised gain on the warrants is 572%
based on our Oct-2003 entry price of C$1.25 and Friday's closing price
of C$8.40.
 Fears
that the development of European Minerals' (TSX: EPM) Varvarinskoye
gold/copper project would be delayed by the financial problems being
experienced by its contractor (MDM Ferroman) created an opportunity to
buy the stock in the low-to-mid C0.80s during the first half of
January. The stock price subsequently rocketed up to the C1.40s on the
back of increasing enthusiasm for gold stocks and the realisation that
MDM's troubles didn't materially alter the investment case for EPM. It
therefore almost reached our intermediate-term target of C$1.50 before
pulling back over the past two trading days. Fears
that the development of European Minerals' (TSX: EPM) Varvarinskoye
gold/copper project would be delayed by the financial problems being
experienced by its contractor (MDM Ferroman) created an opportunity to
buy the stock in the low-to-mid C0.80s during the first half of
January. The stock price subsequently rocketed up to the C1.40s on the
back of increasing enthusiasm for gold stocks and the realisation that
MDM's troubles didn't materially alter the investment case for EPM. It
therefore almost reached our intermediate-term target of C$1.50 before
pulling back over the past two trading days.
EPM has now terminated MDM's turnkey mine construction contract, an
outcome that could be a blessing in disguise because other gold mining
companies that have employed MDM over the past two years have
experienced cost overruns and delays. Fortunately, MDM's contract at
Varvarinskoye was ended before it had really begun, that is, before
there was an opportunity for the contractor to cause any major delays
or cost overruns. However, there is now some additional uncertainty for
the stock market to deal with because EPM no longer has a fixed price
mine-construction contract.
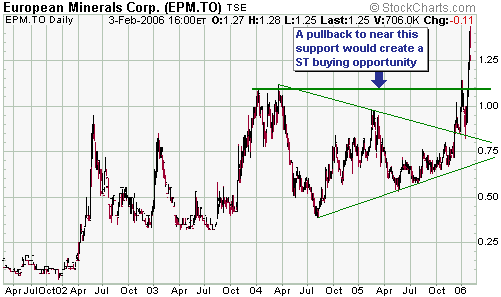
As a result of the recent price action and further consideration of the
effects that higher metal price assumptions will have on the reported
gold/copper reserves at Varvarinskoye, we are increasing our
intermediate-term target for EPM to C$1.80-C$2.00. A pullback to near
the support shown on the following chart would create a short-term
buying opportunity.
 In the 9th January Weekly Update we wrote: In the 9th January Weekly Update we wrote:
"The biggest short- and
intermediate-term risk with Metallica (the stock and the warrants) is
the risk that the company will not be able to obtain the explosives
permit needed to progress the construction of its Cerro San Pedro
gold/silver mine in Mexico. There's a high probability that the
required permit will be obtained, but until it is in hand the risk will
remain. A confirmed failure to get the permit would hit the stock hard,
whereas news that the permit had been received would likely push the
stock price up to and through our short-term price target [US$2.50]."
There was good news regarding the explosives permit while we were away
and this news did, in fact, push the stock price well above our
short-term target. We think MRB is still significantly under-valued at
Friday's closing price of US$3.05, but the stock is extended from a
technical perspective. In our opinion, it makes sense to take some
money off the table now whilst maintaining a core position.
 In addition to the ones mentioned above, gold/silver stocks that have
reached or exceeded our short-term targets (levels at which some profit
taking might be appropriate) are First Majestic Resource (TSXV: FR) and
Western Silver (AMEX: WTZ). Non-gold/silver stocks that have reached
levels at which it would be reasonable to make a PARTIAL exit are
Broadwing Corp. (NASDAQ: BWNG) and Taseko Mines (TSXV: TKO).
 In the 23rd January Weekly Update we said that we would add the QQQQ
Jan-07 $42 put options (VCQMP) to the Stocks List if they dropped to
US$2.30 (they were trading at $2.70 at the time). Our buy price was
reached on 27th January, so VCQMP has been added to the List at US$2.30.
Chart Sources
Charts appearing in today's commentary
are courtesy of:
http://stockcharts.com/index.html
http://www.futuresource.com/
http://www.decisionpoint.com/

|

