![]()
![]()
![]()
![]()
-- Weekly Market Update for the Week Commencing 6th February 2017
Big Picture
View
Here is a summary of our big picture
view of the markets. Note that our short-term views may differ from our
big picture view.
The BULL market in US Treasury Bonds that began in the early 1980s ended in early-2015, but there will be many years of topping action in bond prices and bottoming action in bond yields before major new trends get underway. (Last update: 29 June 2015)
The stock market, as represented by the S&P500 Index, commenced a secular BEAR market during the first quarter of 2000, where "secular bear market" is defined as a long-term downward trend in valuations (P/E ratios, etc.) and gold-denominated prices. This secular trend will bottom sometime between 2018 and 2020. (Last update: 29 June 2015)
A secular BEAR market in the US Dollar began during the final quarter of 2000 and ended in July of 2008. This secular bear market will be followed by a multi-year period of range trading. (Last update: 09 February 2009)
Gold commenced a secular bull market relative to all fiat currencies, the CRB Index, bonds and most stock market indices during 1999-2001. This secular trend will peak sometime between 2018 and 2020. (Last update: 29 June 2015)
Commodities,
as represented by the CRB Index, commenced a
secular BULL market in 2001 in nominal dollar terms. The first major
upward leg in this bull market ended during the first half of 2008, but
a long-term peak won't occur until 2018-2020.
(Last
update: 29 June 2015)
Copyright
Reminder
The commentaries that appear at TSI
may not be distributed, in full or in part, without our written permission.
In particular, please note that the posting of extracts from TSI commentaries
at other web sites or providing links to TSI commentaries at other web
sites (for example, at discussion boards) without our written permission
is prohibited.
We reserve the right to immediately
terminate the subscription of any TSI subscriber who distributes the TSI
commentaries without our written permission.
Outlook Summary
|
Market |
Short-Term (1-3 month) |
Intermediate-Term (6-18 month) |
Long-Term (2-5 Year) |
| Gold | N/A |
Neutral (21-Nov-16) |
Bullish |
| US$ (Dollar Index) | N/A |
Neutral (17-Aug-16) |
Neutral (19-Sep-07) |
| US Treasury Bonds (TLT) | N/A |
Neutral (21-Nov-16) |
Bearish |
| Stock Market (DJW) | N/A |
Neutral (14-Nov-16) |
Bearish |
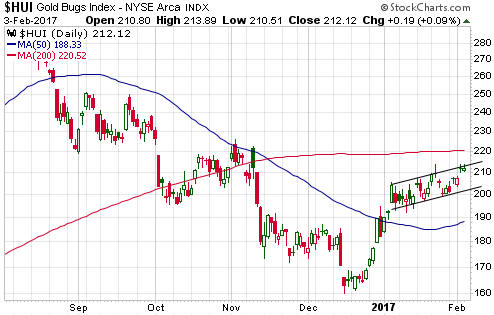
| Gold Stocks (HUI) | N/A |
Neutral (21-Nov-16) |
Bullish |
| Oil | N/A |
Neutral (26-Oct-15) |
Bullish |
| Industrial Metals (GYX) | N/A |
Neutral (10-Oct-16) | Bullish |
4. Long-term views are determined almost completely by fundamentals and intermediate-term views
are determined by a combination of fundamentals, sentiment and technicals.
Last week's posts at the TSI Blog
Loosening is the new tightening
A pro-business government does NOT lead to a stronger stock market
Summary of current
thinking/positioning
1) Thinking that the financial
world is heading for an important February-March turning point involving a
correction low in the US$ and highs in equity and commodity markets.
2) Thinking that the short-term rallies in gold, silver and the
associated mining indices are not yet complete.
3) Expecting
intermediate-term tops in non-gold commodities and the associated equities
later this quarter. Looking for profit-taking opportunities, but planning
to maintain some long-term exposure to relatively low-risk stocks. Hedged
via EEM and USO put options.
4) Thinking that the US Treasury Bond
has significant additional short-term upside (within a long-term bearish
trend).
5) Expecting an extension of the US equity bull market and
expecting a generally-bullish global equity trend. Concerned about
short-term downside risk, but acknowledge that a significant correction
might not begin before March.
6) Thinking that the Dollar Index is
immersed in a 2-3 month correction, after which its longer-term upward
trend will resume.
7) Maintaining a large cash reserve to hedge
downside risk in equities (current cash percentage is about 35%).
US Recession
Watch
The latest iteration of the
monthly ISM Manufacturing New Orders Index (NOI) was reported last
Wednesday. This is the most reliable short-term leading indicator of US
recession, which is why it is one of the few economic numbers we pay
attention to and regularly discuss at TSI.
The latest NOI (the
number for January-2017) was almost identical to the previous NOI (the
number for December-2016), meaning that it remains at a 2-year high and
well above the level it would have to drop below (the red line on the
following chart) to warn of an imminent start to a recession. The message,
in a nutshell, is that the US economy is expanding and will probably keep
doing so for at least a few more months.
Although it is not one of our primary economic indicators, the Weekly
Leading Index (WLI) calculated by the Economic Cycle Research Institute
(ECRI) is worth mentioning because its growth rate is now at one of the
highest levels of the past 15 years. The situation is illustrated below.
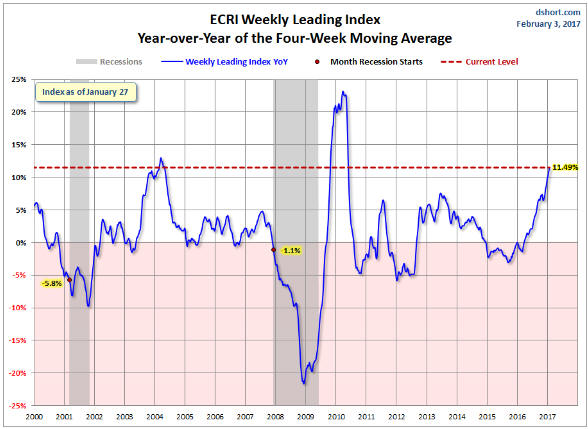
Chart Source:
Doug Short
Taking into account the ISM Manufacturing NOI, the
ECRI's WLI and the upward reversal over the past two quarters of Real
Gross Private Domestic Investment (RGPDI), we now think that the
probability of a US recession beginning during the first half of 2017 is
close to zero. This is consistent with our assessment that the fundamental
backdrop remains bearish for gold and conducive to relative strength in
industrial commodities.
Monetary
Inflation Update
From a practical
investing/speculating standpoint the most useful money-supply indicator is
the combination of US$ and euro supply, a monetary aggregate that we call
"G2 True Money Supply (TMS)". We created G2 TMS in response to what
happened during 2005-2006, when accelerating monetary inflation in the
euro-zone delayed the end of an economic boom in the US.
The global
booms that ended in 2000 and 2006-2007 did so a few months after the G2
monetary inflation rate dropped below 6% (the red line on the following
chart). We therefore view 6% as a boom-bust demarcation level.
The
following chart's overarching message is that the current investment booms
are yet to run out of monetary fuel, although there was an interesting
down-tick in December (the latest month for which data is currently
available). The down-tick will shift from interesting (a curiosity) to
concerning if it continues and takes the growth rate below last year's low
of 8%.
Commodities
Copper Update
Last week the copper price again reversed downward after probing
resistance in the low-$2.70s. It fell sharply on Friday but managed to
hold above its 50-day MA.
The huge speculative net-long position in
copper futures remains a risk. This risk will eventually materialise,
resulting in a substantial price decline. However, a surge above the
$2.70s and potentially to $3.00 will remain a reasonable short-term bet as
long as pullbacks hold at the 50-day MA.
Platinum Update
The platinum price bottomed
slightly below US$900 in December and has since rebounded to its 200-day
MA. As illustrated by the bottom section of the following chart, platinum
has also rebounded in gold terms.
A near-term pullback to the $950s
wouldn't be surprising and would probably create another good entry point
for either a short-term or a long-term trade.
Platinum is the precious metal with the most bullish intermediate-term
reward/risk ratio. This is partly because despite the rebound of the past
few months it remains very cheap relative to gold. It is also because of
the potential for a supply shortage to develop. There is currently no
evidence of a platinum supply shortage, but as a market that essentially
lives from hand to mouth such a shortage can arise due to a disruption in
the mining industry or unexpectedly-high consumption.
There's a
realistic chance of the platinum price moving up to at least parity with
the gold price over the coming 12 months.
The Stock Market
The US
Valuation Risk
We have generally
been too bearish on the US stock market for about 20 years. Although it
isn't an excuse, we think that the following chart qualifies as a
mitigating factor. The chart was prepared by Ned Davis Research and shows
total stock market capitalisation as a percentage of Gross Domestic
Income. We'll call it the TSMC/GDI ratio.
Notice that apart from a
brief period during 2008-2009, the TSMC/GDI ratio has spent the entire
past twenty years in "bubble territory" and above the 1929 peak.
Furthermore, it's not like there's a particular issue with the TSMC/GDI
ratio that has caused it to paint a distorted picture. Other long-term
valuation indicators have generated similar messages.

As has been clearly demonstrated by the US stock market, an
over-valued market can always become more so and can remain in over-valued
territory for an unpredictably long time. We are therefore not predicting
a collapse to 'normal value' in 2017, but it is still prudent to take the
valuation risk into account. A collapse to the long-term valuation average
or lower WILL eventually happen.
Two influences that could become
catalysts for the start of a major shift back to 'fair value' appear to be
in their early stages of development. The first is an increase in the rate
of "price inflation".
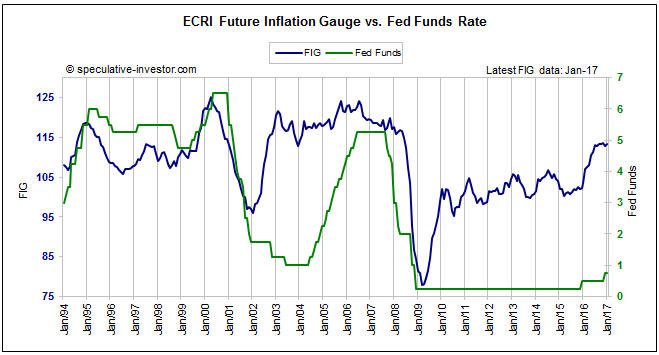
If the ECRI's Future Inflation Gauge (FIG) is
anything to go by (the following chart shows that the FIG has risen
sharply since early last year), the rate of US price inflation as measured
by the CPI will trend upward throughout this year. When the rate of price
inflation is on the rise, the stock market's average P/E ratio tends to be
on the decline.
The second potential catalyst for the start of a major shift back to
'fair value' is "regime uncertainty" in the US.
"Regime
uncertainty" is the name given to the tendency of private investors to
pull back from making long-term financial commitments due to uncertainty
about what the government will do next. According to
an essay
by Robert Higgs, it was one of the factors that prolonged the Great
Depression of the 1930s. Government intervention is generally bad for the
economy, but it tends to be even worse when it happens in an ad hoc way.
It is becoming apparent that government by ad-hoc command is the
method favoured by the new US president, in which case "regime
uncertainty" is likely to rise and the amount that investors are willing
to pay for a dollar of corporate earnings is likely to fall.
We'll
do a TSI blog post about "regime uncertainty" in the next day or so.
Current Market Situation
The
Volatility Index (VIX) has worked itself into a discussion-worthy
position.
The VIX is a much better indicator of stock market
bottoms than stock market tops. This is because the urgency to sell or
hedge invariably spikes after the market has taken a tumble and is nearing
a bottom, whereas stock-market peaks tend to be preceded by prolonged
periods of complacency. This results in a dramatic upward spike in the VIX
as the market approaches a bottom and a tedious downward grind in the VIX
for months or even years prior to a top.
Currently, the VIX is less
than 1 point from a 20-year low. This doesn't necessarily mean that the
stock market is near an important peak, but it almost certainly does mean
that volatility is not going to get significantly lower.
The S&P500, the Dow Industrials and the NASDAQ100 moved back to near
their highs for the year (and all-time highs) on Friday 3rd February. This
simply means that there is no evidence, yet, that any sort of top is in
place. As previously advised, recent divergences between the
aforementioned indices and market internals opens up the possibility that
an intermediate-term peak (a peak that holds for more than 6 months) will
be put in place this quarter.
The stock index with the most
interesting current position is the Dow Transportation Average (TRAN).
This is because its January-2017 close was slightly below its
November-2014 close, leaving the November-2014 close of 9198 as the
monthly closing all-time high.
At this stage we don't know why the
TRAN has been unable to break out on the monthly chart (see below), but
the ability/inability of this index to break out on a monthly basis is
something we'll be paying attention to in the future.
This week's
significant US economic events
[Notes:
1) The most important events
(to the markets) are shown
in bold. 2) A list of global economic events can be found
HERE]
| Date | Description |
| Monday February 06 | No important events scheduled |
| Tuesday February 07 |
International Trade Balance Consumer Credit |
| Wednesday February 08 | No important events scheduled |
| Thursday February 09 | No important events scheduled |
| Friday February 10 |
Import and Export Prices Consumer Sentiment Treasury Budget |
Gold and the Dollar