|
-- Weekly Market Update for the Week Commencing 6th June 2011
Big Picture
View
Here is a summary of our big picture
view of the markets. Note that our short-term views may differ from our
big picture view.
In nominal dollar terms, the BULL market in US Treasury Bonds
that began in the early 1980s ended in December of 2008. In real (gold)
terms, bonds commenced a secular BEAR market in 2001 that will continue
until 2014-2020. (Last
update: 4 April 2011)
The stock market, as represented by the S&P500 Index, commenced
a secular BEAR market during the first quarter of 2000, where "secular
bear market" is defined as a long-term downward trend in valuations
(P/E ratios, etc.) and gold-denominated prices. This secular trend will bottom sometime between 2014 and 2020. (Last update: 22 October 2007)
A secular BEAR market in the Dollar
began during the final quarter of 2000 and ended in July of 2008. This
secular bear market will be followed by a multi-year period of range
trading. (Last
update: 09 February 2009)
Gold commenced a
secular bull market relative to all fiat currencies, the CRB Index,
bonds and most stock market indices during 1999-2001. This secular trend will peak sometime between 2014 and 2020. (Last update: 22 October 2007)
Commodities,
as represented by the Continuous Commodity Index (CCI), commenced a
secular BULL market in 2001 in nominal dollar terms. The first major
upward leg in this bull market ended during the first half of 2008, but
a long-term peak won't occur until 2014-2020. In real (gold) terms,
commodities commenced a secular BEAR market in 2001 that will continue
until 2014-2020. (Last
update: 09 February 2009)
Copyright
Reminder
The commentaries that appear at TSI
may not be distributed, in full or in part, without our written permission.
In particular, please note that the posting of extracts from TSI commentaries
at other web sites or providing links to TSI commentaries at other web
sites (for example, at discussion boards) without our written permission
is prohibited.
We reserve the right to immediately
terminate the subscription of any TSI subscriber who distributes the TSI
commentaries without our written permission.
Outlook Summary
Market
|
Short-Term
(0-3 month)
|
Intermediate-Term
(3-12 month)
|
Long-Term
(1-5 Year)
|
Gold
|
Neutral
(19-Apr-11)
|
Neutral
(24-Jan-11)
|
Bullish
|
US$ (Dollar Index)
|
Neutral
(07-Mar-11)
| Bullish
(02-May-11)
|
Neutral
(19-Sep-07)
|
Bonds (US T-Bond)
|
Neutral
(20-Sep-10)
|
Bearish
(21-Mar-11)
|
Bearish
|
Stock Market (S&P500)
|
Bearish
(09-May-11)
|
Bearish
(11-Oct-10)
|
Bearish
|
Gold Stocks (HUI)
|
Neutral
(24-Apr-11)
|
Bullish
(23-Jun-10)
|
Bullish
|
| Oil | Neutral
(31-Jan-11)
| Neutral
(31-Jan-11)
| Bullish
|
Industrial Metals (GYX)
| Bearish
(03-Jan-11)
| Bearish
(25-May-09)
| Neutral
(11-Jan-10)
|
Notes:
1. In those cases where we have been able to identify the commentary in
which the most recent outlook change occurred we've put the date of the
commentary below the current outlook.
2. "Neutral", in the above table, means that we either don't have a
firm opinion or that we think risk and reward are roughly in balance with respect to the timeframe in question.
3. Long-term views are determined almost completely by fundamentals,
intermediate-term views by giving an approximately equal weighting to
fundamental and technical factors, and short-term views almost
completely by technicals.
What "backs" today's money?
All of the major central
banks hold currency reserves in the form of gold or other national
currencies, but it is not strictly true that these reserves "back" the
associated currencies. For example, if the US' gold reserves or Japan's
US$ reserves disappeared tomorrow, the US$ and the Yen wouldn't be
worth any less than they are today. What, then, backs today's fiat
money?
That's a trick question, because money isn't backed by anything. Money
is what it is -- the most commonly used final means of payment within
the economy. For example, when the US was on something close to a
genuine "gold standard" during the last quarter of the 19th Century,
gold was money and the gold wasn't backed by anything. Pieces of paper
known as dollars circulated within the economy during this period, but
the paper dollars weren't money; rather, they were receipts for money
(gold) held in a vault somewhere. Of course, banks created more
receipts for money than there was actual money, but this fraudulent
practice -- known as fractional reserve banking -- is a separate issue.
Some people will no doubt argue that gold money wouldn't need to be
backed by anything because gold has "intrinsic value", whereas paper or
electronic money needs to be backed by something because it has no
"intrinsic value". The problem with this line of thinking is that gold
and paper money have exactly the same "intrinsic value": zero. All
value is subjective. What, for instance, would gold bullion be worth to
you if you were stranded alone on a desert island with no hope of ever
being rescued? In that situation, a tree that provided a steady supply
of coconuts would probably have a lot more value to you than one
million ounces of gold. However, if you were living in a modern economy
and the government was acting in a way that was guaranteed to destroy
wealth and substantially reduce the purchasing power of the official
money, gold would probably be very valuable to you. The point is that
the value of any object is in the eye of the beholder; it is never
inherent in the object.
Once something has taken on the role of money, its value, like the
value of everything else, will be determined by its supply relative to
its demand. The difference is that with money it really comes down to
supply, because while changes in demand are often important on a short-
or intermediate-term basis the long-term trend in the purchasing power
of money will almost always be dominated by the change in the money
supply*. Given that under today's monetary system the central bank
determines the long-term growth rate in the supply of money, it is fair
to say that the central bank (the Fed in the US) is by far the biggest
influence on the value of modern money. However, the central bank is
really just a tool of the government and the banking system, so if we
take a step back we can see that the ability of today's money to
maintain its usefulness as money is largely dependent upon the
policies/actions of the government and the major private banks.
Therein lies the problem. The problem isn't that today's money is not
"backed" by much in the way of reserves; the problem is that the value
of YOUR money is determined by the actions of ethically-bankrupt
institutions.
*Note that we
aren't implying, here, that there is a linear relationship between
changes in the money supply and changes in money purchasing power,
because that definitely isn't the case. Changes in the money supply
have a non-uniform effect on prices within the economy, and there are
often long and variable delays between changes in money supply and the
resultant changes in money purchasing power. We are simply saying that
the long-term shift in a currency's purchasing power will primarily be
determined by the change in its supply.
Copper Update
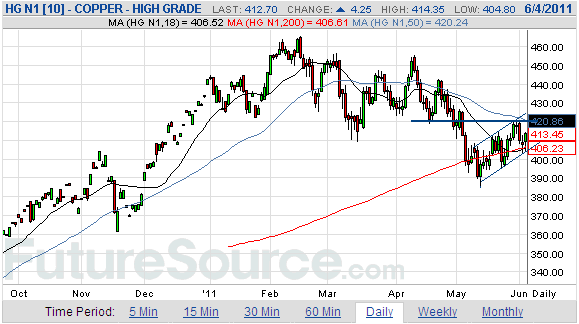
The following daily chart shows that copper futures peaked in February
and have rebounded since making some sort of bottom during the first
half of May. At this stage the advance from the May low looks like a
counter-trend move. If this interpretation is correct then the recent
rebound will be followed by a decline to a new low for the year.
A daily close below 400 would suggest that the copper futures market
was on its way to a new low, with the 360s being a reasonable
short-term target. On the other hand, a solid daily close above 420
would suggest that the May low was more important than we currently
believe and that a test of the February high was on the cards.
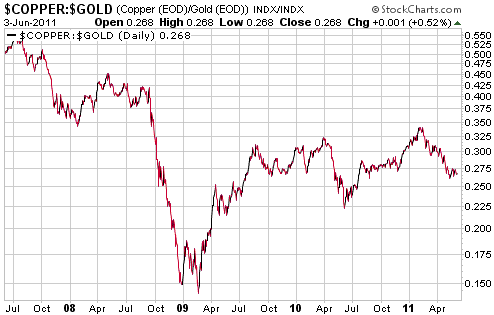
The next daily chart covers a longer period and shows how copper has
performed in gold terms. Notice that although the copper/gold ratio
made a new multi-year high in February of this year, the February-2011
high was only marginally above the August-2009 high. In other words, in
gold terms almost all of copper's post-crash rebound was complete by
August of 2009.
If the stock market and global growth trends evolve as we currently
expect then the copper/gold ratio will probably break below its Q1-2009
bottom within the next 12 months. However, due to monetary inflation
there is little chance of the copper market ever breaking below, or
even seriously challenging, its Q1-2009 low in US$ terms.
Remembering an old quote
With
a massive increase in US Federal Government spending and indebtedness
having failed to improve the employment situation, and with recent data
suggesting that the US economy is headed towards another official
recession (unofficially, it never left the 2007-2009 recession), we are
reminded of the following quote. It is from an address to Congressional
Democrats in May of 1939 by Henry Morgenthau, Franklin Roosevelt's
Treasury Secretary.
"We have tried spending
money. We are spending more than we have ever spent before and it does
not work. And I have just one interest, and if I am wrong ... somebody
else can have my job. I want to see this country prosperous. I want to
see people get a job. I want to see people get enough to eat. We have
never made good on our promises ... I say after eight years of this
Administration we have just as much unemployment as when we started ...
And an enormous debt to boot!"
The Stock
Market
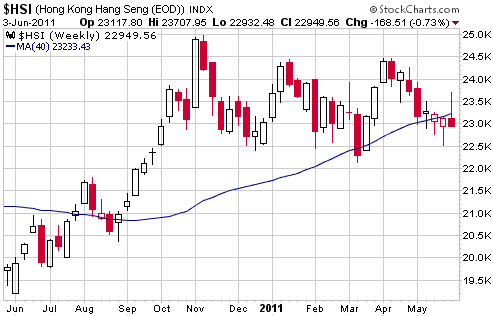
First up, we have a weekly
chart of Hong Kong's Hang Seng Index (HSI). The HSI rocketed upward
last Tuesday, and then spent the rest of the week giving up all those
gains and more. The result is the long tail on the weekly candlestick.
In effect, the HSI has gone sideways over the past 8 months. Based only
on the price action there is no way of telling whether it is
consolidating within a continuing multi-year upward trend or completing
a large rounded topping pattern. We suspect it's the latter.
Next up, we have a
weekly chart of the S&P500 Index (SPX). The SPX has just fallen for
five weeks in a row, but three of these weekly declines were very small
and it isn't yet very 'oversold'. The channel that defined the QE2
rally has been decisively breached, but the most important support lies
at 1250. A weekly close below 1250 would confirm that an
intermediate-term top is in place.
Even if it turns out that an intermediate-term peak was put in place at
the beginning of last month, we expect that this peak will be tested
before a major downward trend gets underway. This is due to the way
multi-year stock market rallies usually top out.
This week's
important US economic events
| Date |
Description |
Monday Jun 06
| No important events scheduled
| Tuesday Jun 07
| Consumer Credit
| | Wednesday Jun 08
| Fed's Beige Book
| | Thursday Jun 09
| International Trade Balance
| | Friday Jun 10
| Import and Export Prices
Treasury Budget
|
Gold and
the Dollar
Gold and Silver
Our view is that gold either made an intermediate-term top at the
beginning of May or will make an intermediate-term top very soon. This
view is largely based on the performance of the silver/gold ratio,
which clearly signaled an important trend reversal during the final
week of April and the first week of May. Such trend reversals in the
silver/gold ratio generally coincide with intermediate-term gold peaks
or lead them by no more than a few weeks.
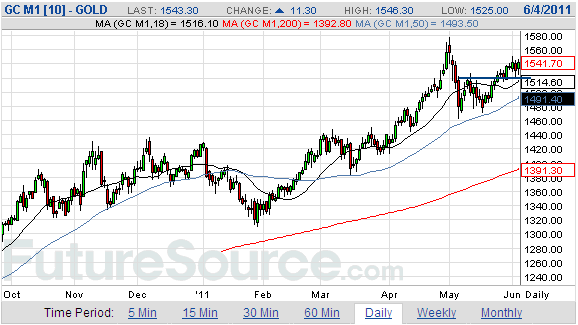
If gold is going to make a new high before commencing a multi-month
correction, then this week is the most likely time for it to do so.
Also, in order to maintain the short-term potential for a new high the
nearest gold futures contract should not close below the support
indicated on the following daily chart ($1520 for the June contract).
Silver made an
intermediate-term top in late April and has been consolidating since
6th May. Short-term resistance lies at around $39.50.
If gold manages to make a new high this week it will be interesting to
see where silver is trading at the time. A new price high for gold
along with a sub-$40 silver price would be a definitive bearish
non-confirmation.
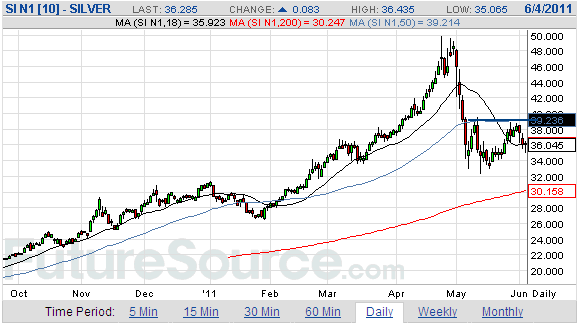
As soon as silver's
correction began, the 200-day moving average became a likely downside
target. It also became the minimum downside target, in that
intermediate-term corrections usually result in the price dropping
below this moving average.
Silver's 200-day moving average is now at $30 and is rising at the rate
of about $2/month. This means that silver could reach its 200-day
moving average within the next three months without breaking below its
May low.
While it is certainly possible that silver will eventually reach its
200-day MA without breaking below its May low, this is not the most
probable outcome. In fact, it would be very strange if it turned out
that the ultimate correction low was put in place just two weeks into
the correction. It is more likely that silver will trade at least a few
dollars below its May low before bottoming on a sustained basis, with a
decline to the low-$20s being the maximum realistic downside over the
months ahead.
Gold Stocks
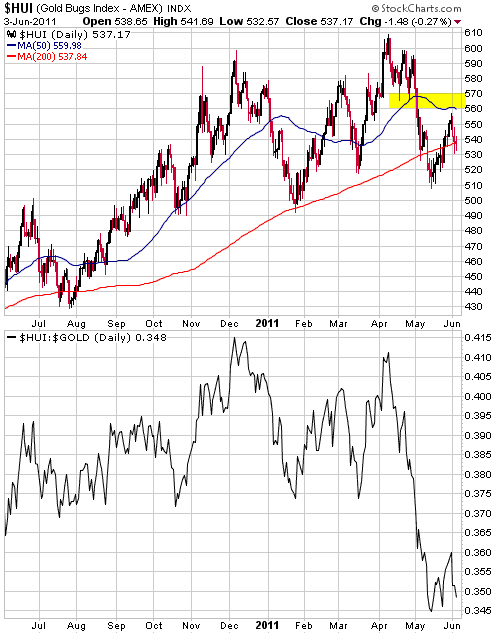
The top half of the following daily chart shows that the HUI reversed
downward after almost reaching resistance at 560-570 early last week.
The bottom half of the chart shows that the HUI/gold ratio has dropped
back to near its May low.
Note that if the HUI manages to break above 570 at some point over the
next few weeks, we won't necessarily take it as confirmation that the
correction is over. It will, however, represent a significant change to
the anticipated pattern that will need to be assessed at the time.
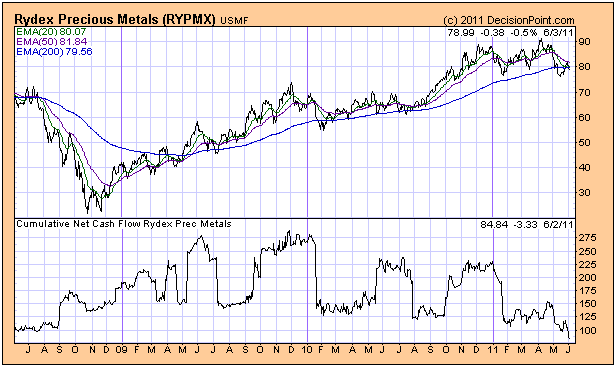
The Rydex Precious Metals Fund (RydexPM) is an open-ended mutual fund that holds mostly gold and silver equities.
The chart displayed below shows RydexPM and the cumulative net cash
flow into this fund. The most interesting aspect of this chart is that
it reveals a decline to a new 3-year low in the cumulative net cash
flow even though the price is still within 10% of the 3-year high
reached in April. This is a sentiment mismatch with bullish
implications, because it suggests that the public (the 'dumb money') is
far more bearish than would be justified by the price action.
Given that a) our
HUI/Gold Oscillator came close to generating a rare buy signal last
month, b) the gold sector of the stock market has now been in
correction mode for 6 months, c) gold stocks are generally under-valued
relative to gold bullion and d) the public appears to be excessively
bearish on precious metals equities, the stage appears to be set for a
multi-month rally in the gold sector. The problem is that downward
corrections in gold and silver bullion are probably not close to being
complete, which probably means that the beginning of the aforementioned
rally is still some way off.
Currency Market Update
China's Currency (the RMB)
China's government effected a large devaluation of the RMB in 1994 and
then kept its currency at a constant level against the US$ for the next
10 years. However, in 2005 the government-controlled link to the US$
was made more flexible, paving the way for a steady rise in the RMB
that has continued to this day. Refer to the following monthly chart
for details.
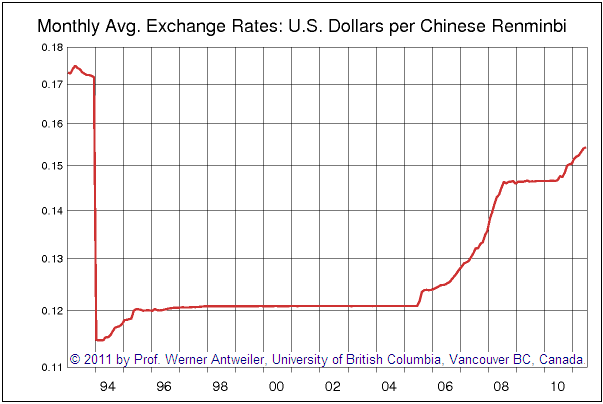
Although the RMB has
been 'allowed' to trend upward over the past six years, throughout this
period it has undoubtedly been lower, relative to the US$ and other
major currencies, than it would have been in the absence of the Chinese
Government's exchange-rate management. Moreover, keeping the RMB at an
artificially low level against the US$ has entailed the creation of new
RMB at a rapid rate, which means that exchange rate policy has been a
major contributor to China's current inflation problem. Regardless of
what else is done, the inflation problem will worsen unless the
money-supply growth rate is substantially reduced.
One of the problems now faced by China's government is that it has
conflicting plans and objectives. For example, the desire to slow the
rate at which prices are increasing conflicts with the plan, as
discussed in the Reuters article posted HERE,
to 'paper over' hundreds of billions of dollars of debt taken on by
local governments. These are the sorts of policy conflicts that central
planners always end up facing.
If political pressure to bail out local governments and banks takes
precedence over the political pressure to stem increases in the cost of
living, then China's inflation problem will get much worse and the RMB
will transmogrify into a weak currency. In fact, it is possible that
there has already been sufficient monetary inflation in China to
eventually result in significant RMB weakness.
We suspect that if the RMB were set free from its US$ peg in the near
future it would quickly rise by at least a few percent in knee-jerk
fashion, but that it would then begin a long-term decline due to the
effects of its relatively high inflation rate.
Current Market Situation
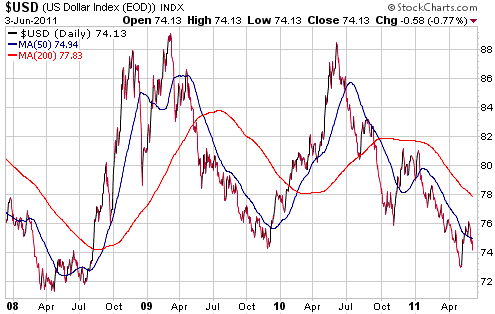
In the 30th May Weekly Update we wrote:
"The US dollar's
intermediate-term bottoming process was always likely to entail an
initial rally followed by a decline to test the low. Last week's market
action could mean that the initial rally is complete, especially
considering that the Swiss Franc made a new high on Friday, although we
can't yet rule out the possibility that the initial rally is still in
progress. What we can say is that we would be buyers of US dollars, or
sellers/hedgers of most other major currencies, if the Dollar Index
dropped back to the vicinity of its early-May low."
The action of the past week leaves little doubt that the initial rally
is complete and the decline to 'test' the low is now in progress. There
is no guarantee that the test will be successful, but we expect that it
will be.
Update
on Stock Selections
(Notes: 1) To review the complete list of current TSI stock selections, logon at http://www.speculative-investor.com/new/market_logon.asp
and then click on "Stock Selections" in the menu. When at the Stock
Selections page, click on a stock's symbol to bring-up an archive of
our comments on the stock in question. 2) The Small Stock Watch List is
located at http://www.speculative-investor.com/new/smallstockwatch.html)
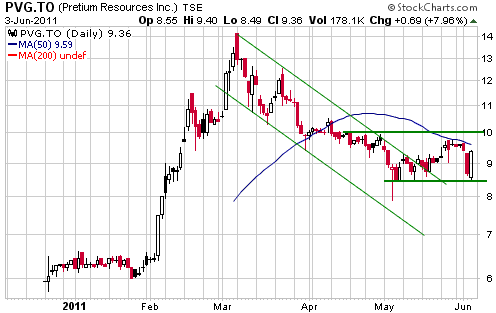
 Pretium Resources (TSX: PVG). Shares: 85M issued, 90M fully diluted. Recent price: C$9.36 Pretium Resources (TSX: PVG). Shares: 85M issued, 90M fully diluted. Recent price: C$9.36
During the final two trading days of last week PVG exhibited strange
price action in the form of an 8% decline on Thursday and an 8% rise on
Friday. Thursday's price action was particularly strange in that it
occurred in reaction to positive news. At least, we thought the news
was very positive and expected that the stock would rise in response.
Thursday's news was a press release advising the results of a
Preliminary Economic Assessment (PEA) for the high-grade portion of the
company's Brucejack project. The PEA, which is by definition very
preliminary in nature, indicates that this part of the overall project
could be developed into a mine with a net present value of around
US$1.4B at today's metal prices. Importantly, the preliminary estimate
for the total capital cost is $282M, an amount that a company of PVG's
size should be able to finance. We don't know why anyone in his/her
right mind would have sold in response to this news.
The PVG story continues to unfold as expected or better than expected.
The company is rapidly moving ahead on two fronts, the first involving
the development of a huge low-grade deposit that will require many
years and billions of dollars to bring into production, and the second
involving the development of a medium-size high-grade deposit with
nearer-term production potential.
Last week's strange price action created another short-lived
opportunity to buy at the support that begins at around C$8.50 and
extends down to C$8.00. Resistance lies at C$10.00.
 Sabina Gold and Silver (TSX: SBB). Shares: 154M issued, 166M fully diluted. Recent price: C$6.89 Sabina Gold and Silver (TSX: SBB). Shares: 154M issued, 166M fully diluted. Recent price: C$6.89
In a very interesting press release last Thursday, SBB announced that
it has sold its Hackett River silver-zinc project to Xstrata. Due to
the way the sale has been structured, SBB will retain considerable
exposure to the silver component of the project. Specifically, Hackett
River has been sold for $50M cash plus 22.5% of the first 190 million
ounces of payable silver mined from the project plus 12.5% of all
payable silver from the project thereafter at no future cost to SBB. In
effect, SBB now owns a royalty that will give it around 2.7M ounces of
silver per year once Hackett River goes into production. At a silver
price of $30/oz, the silver royalty would amount to a payment of
$81M/year.
A silver or gold royalty of the magnitude mentioned above on a project
that is still a few years from production would probably have a market
value of around $800M (assuming $30/oz for silver). Furthermore, based
on how royalty companies are currently being valued by the stock market
the royalty's market value would probably rise to at least $1.6B once
the project was in production (again, assuming $30/oz for silver).
We suspect that SBB will end up selling the silver royalty to Silver
Wheaton, thus giving it more than enough cash to fully fund the Back
River gold project through to production.
In our opinion, by essentially eliminating all of SBB's exposure to
base metals the Xstrata deal reduces both the downside risk and the
upside potential of SBB shares. Our 'back of the envelope' estimation
of SBB's current value is now $1.4B, which is arrived at by adding
$200M cash and $400M for the Back River project to the above-mentioned
$800M estimate for the market value of the new silver royalty. Using
the fully diluted share count, this equates to about C$8.40/share.
Our view continues to be that a decline to around C$5/share would
create a new buying opportunity. There is, of course, no guarantee that
the stock will pull back that far.
Chart Sources
Charts appearing in today's commentary
are courtesy of:
http://stockcharts.com/index.html
http://www.futuresource.com/
http://www.decisionpoint.com/

|

