![]()
![]()
![]()
![]()
-- Weekly Market Update for 6th May 2019
Big Picture
View
Here is a summary of our big picture
view of the markets. Note that our short-term views may differ from our
big picture view.
The BULL market in US Treasury Bonds that began in the early 1980s ended in mid-2016, but there will be many years of topping action in bond prices and bottoming action in bond yields before major new trends get underway. A major decline in government bond prices will unfold during the 2020s. (Last update: 11 September 2017)
The stock market, as represented by the S&P500 Index, commenced a secular BEAR market during the first quarter of 2000, where "secular bear market" is defined as a long-term downward trend in valuations (P/E ratios, etc.), gold-denominated prices and inflation-adjusted prices. This secular trend will bottom in 2020 or later. (Last update: 11 September 2017)
A cyclical BEAR market in the US Dollar began in 2016-2017. (Last update: 11 September 2017)
Gold commenced a secular bull market relative to all fiat currencies, the CRB Index, bonds and most stock market indices during 1999-2001. This secular trend will peak in 2020 or later. (Last update: 11 September 2017)
Commodities,
as represented by the CRB Index, commenced a
secular BULL market in 2001 in nominal dollar terms. The first major
upward leg in this bull market ended during the first half of 2008, but
a long-term peak won't occur until 2020 or later.
(Last
update: 11 September 2017)
Copyright
Reminder
The commentaries that appear at TSI
may not be distributed, in full or in part, without our written permission.
In particular, please note that the posting of extracts from TSI commentaries
at other web sites or providing links to TSI commentaries at other web
sites (for example, at discussion boards) without our written permission
is prohibited.
We reserve the right to immediately
terminate the subscription of any TSI subscriber who distributes the TSI
commentaries without our written permission.
True
Fundamentals Summary
[Notes:
1) The date shown next to the current True Fundamentals Model (TFM) signal is
when the most recent change occurred. 2) Charts of the Gold and Equity
TFMs are included in the "Charts and Indicators" section of the TSI web
site]
| Market | True Fundamentals Model (TFM) |
| Gold (US$ Price) | Bullish (04 Jan 2019) |
| US Equity (SPX) | Bearish (19 Apr 2019) |
| Currency (Dollar Index) | Neutral (15 Mar 2019) |
| Commodities (GNX) | Bearish (01 Jun 2018) |
Last week's posts at the TSI Blog
Gold, Commodities, and Bob Moriarty's New Book
Summary of current
thinking/positioning
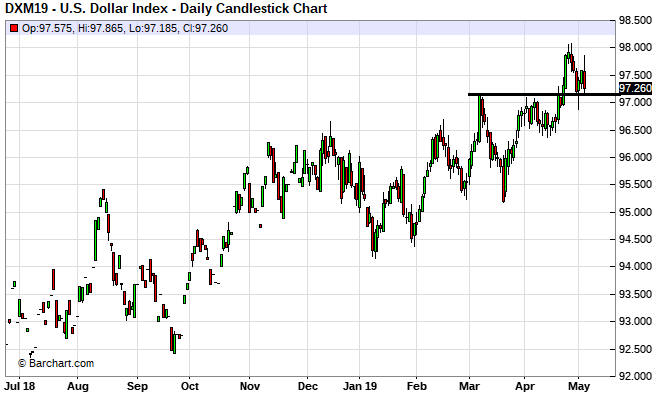
1) The Dollar Index (DX) held
its upside breakout last week, but the price action kept alive the
possibility of a bearish signal in the form of a failed breakout.
2) Gold, silver and the associated mining indices should begin to rebound
very soon. The coming rebounds probably will be counter-trend reactions
rather than new multi-month upward trends, although a downward reversal in
the DX could lead to tradable strength in the gold sector.
3) The
US stock market and many other stock markets are now very stretched to the
upside on a short-term basis. This should mean that multi-week pullbacks
begin soon, but the intermediate-term rallies probably aren't over.
4) There's a good chance that a large T-Bond decline will commence
before mid-year, possibly following a test of the March high.
5) We
are holding a cash reserve of 30%-35%.
Global Monetary
Inflation Update
Here is our monthly update on
what's happening on the monetary inflation front in a few different
regions/countries.
The G2 (US plus euro-zone) monetary inflation
rate dropped to a 10-year low in March-2019 and has now spent 19 months
below the boom-bust threshold of 6%. Refer to the following chart for
details.
The low rate of G2 monetary inflation stems from the very
low rate of money-supply growth in the US. During March the year-over-year
(YOY) rate of growth in euro supply was 7.6%, which although well down
from a 2014 peak of 14% is still quite high. The rate of growth in US$
supply, however, was only 1.8%.
The slow (by modern standards)
rate of G2 money-supply growth boosts the risk that a global recession
will begin in 2019, but, as noted in the past, the monetary inflation rate
is a long-term indicator that leads economic and financial-market
conditions by amounts of time that can vary substantially from one cycle
to the next. When attempting to predict the start time of the next
recession we therefore rely on other leading indicators, three of which
were discussed in last week's Interim Update.
Australia's monetary inflation rate has picked up a little over the
past few months, but the country remains on the verge of monetary
deflation.
The very slow money-supply growth has had an effect on
Australia's property market, in that over the past 12 months residential
property prices have fallen by an average of 6.9% on a nationwide basis
and 10.9% in Sydney (the largest and most expensive city in Australia).
Refer to the article posted
HERE for more detail.
Actually, the decline to near zero in
Australia's monetary inflation rate is both a cause and an effect of the
slight (to date) deflation of the property investment bubble. Commercial
banks have been making it more difficult for house buyers to obtain
credit, leading to a pullback in prices and a slowdown in the pace at
which new money is created.
In January-2019 the year-over-year (YOY) growth rate of China's M1
money supply dropped to its lowest level since 1989. There was an
insignificant up-tick in February, but the recent attempts by China's
government to promote credit expansion started to 'bear fruit' in March.
Refer to the following chart for details.
We wonder if this is too
little too late to kick-start a new surge in the demand for industrial
commodities.
Hong Kong hasn't escaped the general monetary-inflation slowdown. As
illustrated below, the YOY rate of growth in HK's M2 money supply has
languished near a 10-year low in the 1%-4% range over the past several
months.
Remarkably, HK's low monetary inflation rate is yet to have
a pronounced effect on the world's most expensive real estate. Property
prices dropped in HK during August-December of last year, but they rose in
January and the
majority view is that a rise to new highs is in store.
Due to
the monetary backdrop, we think there's a high risk of a double-digit
decline in HK property prices over the next 12 months.
Almost everyone knows that the Bank of Japan (BOJ) has pumped a huge
amount of money into the Japanese economy, so the lack of "price
inflation" in Japan is something of a quandary. Analysts have let their
imaginations run wild in an attempt to explain this strange set of
circumstances, and the situation in Japan has even been cited as proof
that increasing the money supply doesn't cause prices to rise. However,
anyone who didn't blindly assume that the BOJ's actions were leading to
rapid money-supply growth and instead took the trouble to check what was
actually happening to Japan's money supply would quickly realise that
explaining Japan's lack of "price inflation" requires no stretch of the
imagination. The fact is that Japan's monetary inflation rate over the
past 25 years has been consistent with an "inflation" rate of
approximately zero.
The persistently low rate of monetary inflation
in Japan is illustrated by the following chart. The chart shows that the
YOY rate of increase in Japan's M2 money supply averaged about 2% over the
past 27 years and about 2.5% over the past 10 years. It is currently about
2.4%. Assuming productivity growth of 2%-3%, these money-supply figures
are consistent with a flat general price level.
Note that QE in Japan is different from QE in the US. When the Fed
implements QE it boosts the supply of bank reserves and the supply of
money on a one-for-one basis (bank reserves aren't counted in the money
supply), but the BOJ's QE adds far more to bank reserves than to the money
supply. Note also that the Fed's QE created a lot less "price inflation"
than many people were expecting for the reasons outlined
HERE.
The Japanese economy has benefited from the persistently
slow rate of monetary inflation and the resulting stability of the
currency, but at the same time it has been hurt by the massive diversion
of resources to the government. The net result is an economy that isn't
exactly vibrant, but also isn't that bad.
To summarise the above
information, the pace at which new money is being created around the world
remains unusually slow.
Commodities
The Platinum Group
Metals (PGMs)
In the 8th April Weekly Update we noted that
platinum had finally begun to demonstrate the outperformance justified by
its extremely low price relative to other precious metals. We also noted
that the US$ platinum price was a little stretched to the upside on a
short-term basis and could soon commence a correction, but that
significant additional gains were likely prior to the next multi-month
top.
The price topped at $920 during the next trading day and then
commenced a correction. The correction may have ended at $847 last week.
Ideally (from a bull's perspective) the price will remain above the
20-week MA (the black line on the following chart) on a weekly closing
basis over the next few months.
We think that platinum is a buy in
the mid-$800s.
Turning to another of the PGMs, it is fair to say that the palladium
market was well and truly into bubble territory in March-2019. This is
evidenced by the near doubling of the palladium price over the preceding 7
months and palladium's extremely rich valuation relative to almost all
other commodities.
It's possible that the sharp decline in the
palladium price from its March-2019 high marked the bursting of the
bubble, but as mentioned in the 1st April Weekly Update it's more likely
that the decline is the start of a multi-month correction. This is based
on a comparison with the palladium rally of 1997-2000 and the fact that
the end of the first parabolic move in a cyclical advance generally
doesn't mark the end of the cycle.
If we are dealing with a
multi-month correction rather than the start of a bubble collapse then the
palladium price should not give a weekly close below its 50-week MA (the
blue line on the following chart).
Oil remains in correction mode
The knee-jerk
reaction to the news that the US government was removing waivers on
sanctions against buyers of Iranian two weeks ago pushed the oil price
above resistance at $64-$65 and created at least a multi-week top. The
price has since pulled back to moving-average support at around $61.
The test of the 50-day and 200-day MAs could lead to a price bounce,
but we doubt that the correction is over.
The Oil Services ETF (OIH) has dropped a lot further (in percentage
terms) than the oil price over the past two weeks. Although its correction
probably isn't over, it has almost reached the 'buy zone'.
We think
that OIH would be a good candidate for new buying at $15.50-$16.00.
The Stock Market
The NASDAQ100 Index (NDX) has
risen for 8 weeks in a row and on 18 of the past 19 weeks, which means
that it is immersed in one of the most relentless rallies in its history.
The following weekly chart shows that it has just achieved consecutive
weekly closes above last year's high, so we can be certain that this is
not a bear-market rally. It is an extension of the cyclical bull market
that commenced in 2009.
The S&P500 Index (SPX) has just achieved its first weekly close above
last year's high, but the new high is too marginal to be viewed as a
breakout. It is a test of the 2018 high. However, the NYSE Advance-Decline
Line (ADL), which is shown in the bottom section of the following daily
chart, broke into all-time-high territory almost three months ago and
continues to trend upward.

Prior to last Friday there was a minor bearish
divergence/non-confirmation in the form of the Russell2000's inability to
close above its February-2019 high, but that divergence was eliminated on
Friday. The RUT closed at a new high for the year on Friday, although it
remains well below last year's high.
The relative weakness in the banking sector could be viewed as a
bearish divergence, but we suspect that the Bank Index (BKX) is in the
process of becoming relatively strong. That is, we suspect that the
up-turn in the BKX/SPX ratio from its March low (refer to the bottom
section of the following chart) has staying power. This is linked to our
expectation that long-term interest rates will rise over the next 6-12
months and to bank stocks being attractively valued, on average, relative
to the broad market. Consequently, although it is not a trade we plan to
do we like the idea of simultaneously going long KBE (the Bank ETF) and
short SPY.
This is a topic we plan to revisit within the next
couple of weeks.
Due to the small additional gains made by most US stock indices last
week, the market's position today is similar to what it was a week ago.
Therefore, although the market has shown more near-term resilience than
expected, the following paragraphs from last week's commentary still
apply:
"The US stock market is very 'overbought' on a
short-term basis and moderately 'overbought' on an intermediate-term
basis. Considering the SPX's position relative to major resistance this
probably means that a correction will begin within the next few days,
perhaps following a spike by this index to a new all-time high. Supporting
this conclusion are the recent downward reversals in the oil price and
China's stock market.
The coming multi-week decline could be steep,
but due to the performance of the NYSE Advance-Decline Line it is more
likely to be a correction within an on-going intermediate-term upward
trend than the start of a new intermediate-term downward trend."
Two events could have an influence on how the US stock market trades
over the next few weeks. The first and lesser important of these events is
Uber's IPO, which is scheduled to happen late this week. The IPO a few
weeks ago of Lyft, Uber's main ride-sharing competitor in the US, was a
flop, with the shares now trading about 15% below the IPO price. We
suspect that Uber will perform better post-IPO, but in any case the event
could mark a short-term turning point for the overall market.
The
more important event is the potential US-China trade deal. There's a good
chance that a deal will be signed by presidents Xi and Trump in June,
simply because both men want it to happen.
Anticipation of an end
to the "trade war" was not the main driver of the rally from the
December-2018 low. The main drivers were the Fed's aboutface and the
extent to which the market was stretched to the downside at the time of
the 26th December upward reversal. However, optimism that the
government-imposed restrictions on international trade (and hence on
economic growth) would soon be eliminated or reduced has been a
significant part of the bullish narrative.
We think that the big
event will be the announcement of a specific date for a Xi-Trump meeting
rather than the actual signing of a document confirming the details of a
trade agreement, because once a meeting is scheduled it will be known that
a deal has been done.
If the announcement of a Xi-Trump meeting
happens with the SPX near an all-time high then the knee-jerk reaction to
the news could establish a top that holds for a few months.
This week's
significant US economic events
[Notes:
1) The most important events
(to the markets) are shown
in bold. 2) A list of global economic events can be found
HERE]
| Date | Description |
| Monday May-06 | No important events scheduled |
| Tuesday May-07 | Consumer Credit |
| Wednesday May-08 | No important events scheduled |
| Thursday May-09 |
Trade Balance PPI |
| Friday May-10 |
CPI Treasury Budget |
Gold and the Dollar
As mentioned in last week's Interim Update, a sustained break in the
Dollar Index below 97 could spur a more substantial rebound in the
gold-mining sector than currently appears likely.
The
Currency Market
The COT data indicate that speculators, as
a group, are betting aggressively on an extension of the US dollar's
upward trend against most other major currencies, with the biggest bets
being on further weakness in the Swiss franc (SF), the Australian dollar
and the Yen. No market ever reversed course simply because speculative
sentiment became lopsided, but this means that there will be plenty of
fuel to support a downward move in the US$ if the trend reverses for some
other reason.
Last week the DX pulled back to support at 97.0-97.2.
It briefly traded below support on Wednesday in anticipation of a further
'dovish' tilt by the Fed and then rebounded in the aftermath of the Fed's
latest words of wisdom. This price action was slightly positive as it
implied that the preceding week's upside breakout had been successfully
tested, but Friday's price action was slightly negative. On Friday the DX
reversed downward despite a strong Employment Report.
Friday's
downward reversal left the DX precariously poised near support at the end
of the week. Consequently, the potential for a failed upside breakout
still exists.
The Swiss franc (SF) has begun to recover from the 'oversold' extreme
reached during the week before last. As mentioned a week ago, the most
likely path from here is a rebound to the 50-day MA (the blue line on the
following chart) and then a decline that tests or undercuts the April low.
This would set the stage for a longer and stronger rebound.
Updates
on Stock Selections
Notes: 1) To review the complete list of current TSI stock selections, logon at
http://www.speculative-investor.com/new/market_logon.asp
and then click on "Stock Selections" in the menu. When at the Stock
Selections page, click on a stock's symbol to bring-up an archive of
our comments on the stock in question. 2) The Small Stock Watch List is
located at http://www.speculative-investor.com/new/smallstockwatch.html
![]() Company
news/developments for the week ending Friday 3rd May 2019:
Company
news/developments for the week ending Friday 3rd May 2019:
[Note: AISC = All-In Sustaining Cost, EBITDA = Earnings Before
Interest, Tax, Depreciation and Amortisation (a measure of cash flow), EV
= Enterprise Value or Electric Vehicle, FS = Feasibility Study, FY =
Financial Year, IRR = Internal Rate of Return, ISR = In-Situ Recovery, JV
= Joint Venture, MD&A = Management Discussion and Analysis, M&I = Measured
and Indicated, NAV = Net Asset Value, NPV(X%) = Net Present Value using a
discount rate of X%, NSR = Net Smelter Return or Net Smelter Royalty, P&P
= Proven and Probable, PEA = Preliminary Economic Assessment, PFS =
Pre-Feasibility Study]
*Alkane Resources (ALK.AX)
published its quarterly report for the March-2019 quarter (the
third quarter of FY2019). The report revealed another above-plan
performance from the Tomingley Gold Operation (TGO), with production of
10.7K ounces at an AISC of A$956/oz. The on-going better-than-expected
performance of the TGO has prompted another increase in FY2019 gold
production guidance. Originally it was 30K-35K ounces, then three months
ago it was boosted to 35K-40K ounces, and now it is 42K-47K ounces. The
company produced 37.4K ounces during the first three quarters of FY2019,
so the expected production during the final quarter is 5K-10K ounces.
The Tomingley open pit is depleted and the current production is
solely from the processing of stockpiles. That's why the amount of gold
produced has been trending downward. However, plans are in place to extend
the life of the operation by developing an underground mine and exploring
for additional resources. Initial production from the underground mine is
on track to begin during the December-2019 quarter and recent drilling
results suggest the potential to establish a new pit within a few
kilometres of the existing plant.
The company's efforts to arrange
financing and offtake agreements for the Dubbo specialty metals project
have continued, but no tangible progress was reported.
ALK has a
strong balance sheet, with no debt and cash, bullion plus listed
investments of A$78.8M. This constitutes a quarter-over-quarter decline of
A$1.7M.
*Clean TeQ (CLQ.AX, CLQ.TO)
published its quarterly report for the March-2019 quarter. The report
stated that the company had cash of A$100M at the end of the latest
quarter, which amounts to a reduction of about A$17M over the course of
the quarter and A$52M over the past three quarters. This means that CLQ
continues to spend rapidly as it ploughs ahead with the front end
engineering and design (FEED) for the Sunrise nickel-cobalt project in New
South Wales, Australia.
The FEED is being done by Metallurgical
Corporation of China Ltd (MCC) and is scheduled to be complete in Q3-2019.
It is envisaged that an output of the FEED will be a fixed price
procurement and construction contract for MCC.
From our
perspective, the key to CLQ's long-term risk/reward is how the US$1.5B
estimated pre-production capex is financed. This will determine whether
the more appropriate course of action is to 'cut and run' or average down.
Ideally, financing will involve a project-level investor along similar
lines to the deal that was done by Kidman Resources (KDR.AX) to fund the
development of its Mt Holland lithium project. We were therefore pleased
to read the following in CLQ's latest report:
"Clean TeQ is
actively engaging with a number of project financiers and potential
offtake/joint venture partners in order to secure an equity financing
package for the project. The drive for end-users to secure high-quality,
long-term supply of nickel and cobalt sulphates remains strong."
*Golden Arrow Resources (GRG.V) published its
financial report for the quarter and year ending 31st December 2018. The
report shows working capital of roughly zero, down by C$2.7M since the end
of the September quarter. It also shows the addition of C$11.2M of
long-term debt due to a US$8M draw-down on the US$10M credit facility
provided to GRG by SSR, its JV partner. This effectively means that GRG
spent about C$14M during the December-2018 quarter.
The large
quarterly cash drain was due to GRG's share of the costs of Puna
Operations Inc. (POI), the JV that is owned 25% by GRG and 75% by SSR
Mining. The JV owns the Pirquitas-Chinchillas silver-lead-zinc project in
Argentina, which was in the process of being ramped up during the
December-2018 quarter.
The Pirquitas-Chinchillas project is now
producing metal at near its design rate, so GRG should now be cash-flow
positive or close to it. Furthermore, GRG raised C$4.7M via an equity
financing during the March-2019 quarter, so the next quarterly report
should contain a stronger balance sheet.
GRG is a leveraged play on
silver and should perform extremely well once the market embarks on a
major rally.
*Cobalt 27 Capital (KBLT.V)
published its financial results for the quarter and year ending 31st
December 2018.
At 31st December the company had no long-term debt,
US$46M of working capital (down from US$50M at the end of the preceding
quarter) and US$200M of undrawn credit. This means that it had US$246M of
available financing.
The latest balance sheet doesn't include the
purchase of Highland Pacific (HIG.AX), the owner of 8.56% of the Ramu
nickel-cobalt mine in Papua New Guinea. The purchase should be completed
by mid-May at a cost of about US$70M, an amount that can be comfortably
funded using KBLT's existing financial resources.
The HIG purchase
will give KBLT part ownership of a profitable mining operation and could
enable the company to start paying dividends.
*Mineral
Resources (MIN.AX), a Western Australia based company that
produces lithium and iron-ore and that provides pit-to-port mining
services, published its quarterly report for the March-2019 quarter (the
third quarter of FY2019).
The highlight of the quarter was a 41%
increase in the amount of iron-ore shipped by the company. This was done
to take advantage of the relatively high iron-ore price.
Also worth
mentioning is that submissions were lodged during the quarter with the
relevant regulatory authorities in Australia and China in relation to
MIN's sale of a 50% interest in the Wodgina Lithium Project to Albemarle
Corporation (NYSE: ALB), the world's largest lithium producer, for
US$1.15B in cash. The sale is expected to be completed before the end of
the 2019 calendar year.
As noted in previous TSI commentaries, the
deal with ALB values Wodgina at A$17 per MIN share. This implies that just
one of MIN's assets is worth more than the company's current market cap.
Separately, MIN upwardly revised its FY2019 EBITDA guidance from the
A$280M-$320M estimate provided last November to A$360M-$390M. The reason
for the improved guidance wasn't mentioned in MIN's press release, but we
assume it has a lot to do with the higher iron-ore price and production.
*Premier Gold (PG.TO) reported the
discovery of high-grade gold mineralization in the first hole drilled at
the McCoy-Cove project's Antenna target. The drilling was funded by
Barrick Gold (GOLD) as part of an earn-in obligation (GOLD can earn 60% of
the project by spending US$22.5M on exploration).
The discovery
hole contained a 118.9m intercept grading 4.12 g/t gold. Furthermore, the
drill hole was lost at a depth of 725.4m in mineralisation grading 5.59
g/t Au. Barrick liked this result enough to exercise its option to become
the operator of the joint venture.
This is obviously very good
news.
Separately, PG reported March-quarter gold production from
its Mercedes mine (Mexico) of 17.6K ounces. According to the company, this
is in line with its plan. Annual production guidance of 75K-85K ounces of
gold has been maintained.
![]() List
of candidates for new buying
List
of candidates for new buying
From within the ranks of TSI
stock selections the best candidates for new buying at this time, listed
in alphabetical order, are:
1) AAU (last Friday's closing price:
US$0.51)
2) KBLT.V (last Friday's closing price: C$4.17)
3)
PG.TO (last Friday's closing price: C$1.60)
4) SBB.TO (last
Friday's closing price: C$1.02)
5) TK.V (last Friday's closing
price: C$0.33)
The above list is limited to five stocks. It
sometimes will contain less than five, but it never will contain more than
five regardless of how many stocks are attractively priced for new buying.
Chart Sources
Charts appearing in today's commentary
are courtesy of:
https://stockcharts.com/
https://www.barchart.com/