


--
Weekly Market Update for the Week Commencing
6th August 2018
Big Picture
View
Here is a summary of our big picture
view of the markets. Note that our short-term views may differ from our
big picture view.
The BULL market in US Treasury Bonds
that began in the early 1980s ended in mid-2016, but there will be many years
of topping action in bond prices and bottoming action in bond yields before
major new trends get underway. A major decline in government bond prices will
unfold during the 2020s. (Last update: 11 September 2017)
The stock market, as represented by the S&P500 Index,
commenced
a secular BEAR market during the first quarter of 2000, where "secular
bear market" is defined as a long-term downward trend in valuations
(P/E ratios, etc.), gold-denominated prices and inflation-adjusted prices. This secular trend will bottom
in 2020 or later.
(Last update: 11 September 2017)
A cyclical BEAR market in the
US
Dollar
began in 2016-2017.
(Last
update: 11 September 2017)
Gold commenced a
secular bull market relative to all fiat currencies, the CRB Index,
bonds and most stock market indices during 1999-2001.
This secular trend will peak in 2020
or later.
(Last update: 11 September 2017)
Commodities,
as represented by the CRB Index, commenced a
secular BULL market in 2001 in nominal dollar terms. The first major
upward leg in this bull market ended during the first half of 2008, but
a long-term peak won't occur until 2020 or later.
(Last
update: 11 September 2017)
Copyright
Reminder
The commentaries that appear at TSI
may not be distributed, in full or in part, without our written permission.
In particular, please note that the posting of extracts from TSI commentaries
at other web sites or providing links to TSI commentaries at other web
sites (for example, at discussion boards) without our written permission
is prohibited.
We reserve the right to immediately
terminate the subscription of any TSI subscriber who distributes the TSI
commentaries without our written permission.
True
Fundamentals Summary
[Notes:
1) The date shown next to the current True Fundamentals Model (TFM) signal is
when the most recent change occurred. 2) Charts of the Gold and Equity
TFMs are included in the "Charts and Indicators" section of the TSI web
site]
|
Market |
True Fundamentals Model (TFM) |
|
Gold (US$ Price) |
Bearish (20 Jul 2018) |
|
US Equity (SPX) |
Bearish (29 Jun 2018) |
|
Currency (Dollar Index) |
Bullish (27 Apr 2018) |
|
Commodities (GNX) |
Bearish (01 Jun 2018) |
Last week's posts at the TSI Blog
Have the Chinese pegged the gold price?
Summary of current
thinking/positioning
1) Despite numerous attempts,
the Dollar Index (DX) has failed to close above resistance at 95. This
leaves us expecting a DX decline to 92 and a euro rally to 1.20 within the
next 1-2 months.
2) There is a good set-up for counter-trend
rallies in the gold and silver markets, but upward reversals have not been
signaled. This leaves the door open to new 2018 lows prior to meaningful
rallies getting underway.
3) The gold-mining indices extended their
downward trends into August, but are yet to experience a capitulation.
This creates the risk that a speculative capitulation lies ahead. We have
substantial exposure to the gold-mining sector and have hedged against
this short-term risk via GDX put options.
4) There are numerous
divergences within the US stock market. With monetary conditions
tightening, the short-term downside risk appears to be high.
5)
Most industrial commodities probably will remain in correction mode for
another 1-3 months.
6) The T-Bond price should have an upward bias
(meaning: the T-Bond yield should have a downward bias) for at least the
next two months.
7) We are holding a cash reserve of around 30% and
looking for opportunities to build up this reserve.
The Fed, the
yield curve and "inflation"
The following chart shows that
over the past fortnight the 10yr-2yr yield spread came within 0.24% of
zero. This means that the US yield curve recently came within 0.24% of
inverting. Based on speeches made over the past couple of months we know
that senior Federal Reserve officials are worried that the yield curve
will soon invert.
The Fed's senior people are obviously aware that the yield curve has
inverted prior to recessions in the past and are concerned that an
inversion would bring on the next recession. Therefore, at some point over
the next few months the Fed may take actions designed to steepen the yield
curve. If so, will this reduce the risk of recession?
The answer is
yes and no. The Fed could reduce the risk that a recession will begin in
2019, but only by setting the stage for an even more painful economic
decline to begin in 2020. Also, the Fed representatives who are concerned
about the historical relationship between yield-curve inversion and
recession are assuming that correlation implies causation. However, a
yield curve inversion has never been the cause of a recession. A yield
curve inversion is just a symptom that a credit-fueled boom is 'long in
the tooth'. The boom itself is the cause of the bust and it's the reversal
of the curve from flattening to steepening that signals the death of the
boom.
That being said, at this point a reversal in the US yield
curve from flattening to steepening would be a reliable signal that the
boom is over only if it were driven by the market. If, instead, it were
driven by the Fed, for example, by the Fed prematurely ending its
rate-hiking due to fear of a yield-curve inversion, then it more likely
would be a signal that the boom was going to enjoy a 'final fling'. In
this case, the final fling would involve rising inflation expectations --
gradually at first and then rapidly.
When we look at the 10-year
and 2-year T-Note yields individually it isn't hard for us to imagine the
US yield curve becoming inverted within the next few months. In
particular, the 10-year T-Note yield appears to be completing a short-term
topping pattern on the chart (see below) at a time when speculators in
10-year T-Note futures have a record-high net-short position (meaning:
there is presently a record-high speculative bet that the yield will
rise). The combination of the chart and speculative positioning suggests
the short-term potential for the 10-year yield to pull back to 2.5%-2.6%.
At the same time, the 2-year T-Note yield remains in a strong upward
trend (see below), and with the Fed set to increase its targeted overnight
interest rate to 2.00-2.25% in September there does not appear to be much
short-term downside potential.
If the 2-year yield stays where it is and the 10-year yield achieves
the objective suggested by its short-term topping pattern, then the US
yield curve will invert. This could happen within two months.
Based on what has been said by several Fed officials, an inversion of the
yield curve likely would provoke some panic within the halls of the
central bank that would manifest initially as a temporary cessation of the
rate-hiking program. Therefore, it's very possible that the September rate
hike will be the last rate hike for many months.
If the Fed signals
the temporary cessation of its rate-hiking program within the next two
months the likely consequences would include a small decline in rates at
the short end of the curve and, in response to higher inflation
expectations, the start of a multi-quarter upward trend in rates at the
long end of the curve. In other words, it's likely that the Fed would set
in motion a substantial steepening of the yield curve driven by rising
inflation expectations.
The metals
'correction' continues
Only the commodity markets will
be adversely affected by the reduction of international trading and
economic growth that will result from the protectionist measures and
counter-measures that have been implemented or are under consideration. At
least, that's the message from the market action of the past two months.
During this period the industrial metals markets were pummeled while stock
markets were calm.
For example, the copper market completed a
deceptive intermediate-term topping pattern in early-June and then tanked.
It appears to be on its way to major support near US$2.50, with or without
an intervening rebound to test resistance in the mid-$2.90s.
For another example, the cobalt price ran up to a high in March,
leveled off for about three months and then plunged over the past two
months. It is now down by about 30% from its Q1 high.
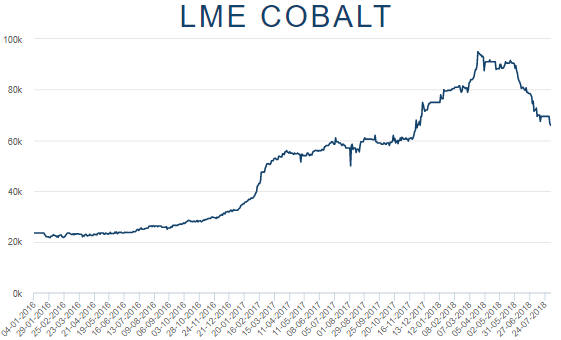
We think that this year's price declines in copper, cobalt and most of
the other important industrial metals are intermediate-term corrections
within major bullish trends that will resume before year-end. The major
bullish trends are powered by a very compelling fundamental story in the
form of exponential growth in EV production and by the likelihood that the
Fed will veer off its monetary tightening course at early signs of
trouble. Until recently we thought that it would be a sizable stock market
decline that pushed the Fed off its tightening course, but it is beginning
to look more like a yield curve inversion will be the disruptive force.
The Stock Market
Tesla Update
When it comes to Tesla (TSLA), the bad news is always the actual
results of the business while the good news is always what the company's
CEO promises the business will achieve in the future. In the minds of the
many diehard TSLA bulls, it's irrelevant that these promises have usually
amounted to nothing in the past.
It was the same story last week.
The company announced that it had made a record-breaking quarterly loss of
US$717M and burned through about $700M of cash during the latest quarter,
but the stock price rocketed upward following this news because Elon Musk
was polite to analysts on the conference call and promised that future
quarters would be profitable.
Perhaps TSLA will be able to report
positive net earnings for a quarter or two, but it will take a lot more
than a shift to nominal profitability to justify the company's $64B
enterprise value. Also, even if TSLA is able to sort out its manufacturing
issues and begin producing more cars at a lower cost per car, it is about
to a) lose the benefit of the tax credit that encouraged a lot of the
early Model 3 purchases and b) face a rapid rise in competition from the
likes of Volkswagen, BMW, Mercedes, Jaguar, Audi and Porsche.
It's
extremely improbable that TSLA will ever sell enough vehicles with a
sufficient profit margin to justify its current market valuation.
Bankruptcy is a far more likely outcome. However, a large herd of
investors remains committed to the TSLA story and prepared buy/hold
regardless of valuation. At the same time, the stock's downside risk is
well known and, as a result, TSLA is the most 'shorted' stock in the US
market.
Due to the large number of shares sold short there are
periodic bursts in the stock price fueled by short covering. As
illustrated by the following weekly chart, such a burst occurred last
week. Almost all of last week's 17% gain occurred on the day after the
announcement of the record quarterly loss.
We may attempt another
bearish TSLA speculation in the future, but at the moment we have this
stock in the 'too hard basket'.
Current Market Situation
The S&P500 Index
(SPX) reversed course after touching its channel top during the week
before last, but last week it returned to the vicinity of its July high.
The top of its rising channel now coincides with the January high, meaning
that there is now a confluence of resistance at around 2875. This
resistance may be tested within the next few days, but it shouldn't be
exceeded on a daily closing basis and mustn't be exceeded on a weekly
closing basis if we our overarching market view is correct.
The NASDAQ100 Index (NDX) has been stronger than the SPX over the past
few months, but, as mentioned in last week's Interim Update, is closer
than the SPX to confirming a downward reversal. That's because it would
have to do no more than close below last Monday's low of 7158 to suffer a
potentially significant downside breakout.
The upshot is that the US stock market has large short-term downside
potential, but the potential is yet to be confirmed by the price action.
This week's
significant US economic events
[Notes:
1) The most important events
(to the markets) are shown
in bold. 2) A list of global economic events can be found
HERE]
| Date |
Description |
|
Monday Aug-06 |
No important events scheduled |
|
Tuesday Aug-07 |
Consumer Credit |
|
Wednesday Aug-08 |
No important events scheduled |
|
Thursday Aug-09 |
PPI |
|
Friday Aug-10 |
CPI
Federal
Budget |
Gold and the Dollar
Gold
The Fundamentals
When most market
analysts state whether the fundamental backdrop is bullish or bearish for gold,
they are stating their opinion and their opinion is most likely based on gut
feel. They have no way of objectively quantifying the fundamental situation.
Instead, they look around and come to a conclusion based on what they see.
The most obvious problem with this approach is that any conclusions will be
strongly influenced by personal biases. Another problem is that the fundamental
drivers of the gold price aren't statistics such as the money supply and the
amount of government debt, but the general PERCEPTIONS of what these statistics
mean for economic growth, the financial system, "inflation" and interest rates
in the future.
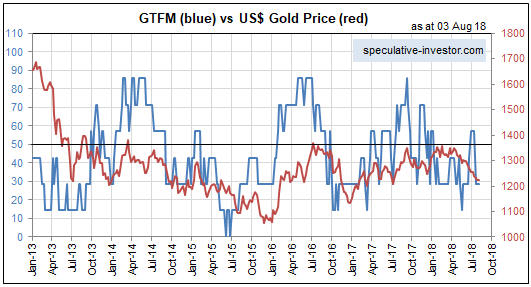
Our Gold True Fundamentals Model (GTFM) is not influenced
by our personal biases. The Model's output is what it is, regardless of what we
think of the economic and financial-market situations. Also, the Model's inputs
are largely based on how market participants collectively view the economic and
financial-market situations. For example, we may very well think that the
economy is 'skating on thin ice', but if credit spreads are very narrow then we
know that our view is an outlier and that economic perceptions are not
supportive of the gold price.
When constructing the GTFM we considered --
based on the general idea that gold's value is the reciprocal of confidence in
the financial system and the economy -- what should be the main influences on
the gold price. This gave us a list of potential price drivers. We then tested
each of these potential drivers against the price data to confirm that there was
a significant correlation. For example, it can be shown that there is a strong
and consistent relationship between the TIPS yield and the US$ gold price and
between credit spreads and the US$ gold price, but no consistent relationship
between the US$ gold price and either the CPI or the level of federal government
debt. The result was a list of seven factors whose inclusion in a gold model was
justified both logically and empirically.
The GTFM is sensitive to shifts
in the fundamental backdrop. This makes it quick to signal significant new
trends, but also makes it susceptible to being 'whipsawed'. For example, it got
whipsawed between late-June and mid-July of this year when it went from bearish
to bullish and back to bearish. It will continue to get whipsawed from time to
time, but over the past 15 years the intermediate-term trends in the gold price
have always been consistent with where the GTFM has spent the bulk of its time.
The GTFM remained in bearish territory last week.
In
the short term, the most likely cause of a positive shift (from gold's
perspective) in the fundamental backdrop is a T-Bond rally combined with a
decline of at least a few percent in the S&P500 Index. However, looking beyond
the next few months we can envisage a very gold-bullish fundamental backdrop
emerging on the back of rising US inflation expectations. Rising inflation
expectations are bullish for gold to the extent that they reduce real interest
rates, steepen the yield curve and weaken the US$.
A substantial rise in
inflation expectations probably won't be a factor in the financial markets over
the remainder of this year, but it could be the most important factor during
2019-2020.
Sentiment
There won't
be something more than a short-term rebound in the gold price until the GTFM
makes a sustained shift into bullish territory. However, the sentiment backdrop
is now very supportive of the gold price, so the next short-term rebound should
be strong.
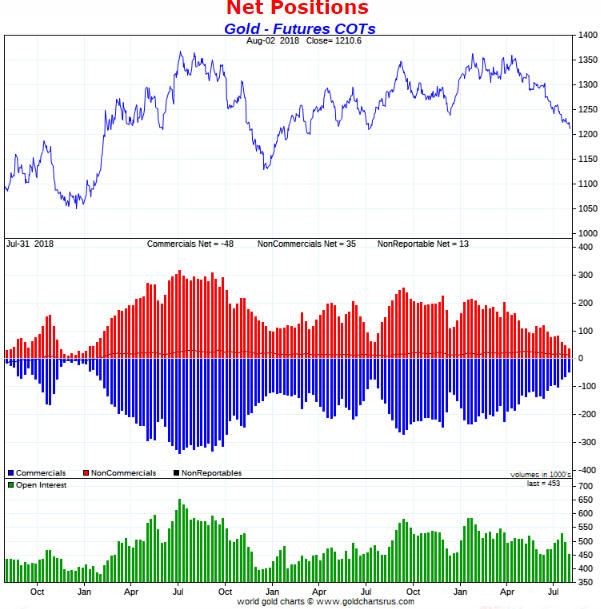
A week ago we wrote: "The COT situation is supportive, but
not decisively so because the open interest in gold futures is too high.
Important lows in the gold price tend to go with relatively low open interest."
As illustrated by the green bars in the bottom section of the following
chart, there was a significant decline in the gold futures open interest (OI)
last week. We now have OI in the bottom third of its 3-year range and the total
speculative net-long position at its lowest level since early-2016.
Consequently, for the first time this year the COT situation is decisively
supportive of the gold price.
As illustrated by the chart included in last week's Interim Update, the
Consensus-inc sentiment survey is also decisively supportive.
The upshot
is that sentiment is now a strong tail-wind for the gold price.
The Price Action
The US$ gold price
tested its July low last Friday and then rebounded. The price action was
slightly bullish, but a reversal has not been signaled yet.
The following
paragraph from last week's commentary remains applicable:
"Until an
upward reversal is signaled via a daily close above $1240 there will be a risk
of a final decline to a new 12-month low. As illustrated by the following daily
chart, no upward reversal has been signaled yet. A decline to a new low probably
would take the form of a downward spike to the $1190s, but there's a risk of a
larger decline. The most likely catalyst for a larger decline would be an upside
breakout in the Dollar Index."
Summing up, in the gold market we have unequivocally bearish fundamentals,
unequivocally bullish sentiment, and price action that could be either a base
(an upward reversal in the making) or a consolidation within an on-going
decline. The sentiment situation could enable a sizable ($100+) short-term
rebound even if the fundamentals remain bearish, but until an upward reversal is
signaled there will be a high risk of a decline to new 12-month price lows.
Silver
Relative to support/resistance, the US$
silver price is in a very similar position to the US$ gold price. Like gold,
silver recently broke below intermediate-term support defined by its
December-2017 low. Also like gold, silver tested its July low last Friday and
then rebounded.
Unlike the situation in the gold market, current sentiment in the silver market
does not constitute a strong tail-wind for the price. In fact, thanks to
persistent optimism on the part of the dumbest money (the "NonReportable"
traders) and the relatively high open interest in silver futures, silver's
current COT situation is no better than neutral. However, the silver price
almost certainly will rebound when the gold price rebounds.
Gold
Stocks
Both the HUI and GDX (the Gold Miners ETF) ended the week
before last at major support levels, prompting us to write:
"The
gold-mining sector has reached a critical juncture. The indices/ETFs will either
hold support near their current levels and soon commence 2-4 month rallies OR
break below support and accelerate downward. The former outcome has the higher
probability, but due to last week's decline in the HUI/gold ratio and the fact
that the bullion market hasn't generated any evidence of a bottom we should be
prepared for the possibility that the latter outcome will happen."
Last week support held, but there was no rebound to speak of so the situation is
virtually unchanged. The gold-mining sector remains at a critical juncture.
The following daily chart shows that the lateral support level currently
being tested by GDX has been tested numerous times over the past 18 months. When
a support level has been tested this many times it usually will have to be
breached prior to the start of a substantial rally. This is because the
capitulation that happens in reaction to the violation of the obvious support
'clears the decks'. Therefore, ideally there will be a brief plunge by GDX to
well below $21 in the near future.
In the absence of a 'deck clearing'
plunge the best that we probably will get from GDX is a 1-3 month rebound to
$23-$25.
The Currency Market
Perhaps not surprisingly, the Dollar
Index (DX) is in the opposite situation to gold. Whereas the gold market is
facing bearish fundamentals and bullish sentiment, the DX is facing bullish
fundamentals and bearish (dangerously optimistic) sentiment.
The bullish
fundamental backdrop for the DX is due to the strength in US equities relative
to European equities and the expanding gap between US and European interest
rates (specifically, the increase in the US 10-year government bond yield
relative to the German 10-year government bond yield).
Regarding
sentiment, the following chart shows that over the past 10 years all of the
major peaks in the Consensus-inc bullish sentiment for the DX were in the
75%-80% range and that at the end of the week before last the DX's bullish
sentiment was 75%.
Last week the DX stayed inside its "rising wedge" and again failed to
achieve a weekly close above lateral resistance at 95. For details refer to the
daily chart displayed below. This week it could trade as high as 95.5 while
remaining within its "wedge", but it shouldn't give a weekly close above 95 if
we are dealing with a topping pattern rather than a mid-trend consolidation.
Interestingly, the following weekly chart shows that over the past 10 weeks
the DX has repeatedly risen to its 200-week MA (the blue line) without managing
to achieve a weekly close above this MA. It should continue to hold below its
200-week MA if we are dealing with a topping pattern.
Updates
on Stock Selections
Notes: 1) To review the complete list of current TSI stock selections, logon at
http://www.speculative-investor.com/new/market_logon.asp
and then click on "Stock Selections" in the menu. When at the Stock
Selections page, click on a stock's symbol to bring-up an archive of
our comments on the stock in question. 2) The Small Stock Watch List is
located at http://www.speculative-investor.com/new/smallstockwatch.html
 Company
news/developments for the week ending Friday 3rd August 2018:
Company
news/developments for the week ending Friday 3rd August 2018:
[Note: AISC = All-In Sustaining Cost, FS = Feasibility Study, FY = Financial
Year, IRR = Internal Rate of Return, ISR = In-Situ Recovery, MD&A = Management
Discussion and Analysis, M&I = Measured and Indicated, NAV = Net Asset Value,
NPV(X%) = Net Present Value using a discount rate of X%, NSR = Net Smelter
Return, P&P = Proven and Probable, PEA = Preliminary Economic Assessment, PFS =
Pre-Feasibility Study]
*Blackham Resources (BLK.AX)
published its quarterly activities and cash-flow reports for the June quarter.
Given that the company had announced its production results and net debt level
about two weeks earlier, the most important information in these reports was
already known.
The only new information of real interest to us was the
section titled "Controlled Placement Agreement". This section contained the
following:
"During July 2018, the Company entered into a Controlled
Placement Agreement (CPA) with Acuity Capital. The CPA provides BLK with up to
$10 million of standby equity capital over the coming 29 month-period.
Importantly, Blackham retains full control of all aspects of the placement
process, having sole discretion as to whether or not to utilise the CPA, the
quantum of shares issued, the minimum issue price of shares and the timing of
each placement tranche (if any). There are no requirements on Blackham to
utilise the CPA and Blackham may terminate the CPA at any time, without cost or
penalty. If Blackham does decide to utilise the CPA, Blackham is able to set a
floor price (at its sole discretion) and the final issue price will be
calculated as the greater of that floor price set by Blackham and a 10% discount
to a Volume Weighted Average Price over a period of Blackham's choosing (again
at the sole discretion of Blackham)."
This means that BLK's
management has given itself the flexibility to raise money (up to A$10M) by
selling new BLK shares in the stock market over the next 29 months at whatever
price it deems appropriate.
We view this news as negative, because the
"CPA" makes it easy for BLK's management to dilute the stock.
*Premier
Gold (PG.TO) reported drilling results from the Rey de Oro deposit (a
zone that will be brought into production this year) at its Mercedes gold-silver
mine in Mexico. The drilling confirmed the extension of a high-grade vein system
and included some excellent intercepts, with the best one being 36.65 g/t Au and
171.30 g/t Ag across 21.95 metres in Hole UG-R018-006.
This is obviously
good news.
Also in the good news department, PG advised that after a poor
first half production performance by the Mercedes mine, production is now
increasing as planned with July being the best month so far in 2018.
*Tinka Resources (TK.V) reported drilling results that extend
the high-grade zinc mineralisation at the company's Ayawilca project in Peru. It
appears that there are substantial widths of high-grade zinc below the
currently-defined resource and also that it will be possible to connect the
200m+ gap between mineral resources at the West and Central Ayawilca deposits.
This is good news. The Ayawilca deposit is already of sufficient size
and grade to be of interest to a large industrial-metals mining company and
looks set to get even better.
List
of candidates for new buying
From within the ranks of TSI stock
selections the best candidates for new buying at this time, listed in
alphabetical order, are:
1) AAU (last Friday's closing price: US$0.66)
2) CNL.TO (last Friday's closing price: C$3.74)
3) PG.TO (last
Friday's closing price: C$2.50)
4) PRQ.TO (last Friday's closing price:
C$0.93)
5) SBB.TO (last Friday's closing price: C$1.46)
The above
list is limited to five stocks. It will sometimes contain less than five, but it
will never contain more than five regardless of how many stocks are attractively
priced for new buying.
Osisko
Gold Royalties Warrants (TSX: OR.WT) added to the TSI List at C$1.05
Osisko Gold Royalties (OR, OR.TO) is like a hedge fund that invests in
gold/silver royalties, gold/silver streaming deals and junior gold/silver mining
stocks. Its current market cap is around C$1.9B, as is its book value.
We
previously wrote that the OR warrants (OR.WT on the TSX) would be added to the
TSI List if they traded at C$1.05. They traded at this price last week.
The warrants have an exercise price of C$36.50, meaning that they are a very
long way out of the money (OR ended last week at C$11.92, which is close to the
bottom of its 3-year range). However, they don't expire until 18th February
2022, so there is a lot of time for the sort of increase in the stock price that
would inject substantial value into the warrants.
Note that our interest
in these warrants isn't based on a belief that OR shares will trade well above
C$36.50 by February-2022. It's possible that they will, but that's not a bet we
would make. Our bet is simply that there will be a large-enough rally in the
stock price at some point over the coming year or two to cause the warrants to
trade at least 200% above their current price. A 50% gain in the stock price
probably would be enough if it happened within the next 12 months.
Update
to TSI
Small Stocks Watch List (SSWL)
Northern Empire
Resources (NM.V) is a small, exploration-stage gold miner that was
added to the SSWL in May of last year. Its speculative merits were subsequently
discussed four times in TSI commentaries, most recently in the 11th December
2017 Weekly Update.
Last Thursday it was announced that NM had agreed to
be acquired by Coeur Mining (CDE) in an all-stock transaction that initially
valued NM at C$1.64/share. Due to a post-announcement pullback in CDE's stock
price, NM shares ended the week at C$1.52.
At last week's closing price
NM was up by almost 200% from the time it was added to the SSWL. This is a good
result considering that the HUI was down by about 10% over the same period.
If you own NM shares you should take your profit by selling into the market
unless you want to own CDE shares. We don't want to own CDE shares.
NM
has been removed from the SSWL.
Chart Sources
Charts appearing in today's commentary
are courtesy of:
http://stockcharts.com/index.html
http://www.goldchartsrus.com/
http://www.lme.com/
