|
-- Weekly Market Update for the Week Commencing 6th October 2008
Big Picture
View
Here is a summary of our big picture
view of the markets. Note that our short-term views may differ from our
big picture view.
Bonds commenced a secular BEAR market in
June of 2003. (Last
update: 22 August 2005)
The stock market, as represented by the S&P500 Index, commenced
a secular BEAR market during the first quarter of 2000, where "secular
bear market" is defined as a long-term downward trend in valuations
(P/E ratios, etc.) and gold-denominated prices. This secular trend will bottom sometime between 2014 and 2020. (Last update: 22 October 2007)
The Dollar commenced a secular BEAR market during the final quarter of 2000. The
first major downward leg in this bear market ended during the first
quarter of 2005, but a long-term bottom won't occur until 2008-2010. (Last update: 28 March 2005)
Gold commenced a
secular bull market relative to all fiat currencies, the CRB Index,
bonds and most stock market indices during 1999-2001. This secular trend will peak sometime between 2014 and 2020. (Last update: 22 October 2007)
Commodities, as
represented
by the CRB Index, commenced a secular BULL market in 2001. The first
major upward leg in this bull market ended during the second quarter of
2006, but a long-term
peak won't occur until at least 2008-2010. (Last update: 08 January 2007)
Copyright
Reminder
The commentaries that appear at TSI
may not be distributed, in full or in part, without our written permission.
In particular, please note that the posting of extracts from TSI commentaries
at other web sites or providing links to TSI commentaries at other web
sites (for example, at discussion boards) without our written permission
is prohibited.
We reserve the right to immediately
terminate the subscription of any TSI subscriber who distributes the TSI
commentaries without our written permission.
Outlook Summary
Market
|
Short-Term
(0-3 month)
|
Intermediate-Term
(3-12 month)
|
Long-Term
(1-5 Year)
|
Gold
|
Bullish
(30-Jun-08)
|
Bullish
(12-May-08)
|
Bullish
|
US$ (Dollar Index)
|
Neutral
(10-Sep-08)
| Neutral
(22-Sep-08)
|
Neutral
(19-Sep-07)
|
Bonds (US T-Bond)
|
Neutral
(14-Jul-08)
|
Bearish
(22-Sep-08)
|
Bearish
|
Stock Market (S&P500)
|
Neutral
(02-Jun-08)
|
Neutral
(30-Sep-08)
|
Bearish
|
Gold Stocks (HUI)
|
Bullish
(30-Jun-08)
|
Bullish
(12-May-08)
|
Bullish
|
| Oil | Neutral
(03-Sep-08)
| Neutral
(22-Sep-08)
| Bullish
|
Industrial Metals (GYX)
| Neutral
(18-Jun-08)
| Neutral
(22-Sep-08)
| Bullish
|
Notes:
1. In those cases where we have been able to identify the commentary in
which the most recent outlook change occurred we've put the date of the
commentary below the current outlook.
2. "Neutral", in the above table, means that we either don't have a
firm opinion or that we think risk and reward are roughly in balance with respect to the timeframe in question.
3. Long-term views are determined almost completely by fundamentals,
intermediate-term views by giving an approximately equal weighting to
fundmental and technical factors, and short-term views almost
completely by technicals.
Inflation's New Upward Trend
Trend Change Signaled
In our 3rd October email alert we wrote: "The
Fed expanded its balance sheet by $254B during the one-week period
ending 1st October, which follows a $204B expansion during the
preceding week. As a result, the Fed's balance sheet has grown by
almost 50% within the space of just two weeks. This, we believe, is
unprecedented."
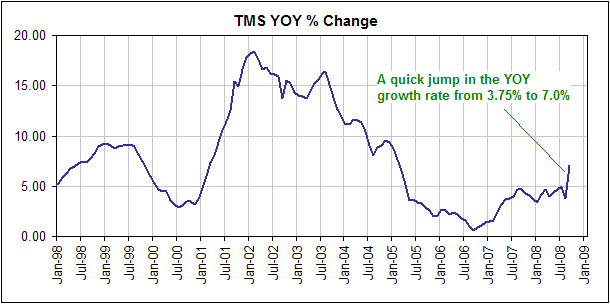
Last week's money creation by the Fed won't appear in broader
money-supply data until the end of this week, but the
week-before-last's expansion of the Fed's balance sheet has given the
True Money Supply (TMS), our preferred monetary aggregate, a
substantial boost. In fact, it has pushed the year-over-year (YOY) TMS
growth rate from 3.75% to 7.0%, thus signaling a new major upward
trend. The situation is depicted below.
Money Velocity
..."money velocity" is a redundant concept at best and a misleading one at worst.
Many analysts will undoubtedly claim that the increasing rate of
money-supply growth isn't important because the velocity of money will
remain low, but such claims reveal a misunderstanding. There is no
magical quantity called "velocity" that operates independently of money
supply and demand, causing prices to rise during some periods and to
fall during others. Like changes in the purchasing power of money, the
thing commonly called "money velocity" is simply an effect of
inflation.
By way of further explanation, during the early part of a major upward
trend in money-supply growth it will typically be the case that
inflation is not widely perceived as a problem. Actually, it's quite
likely that deflation will be seen as the bigger threat. This is the
situation that we often refer to as a "deflation scare" -- rising
money-supply growth (inflation) combined with rising fear of deflation,
with the fear of deflation being fanned by falling commodity and equity
prices.
During the early part of an inflation cycle the demand for cash
balances will tend to be relatively high -- due to falling inflation
expectations -- and the average economist will perceive a low "velocity
of money". But as time goes by the effects of the increased rate of
money-supply growth will start becoming apparent and people will become
a little more conscious of the inflation threat, the result being a
decline in the demand for cash balances (people will begin to save less
cash). The average economist will interpret this as an increase in the
velocity of money and may well conclude that prices have begun to rise
in response to the increased velocity. Clearly, though, both the
increase in velocity and the rise in the general price level are just
lagged EFFECTS of the preceding money-supply growth.
The bottom line is that "money velocity" is a redundant concept at best and a misleading one at worst.
A pronounced and sustained increase in the rate of money-supply growth
ALWAYS leads to substantially higher prices somewhere in the economy,
but due to the time-lags involved it will often be difficult to see the
link between money-supply changes and price changes. For example, the
rapid rises in the prices of many everyday items over the past three
years occurred while the money supply was growing slowly. These price
rises were an effect of the rapid money-supply growth that occurred
during the first few years of the decade. Also, the quickening in the
rate of money-supply growth that has just begun and looks set to
continue over the coming year will probably be accompanied by a slowing
rate of increase in the general price level, thus setting the scene for
a "deflation scare". The reason is that the prices of everyday items
have yet to react to the slower money-supply growth of 2005-2007.
Low-profile component of TARP paves the way for the Fed to create more money
In the 24th September Interim Update we mentioned that the Fed had
requested the approval of Congress to pay interest on bank reserves,
and explained why such a regulatory change would give the Fed a lot
more freedom when it came to the printing of new money. The following
excerpt from an Economist.com article published on 2nd October provides a bit more information on this issue:
"...although a rate cut
remains on the table, the Fed will continue for the moment to rely on
the growing use of its balance-sheet to counter the credit crunch. It
has created many lending programmes since August 2007 to help banks
finance holdings of illiquid assets and so avoid fire sales. But its
balance-sheet is running up against constraints.
When the Fed makes loans,
it deposits the proceeds in the accounts it holds for its customers --
the banks themselves. Until now it has not paid interest on those
deposits, which means banks lend their excess reserves to other banks.
All else being equal, that would push the fed funds rate below the
Fedís target, which is why it sterilises those excess reserves
by selling some of the Treasuries in its portfolio.
So far, so conventional.
At the end of July last year, the Fed had $760 billion of unencumbered
Treasuries, or 87% of its assets. But the Fedís lending
commitments have soared: $29 billion to back the assets of Bear
Stearns, a failed investment bank; $85 billion in support of American
International Group, an insurer; eventually $300 billion in
discount-window credit auctioned to banks; and a vast $620 billion
ìswapî line which foreign central banks use to lend
dollars to their own banks. It has also pledged to swap $200 billion of
its Treasuries with investment banks. By October 1st Wrightson ICAP, a
money-market research firm, reckoned the Fed had just $158 billion of
unencumbered Treasuries left...
The Treasury has helped
the Fed out by issuing additional debt exclusively for its use. This
helps soak up the excess reserves created by the Fedís numerous
loan programmes, which has caused its balance-sheet to balloon to $1.2
trillion. But the Treasury has congressional limits on how much debt it
may issue. In search of a permanent way round the problem, the Fed has
asked Congress to let it pay interest on bank reserves. It could then
expand its balance-sheet indefinitely without driving the fed funds
rate to zero; a bank will not lend out excess reserves at 0.25% if it
can earn 1.75% at the Fed. The new bill would raise the debt ceiling
and permit the Fed to pay interest on reserves immediately."
We understand that a provision allowing the Fed to pay interest on bank
reserves was included in the Troubled Asset Relief Programme (TARP)
approved by Congress late last week. This means that the Fed can now
inject unlimited amounts of new money into the financial system without
having to worry about pushing the Fed Funds Rate below its target.
Gold and Money-Supply Growth
Gold
was one of the many winners from the last major upward trend in the
money-supply growth rate, but this time round we suspect that it will
be in a class of its own because the flaws in the monetary system are
now more obvious than they were...
We can never know for certain, in advance, which items and which
markets will be the eventual main beneficiaries of an upward trend in
money-supply growth, but we can make educated guesses. In general,
inflation will exert the most upward pressure on the prices of
items/investments that are relatively scarce and relatively
under-valued.
Value is always a matter of opinion and there are many smart people in
the world who disagree with our assessment of relative value, but from
our vantage point the broad stock market's high P/E ratio and low
dividend yield disqualify it as a likely big winner from the coming
inflation. The bond market also looks over-valued, as does the property
market. Commodities are likely winners because in most cases their
prices remain low in real terms and because the large nominal price
gains of the past several years have not yet brought about large
increases in supply, but industrial commodities such as oil and the
base metals could languish for quite a while in response to the global
growth slowdown. Gold, however, often benefits from illiquid financial
markets and economic weakness due to its historical role as money.
Furthermore, we think gold is cheap relative to most other commodities
and most other investments.
Gold was one of the many winners from the last major upward trend in
the money-supply growth rate, but this time round we suspect that it
will be in a class of its own because the flaws in the monetary system
are now more obvious than they were during the first half of this
decade. But while it's very easy for us to make the case that gold will
be a top -- perhaps even the top -- performing investment over the next
few years, it is very difficult for us to identify the timing of the
next major gold rally. The fact is that the historical relationship
between money-supply trends and gold price trends has not been
consistent enough for us to draw definitive conclusions as to WHEN the
current surge in money-supply growth is most likely to positively
impact the gold market. For example, there's a distinct possibility
that the mid-September surge in the gold price marked the start of a
major multi-year advance, particularly as it coincided with a sudden
large expansion in the Fed's balance sheet; however, it is also
possible that gold won't begin to react to the changed monetary
conditions until some time next year.
It could be 1-2 years before the new upward trend in money-supply
growth begins to have a meaningful effect on commodities in general and
3-4 years before it begins to boost the prices of everyday items, but
gold's reaction is likely to occur much sooner due to the anticipatory
gold-buying of large speculators (some large speculators will
appreciate the inevitable/eventual effects of the monetary inflation
and take positions in gold in anticipation of these effects).
The Stock
Market
Earlier this year we
regularly drew parallels between the performances of various financial
markets during 2007-2008 and their performances during 1973-1974.
However and as discussed in the 29th September Weekly Update, the
spectacular way in which the 'Bush boom' of 2003-2007 has collapsed
into a pile of financial rubble has caused the similarities between the
current decade and the 1930s to become far more pronounced, with 2008
now looking like 1938 in some important respects. We therefore thought
it would be worth comparing the US stock market's performance during
1937-1938 with its performance during 2007-2008, which is exactly what
we've done below using a chart of the Dow Jones Industrials Index to
represent the 1937-1938 market and a chart of the NYSE Composite Index
to represent the current timeframe. The charts have been positioned so
that the 1937 and 2007 peaks are aligned.
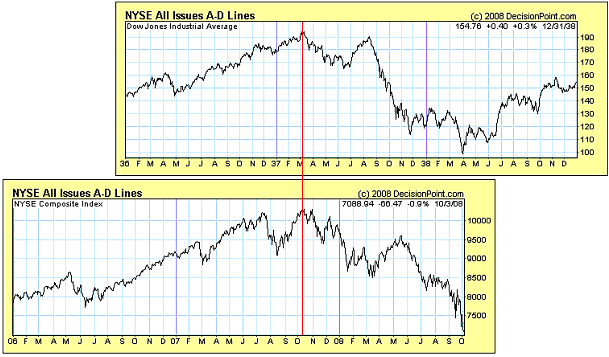
We are coming up to
the 12-month anniversary of the 2007 stock market peak. At around the
same point in 1938 (12 months after the major peak), the market
commenced a rally that would ultimately last about 7 months and retrace
about two-thirds of the preceding decline. It then traded in a wide
range for years before dropping below its 1938 low during 1942. A
similar outcome this time round would result in a rally from this
month's low through to the second quarter of next year, followed by the
return of the bear.
A similar outcome this time round is quite likely, because:
1. The OEX Volatility Index (VXO) hit 55 last week, and such extreme
VXO readings have, in the past, always been followed by multi-month
rallies.
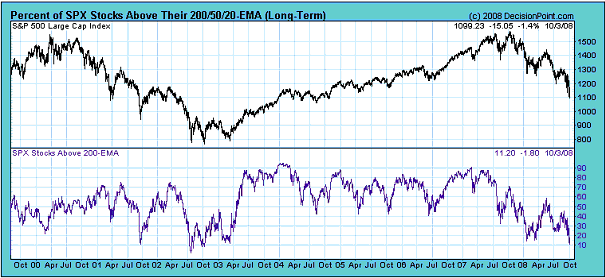
2. The percentage of stocks trading above their 200-day moving averages
has fallen to a level that has only ever occurred in the vicinity of an
intermediate-term stock market bottom. A chart showing the percentage
of S&P500 stocks above their 200-day moving averages is included
herewith.
3. The huge volume of
new money being injected into markets and the various other official
interventions are likely to provide a short-term boost.
4. The huge volume of new money being injected into markets and the
various other official interventions will reduce the economy's
LONG-TERM growth potential and prolong the bear market.
5. Stock market valuations in the US are currently nowhere near bear-market-ending levels.
A short- and intermediate-term stock market bottom is probably very
close in terms of time, but an upward reversal hasn't yet been signaled
so there remains the risk of a final downward spike.
This week's
important US economic events
| Date |
Description |
Monday Oct 06
| No important events scheduled
| | Tuesday Oct 07 | FOMC Minutes
Consumer Credit
| | Wednesday Oct 08
| Pending Home Sales
| | Thursday Oct 09
| No important events scheduled
| | Friday Oct 10
| Import and Export Prices
Trade Balance
|
Gold and
the Dollar
Currency Market Update
Trichet's Faulty Thermometer
The central banks of the world continue to provide us with excellent examples of why they shouldn't exist.
The ECB's sole mandate is to keep inflation low. Despite financial
turmoil and recession-like economic conditions, the ECB has therefore
kept its focus on inflation and has not yet yielded to political
pressure to cut its official interest rate target. This creates the
impression that the ECB is acting responsibly, especially compared to
the blatantly irresponsible Federal Reserve. However, this impression
is wrong because the ECB is not really focused on inflation; rather, it
is focused on the Consumer Price Index (CPI).
Even if it were possible to calculate the average economy-wide price
level, the result of such a calculation would, at best, be a
backward-looking indicator because purchasing-power changes generally
lag changes in the actual rate of inflation (the rate of money-supply
growth) by years. In other words, even if the CPI were a valid number
it would not be much help in guiding monetary policy. In effect, basing
monetary policy on the CPI is like driving a car forward while fixing
one's gaze on the rearview mirror.
For reasons explained in previous TSI commentaries the CPI is not,
however, a valid number. It is not even a good backward-looking
indicator because it is simply not possible to come up with a single
number that represents the average price in the economy. That is, the
supposedly prudent ECB is letting its monetary policy be dictated by
the ups and downs of a meaningless number.
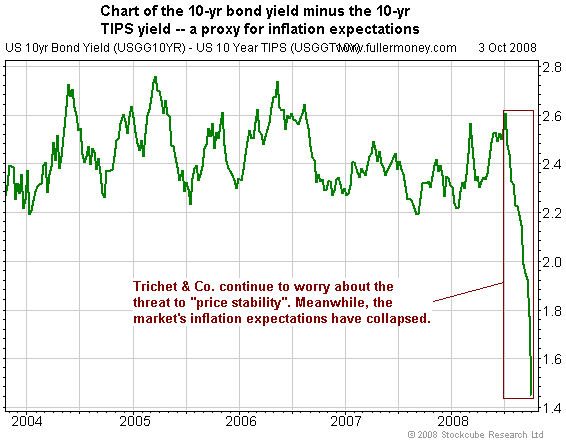
When we think about ECB chief Jean-Claude Trichet's recent assertion
that the upside risks to price stability have not yet disappeared, and,
therefore, that a rate cut is not yet the appropriate course of action,
the image that springs to mind is a man standing in his underwear in
Northern Siberia in the middle of winter holding a faulty thermometer
that tells him it's hot. His hands and feet are frostbitten and he is
about to go into cardiac arrest due to the extreme cold, but he
continues to claim that it's hot because his thermometer tells him so.
The central banks of
the world continue to provide us with excellent examples of why they
shouldn't exist. Most of the time they fix the price of short-term
credit too low, but once in a while they err by fixing it too high. The
problem is, they always err one way or the other, and, as a result,
they always distort the markets and make the economy function less
efficiently.
Current Market Situation
The currency market, like all the other markets, is presently being
dominated by de-leveraging. The de-leveraging process entails the
unwinding of long-commodity/short-US$ bets that were placed during
2006, 2007, and the first half of 2008. It also entails a flight to
safety, causing the US$ to strengthen relative to all the other
currencies and the Yen to strengthen relative to all currencies except
the US$.
A sign that the de-leveraging process and the associated flight to
safety is coming to an end, at least temporarily, will be a decline in
LIBOR (the interest rate that banks outside the US charge each other
for short-term loans). A downward reversal in LIBOR will probably mark
a short-term peak for the US$.
Gold
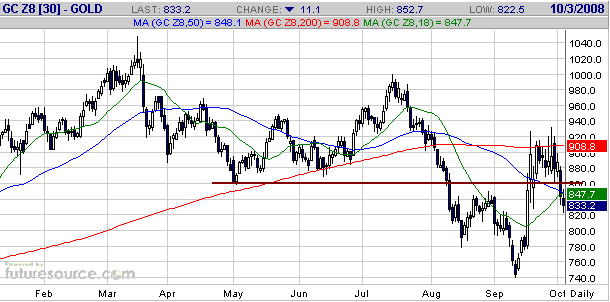
As indicated by the following daily chart, last Thursday's sharp
decline caused December gold to break below support at $860. This
former support is now resistance.
Our suggestion is that investors use additional weakness over the
coming days to add to positions in physical gold. Specifically, we
would be buyers in the low-800s and, although we don't expect the price
to get that low, in the vicinity of last month's low (around $740).
Short-term traders should have been stopped out last Thursday and at this stage should remain on the sidelines.
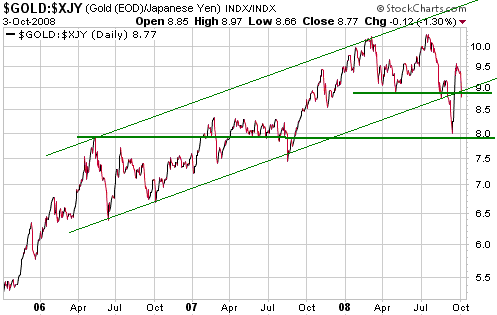
Although last week's
action put a dent in the US$ gold price chart, it didn't do any damage
to the charts of gold in terms of most other currencies. For example:
1. In euro terms, gold appears to be breaking upward from a multi-month consolidation.
2. In terms of the South African Rand it looks like gold is about to embark on its next intermediate-term advance.
3. In Australian Dollar terms gold made a new all-time high last week.
4. The Japanese Yen
is the major currency in terms of which gold looks least bullish.
However, the July-September decline stopped where it needed to stop (at
support defined by the May-2006 peak), so it is possible that the
correction in gold/yen is complete.
Gold Stocks
...the
market has downgraded stocks indiscriminately, thus creating an
opportunity to reduce overall portfolio risk without reducing upside
potential.
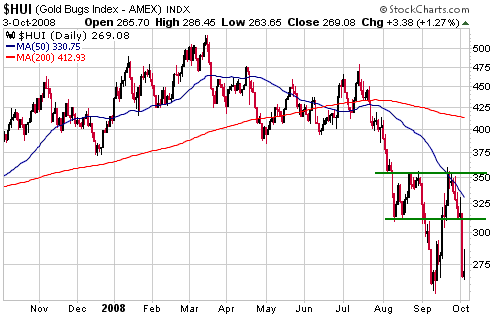
Prior to last Thursday the AMEX Gold BUGS Index (HUI) and the other
gold-stock indices were behaving in a bullish way. They had risen
sharply from their September lows to their 50-day moving averages,
which, as noted in TSI commentaries, were likely levels for pullbacks
to commence. Pullbacks did commence and at the close of trading on
Wednesday these pullbacks looked routine. However, Thursday's decline
was certainly not routine.
Within the space of just one day (last Thursday) the HUI gave back
almost all the gains it had made over the preceding weeks, effectively
taking us back to "square one". It was one of the most extraordinary
days in an extraordinary year, and, for us, the most disappointing.
Based on the emails we received it is clear that it was also the most
disheartening day for many of our readers.
It is possible that last Thursday will prove to be the final 'give up'
for the gold sector -- the day on which many long-term holders of gold
shares finally decided that they couldn't hold any longer. However,
there is no evidence, yet, that Thursday's action represented a
successful test of the September bottom. Furthermore and as mentioned
in Friday's email alert, a short-lived spike below the September low
would create the most bullish setup because it would create a low
within the reliable October-November turning-point window.
We won't suggest any additional short-term trading positions until the
HUI closes above last Friday's high (287) or some other evidence
emerges of an upward reversal.
If you have
substantial exposure to gold shares in general and junior gold shares
in particular then you will have suffered a large portfolio draw-down
over the past few months, but if you have invested in real companies --
well-managed companies with good quality assets -- then you don't have
anything to worry about unless you are in the position of having too
much debt and insufficient cash. If your personal balance sheet is in
reasonable shape then you should be able to ride-out this storm and
will eventually profit greatly from the coming major upward
re-valuation of gold in the ground.
Our view is that some junior gold shares bottomed last month, others
will bottom this month, and most of the rest will bottom in response to
tax-loss selling in December. This is not the time to be selling such
stocks because, in our opinion, an historic bottom is in the making,
but this is also not the time to be taking additional risk with the aim
of quickly recouping prior losses.
Due to the fact that the prices of almost all junior resource stocks
have been hammered regardless of their risk, the opportunity now exists
-- and will probably continue to exist for 3 more months -- to improve
the quality of one's portfolio by shifting out of the most risky
juniors and into those that offer more safety. An example of a
relatively safe junior gold/silver stock that has been hit just as hard
as, or even harder than, many of its riskier brethren is discussed
below. The point is that the market has downgraded stocks
indiscriminately, thus creating an opportunity to reduce overall
portfolio risk without reducing upside potential.
Update
on Stock Selections
(Note: To review the complete list of current TSI stock selections, logon at http://www.speculative-investor.com/new/market_logon.asp
and then click on "Stock Selections" in the menu. When at the Stock
Selections page, click on a stock's symbol to bring-up an archive of our comments on the stock in question)
 New Stock Selection: US Silver (TSXV: USA). Shares: 215M issued, 258M fully diluted. Recent price: C$0.17 New Stock Selection: US Silver (TSXV: USA). Shares: 215M issued, 258M fully diluted. Recent price: C$0.17
We weren't going to add any more junior gold/silver stocks to the TSI
List at this time because we are already following too many stocks of
this type and because the beaten-down juniors will probably come under
additional pressure as year-end approaches due to tax-loss selling.
However, at its current price we think it would be unreasonable of us
not to present the case for taking a position in US Silver.
In August, USA.V was producing silver at its operations in Idaho at the
rate of 2.3M ounces/year and was on track to reach an annual production
rate of 3.0M ounces by year-end. The company also has lead and zinc
by-products.
Production costs are currently high ($10.92/oz in August), but are
expected to fall sharply over the next few months due to higher silver
production and a greater contribution from the by-products (the
proceeds of lead and zinc sales are subtracted from the cost line
rather than added to the revenue line).
Importantly, especially in the current market environment, USA.V has
$11M of cash and $8M of investments on its balance sheet. The cash
should be more than enough to see the company through to the point
where it is profitable. In other words, there should be no need for
USA.V to do any more equity financings to get to the point where it is
self-funding.
We mentioned USA.V favourably in a couple of previous TSI commentaries,
but never added it to the List because its valuation wasn't attractive
enough relative to other opportunities. However, despite its low
political risk and current production USA.V has been one of the
hardest-hit juniors over the past 6 months. Consequently, it now offers
very good value in absolute terms and relative to other junior silver
stocks.
USA.V is the only silver producer we know of that is trading at around
one-times annual sales revenue (assuming 3M ounces of production and a
silver price of $12/ounce, USA's current market cap equates to about
one-times annual revenue). It is rare for such stocks to trade at less
than three-times annual sales.
The main company-specific risk is that the ramp-up to the 3M oz/yr
production rate will not go as planned, and, as a result, that
production costs will remain high.
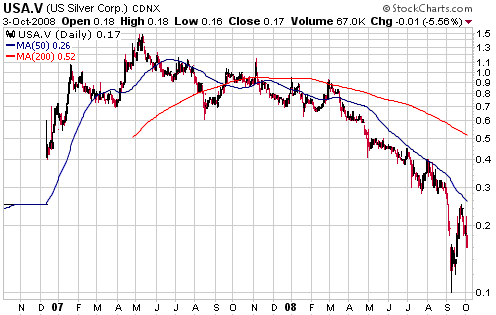
Chart Sources
Charts appearing in today's commentary
are courtesy of:
http://stockcharts.com/index.html
http://www.futuresource.com/
http://www.decisionpoint.com/
http://www.fullermoney.com/

|

