


--
Weekly Market Update for the Week Commencing
7th May 2018
Big Picture
View
Here is a summary of our big picture
view of the markets. Note that our short-term views may differ from our
big picture view.
The BULL market in US Treasury Bonds
that began in the early 1980s ended in mid-2016, but there will be many years
of topping action in bond prices and bottoming action in bond yields before
major new trends get underway. A major decline in government bond prices will
unfold during the 2020s. (Last update: 11 September 2017)
The stock market, as represented by the S&P500 Index,
commenced
a secular BEAR market during the first quarter of 2000, where "secular
bear market" is defined as a long-term downward trend in valuations
(P/E ratios, etc.), gold-denominated prices and inflation-adjusted prices. This secular trend will bottom
in 2020 or later.
(Last update: 11 September 2017)
A cyclical BEAR market in the
US
Dollar
began in 2016-2017.
(Last
update: 11 September 2017)
Gold commenced a
secular bull market relative to all fiat currencies, the CRB Index,
bonds and most stock market indices during 1999-2001.
This secular trend will peak in 2020
or later.
(Last update: 11 September 2017)
Commodities,
as represented by the CRB Index, commenced a
secular BULL market in 2001 in nominal dollar terms. The first major
upward leg in this bull market ended during the first half of 2008, but
a long-term peak won't occur until 2020 or later.
(Last
update: 11 September 2017)
Copyright
Reminder
The commentaries that appear at TSI
may not be distributed, in full or in part, without our written permission.
In particular, please note that the posting of extracts from TSI commentaries
at other web sites or providing links to TSI commentaries at other web
sites (for example, at discussion boards) without our written permission
is prohibited.
We reserve the right to immediately
terminate the subscription of any TSI subscriber who distributes the TSI
commentaries without our written permission.
True
Fundamentals Summary
[Notes:
1) The date shown next to the current True Fundamentals Model (TFM) signal is
when the most recent change occurred. 2) Charts of the Gold and Equity
TFMs are included in the "Charts and Indicators" section of the TSI web
site]
|
Market |
True Fundamentals Model (TFM) |
|
Gold (US$ Price) |
Bearish (12 Jan 2018) |
|
US Equity (SPX) |
Bearish (04 May 2018) |
|
Currency (Dollar Index) |
Bullish (27 Apr 2018) |
|
Commodities (GNX) |
Neutral (20 Apr 2018) |
Last week's posts at the TSI Blog
An update on gold's true fundamentals
Summary of current
thinking/positioning
1) The Dollar Index is close to
a multi-week top, but it is set to make additional gains prior to its
counter-trend rally coming to an end.
2) By reversing upward
following a brief drop below its $1309-$1363 trading range, the gold
market has signaled that a short-term bottom may be in place.
3)
The SPX is about to either confirm an end to its correction or escalate
the significance of the January-2018 top by breaking to a new low for the
year. The former outcome is now by far the more likely, but the
possibility of a trend-ending plunge to a new low for the year can't be
ruled out.
4) The multi-year upward trend in commodity prices that
got underway in early-2016 appears to have resumed. If so, the Australian
and Canadian dollars should be relatively strong over the next few months.
5) There is no evidence that the Swiss Franc has bottomed, but taking
a 3-6 month view this currency's risk/reward looks very attractive.
6) There remains a risk of the T-Bond breaking out to the downside in
the near future, but the bond market is probably within a few weeks a
multi-month bottom.
7) Holding a cash reserve of around 30%.
The T-Bond may be
close to a bottom
A week ago we explained why the
real yields on long-dated US government bonds may be close to their highs
for the year. There's also a good chance that nominal yields are close to
highs that will hold for 3-6 months, meaning that the prices of 10-year
and 30-year bonds are probably close to lows that will hold for at least 3
months.
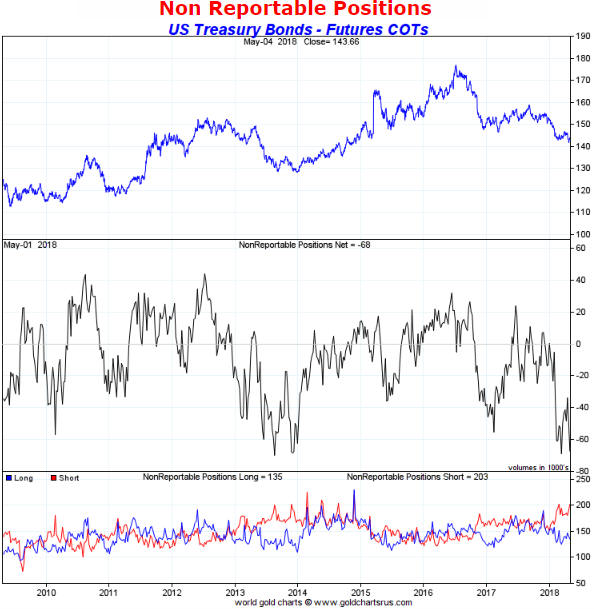
The COT situation is the main reason for thinking that the
bond market has reached or will soon reach a multi-month bottom. For
10-year T-Note futures, the COT situation has been very bullish for the
past few months, but now the COT situation for the 30-year T-Bond is also
very bullish. In particular, the total speculative net-short position in
T-Bond futures is now close to where it was when the market was bottoming
during Q1-2017, and small traders now have their largest net-short
position in T-Bond futures in more than 9 years. The net position of small
traders is indicated in the middle section of the following chart.
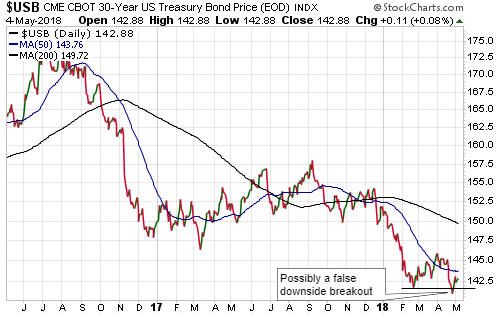
Apart from the T-Bond's inability to follow through on a downside
breakout late last month (refer to the chart displayed below for the
details), there is no evidence yet that a meaningful price low is in
place. Consequently, there's still a realistic chance of a trend-ending
plunge to new multi-year lows prior to the anticipated multi-month bottom.
However, we expect that if a 3-6 month bottom isn't already in place then
it will be put in place within the coming four weeks.
Commodities
Oil and Gas Update
Iran Sanctions Uncertainty
The Obama Presidency's lone positive contribution to the world was the
Iran nuclear deal*. As explained in the article posted
HERE: "The deal restricts certain Iranian nuclear activities for
periods between 10 to 25 years, and allows for more intrusive, permanent
monitoring. It also forbids Iran from pursuing nuclear weapons in the
future. In exchange, Iran was relieved of crippling economic sanctions."
Unfortunately, there's a high risk that on 12th May Trump will at least
partly undo Obama's single piece of good work, with significant
consequences for the oil market.
12th May is the deadline for Trump
to decide whether to re-impose oil and banking sanctions on Iran. Despite
the
evidence that Iran has complied with the Deal, Trump has stated that
he will revive the sanctions unless a better deal is negotiated. In
effect, the US government is threatening to renege on the deal.
It's possible, but unlikely, that all parties to the original deal will
arrive at a new agreement before 12th May, which is why there is a high
risk of oil and banking sanctions being re-imposed on Iran. If this risk
materialises it could crimp the global supply of oil, since Iran is a
significant oil exporter.
Anticipation of the aforementioned
oil-related sanctions is undoubtedly part of the reason for the
speculative enthusiasm for oil revealed by the COT data and the upward
bias in the oil price over the past two months. It's therefore likely that
the associated effects on oil supply have been largely discounted already,
this setting the stage for an important price top during the days around
12th May regardless of Trump's actions.
We suspect that news and
anticipation associated with Iran sanctions will lead to the oil price
making a multi-month top within the next two weeks. In particular, if it
is announced that oil sanctions will be re-imposed on Iran then the price
top likely would follow an upward spike during the hours/days immediately
after the announcement. However, we won't be inclined to enter a bearish
speculation on the oil price as long as oil's physical supply-demand
situation remains bullish.
*The deal is officially called the Joint
Comprehensive Plan of Action, or JCPOA. It was signed in 2015 by Iran, the
US, China, Russia, France, Germany and the UK.
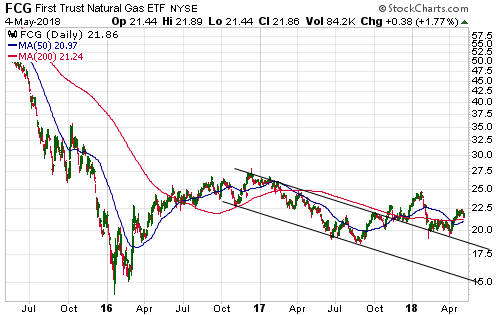
The natural gas (NG) market continues to drift
Despite the amount of NG in
below-ground storage in the US being 40% less than it was 12 months
ago and 28% less than the 5-year average for this time of the year, the US
NG price continues to drift. As illustrated by the lower half of the
following chart, this downward drift in the NG price combined with the
upward trend in the oil price has pushed the NG/oil ratio to a 3-year low.
That is, NG is very cheap relative to oil.
We continue to think that the NG market offers an attractive
risk/reward over both the short-term and the intermediate-term. As
mentioned two weeks ago, one way to get positioned for a potential rally
in this commodity is to buy the First Trust Natural Gas ETF (FCG).
Zinc Update
In February of this year the
per-pound zinc price traded in the US$1.60s -- its highest level in more
than 10 years. It has since pulled back and last week broke below support
at US$1.40 to reach its lowest level since August-2017. Is this a normal
correction or the start of a major decline?
At this time there's no way of knowing the answer to the above
question, but given the continuing bullish term structure in the LME
futures market we think it will turn out to be a normal correction of
similar magnitude to the correction that occurred during the first half of
last year. If so, the short-term downward trend has almost run its course.
The recent price decline was partly a reaction to roughly 100K tonnes
of zinc being added to LME warehouses. This sounds like a lot of metal,
but in the context of the global zinc market it isn't a big deal. The
following chart puts the recent increase in the LME zinc inventory into
perspective.
The Stock Market
Last week we were concerned
about the precarious positions of most US stock indices relative to
critical support levels and the possibility that the stock market would be
roiled by a trend-ending plunge in the bond market.
On the surface,
very little has changed. However, short-term risk has diminished, for two
reasons.
The first reason that short-term risk has diminished in
the stock market is the increased probability that long-dated US
government bonds are close to multi-month price bottoms. This was
discussed earlier in today's report.
The second reason is that the
TSI Put/Call Indicator (TPCI - the 10-day MA of the equity put/call ratio
divided by the 10-day MA of the OEX put/call ratio) generated a rare buy
signal last Thursday (only the fourth buy signal in the past 5 years).
This indicator is shown in the bottom section of the following chart. It
generates a buy signal when it moves above 0.80 and a sell signal when it
moves below 0.30.
The green arrows on the top section of the chart
mark the three other TPCI buy signals that happened within the past 5
years. In each case, the SPX was significantly higher two months after the
signal.
The US stock indices remain close to critical support levels. For
example, the first of the following daily charts shows that the Dow
Transportation Average spiked below its long-term channel bottom last
Thursday and the second chart shows that the SPX spiked below its 200-day
MA on the same day. Neither index sustained Thursday's intra-day downside
breakout, but nor did it rebound by enough to get out of danger. Also,
there could still be a trend-ending plunge in the bond market prior to a
multi-month bottom. This means that the short-term risk of a stock market
breakdown hasn't disappeared, but in our opinion it is no longer worth
betting on.
We are going to retain, for now, the QQQ put-option
position we purchased for our own account last Monday, but only because
the position is small and provides some low-priced insurance against
something unexpected.
Tesla (TSLA), again
Despite the horrendous
financial results reported by the company and the 'unhinged' behaviour of
CEO Elon Musk during a conference call with analysts* after the close of
trading last Wednesday, TSLA held short-term support at $280 and ended the
week at $294. Considering the news backdrop this was a good performance,
but the situation is little changed. Resistance lies at $310 and support
lies at $280.
*Musk cut-off analysts who tried to probe for
more detail on the company's production and capital situations, calling
the questions "too dry" and "boring". At one point he even advised against
buying TSLA shares.
Europe
Just a
quick note that the EURO STOXX 50 Index (STOX5E) appears to have bottomed
100-150 points higher than we expected. Some consolidation is likely over
the next 2-4 weeks, but a test of the 2015 high (around 3800) is likely
during the second half of this year.
This week's
significant US economic events
[Notes:
1) The most important events
(to the markets) are shown
in bold. 2) A list of global economic events can be found
HERE]
| Date |
Description |
|
Monday May-07 |
Consumer Credit |
|
Tuesday May-08 |
No important events scheduled |
|
Wednesday May-09 |
PPI |
|
Thursday May-10 |
CPI
Treasury Budget |
|
Friday May-11 |
Import and Export Prices
Consumer Sentiment |
Gold and the Dollar
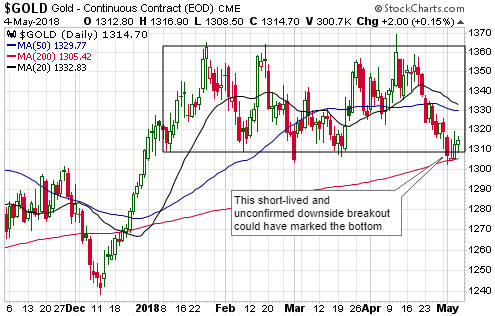
Gold
When we posted the Interim Update last week the US$ gold price had just broken
below the bottom of its $1309-$1363 multi-month trading range, thus falling into
line with the DX's preceding upside breakout. We wrote that gold's downside
breakout probably wouldn't lead to much additional weakness, but that it likely
paved the way for a drop into the $1250-$1300 range. However, we also wrote:
"This Friday's closing price will be informative, as gold must end the
week below $1309 to confirm its downside breakout. By the same token, if the
price is able to recover and end the week above $1310 then the most reasonable
assumption will be that the mid-week drop below $1309 created a short-term
bottom."
As it turned out, the price was able to recover and end the
week above $1310. Therefore, at this time the most reasonable assumption is that
last week's 2-day drop below $1309 created a short-term bottom for the gold
market.
The fundamental backdrop remains gold-bearish, but it should turn bullish during
the early part of a multi-month T-Bond rebound and a multi-month T-Bond rebound
likely will begin within the coming few weeks. Also, due to a 94K reduction over
the past 6 weeks in the total speculative net-long position in Comex gold
futures, we now view the sentiment backdrop as slightly bullish for gold.
Perhaps the biggest thing in gold's favour right now is the continuing
similarity between the metal's performance after the 8-year cycle low in
February-1985 and its performance after the December-2016 low. The similarity
was bolstered last week when the decline in the gold price stopped at the
200-day MA.
To illustrate what we are referring to, here is a chart
comparing the performance of the gold price during 1984-1987 with its
performance since June-2016. The blue line on the chart is the 200-day MA. On
this chart comparison we've matched the February-1985 cycle low with the
December-2016 low.
The note on the chart indicates that today's market
could be at the equivalent of mid-June 1986. If so, a multi-month bottom has
just been put in place and we are about 6 weeks from a break to a new 12-month
high.

Now, even if the 1985-1987 Model is valid (our view over the past year has
been that 1985-1987 is the most appropriate historical parallel to the present
gold-market situation, mainly because it is a period during which gold had an
upward bias in US$ terms for 2-3 years without being in a genuine bull market),
there is no good reason to expect that the current market will mimic every twist
and turn of this historical period. Therefore, don't bet the farm on an upside
breakout in the gold price happening exactly in line with the timing suggested
by the above chart.
Last week's gold-price low of US$1302.30 now becomes
a critical support level. A daily close below this level would suggest that the
gold market is much further from an upside breakout than implied by the
1985-1987 Model.
Last week's silver-price low of US$16.07 is equally
important. A daily close below $16.07 could precipitate a rapid decline to
around $15.00, but regardless of whether or not there is a final wash-out
decline we expect that silver will trade above $20 by year-end.
Gold Stocks
As discussed above, there is evidence that the US$
gold price made a short-term bottom last week. However, there is no evidence at
this time that the gold-mining indices have bottomed. It won't necessarily be
the same story this time around, but the gold-mining sector, as represented by
the XAU, made new lows for the year after the US$ gold price bottomed in
mid-June of 1986. In fact, in 1986 it wasn't until the gold price broke to a new
12-month high that the gold-mining sector reversed course and began to trend
upward.
That being said, the gold-mining sector has been stronger over
the past 6 months in both nominal terms and relative to gold bullion than it was
during the first half of 1986. That is, the gold-mining sector has performed
better over the past 6 months than it did during the same part of the mid-1980s
cycle. This could mean that a final plunge to a new low will be avoided during
the current cycle.
Turning to the following daily chart, the HUI broke
below its 20-day MA last Monday and then rebounded over the remainder of the
week without negating Monday's minor bearish signal. From a technical
perspective it is in 'no-man's land', having recently held up well while being
unable to generate evidence of a multi-month bottom.
Our guess is that
the HUI will test its March low prior to the start of a substantial rally, but
on both a short-term (3-month) and an intermediate-term (6-12 month) basis we
view the risk/reward as bullish. This is because although the HUI could drop by
up to 10% prior to a sustainable low, the upside potential is much greater.
The Currency Market
The
Dollar Index (DX)
Last week the DX solidified the preceding week's
upside breakout. It also broke above its 200-day MA.
At the same time,
the DX is now very 'overbought' on a short-term basis. It likely will make
significant additional gains before reaching its rebound peak, with lateral
resistance at 95 now appearing to be the most plausible target for the peak.
However, we suspect that a high that holds for a few weeks was put in place on
Friday 4th May or will be put in place this week.
From a technical perspective, the most important negative for the DX is gold's
failure to confirm the DX's strength. Whereas the DX achieved a clear-cut upside
breakout from its multi-month trading range and ended last week above its
200-day MA, the US$ gold price successfully tested its 200-day MA last week and
could not sustain the mid-week break below the bottom of its multi-month trading
range.
We view gold's reticence to confirm the DX's strength as evidence
that we are dealing with a rebound within a cyclical decline as opposed to a new
cyclical advance.
The Euro
We
mentioned a few times over the past three months that a routine correction could
take the euro down to around 1.16. A decline of that magnitude would be a test
of last year's major upside breakout.
Given the euro's bearish COT
situation (speculators were still massively net-long euro futures as at last
Tuesday), an extension of the correction to around 1.16 is the most probable
scenario. This likely would coincide with the DX rising to around 95.
The Australian Dollar (A$)
After the A$
broke below support at 0.76-0.765, the December-2017 low of 0.75 became a likely
target for a low. This support level was tested last week and initially held.
It's only with the benefit of hindsight that price tops and bottoms can be
reliably identified, so at this stage we don't know if the A$'s short-term
decline has ended. A reliable sign that it has ended will be a daily close above
the 50-day MA (the blue line on the above chart).
Based on the A$'s
performance over the past few years, once a rally begins it should last at least
two months. Also, once a rally begins it will be reasonable to remain 'long'
until the daily RSI(14) rises to 75 AND there is a daily close below the 20-day
MA (the black line on the above chart). To put it another way, it should make
sense for bullish A$ speculators to exit in response to the first daily close
below the 20-day MA that follows a rise in the daily RSI to at least 75. This
likely would result in exiting 1-2 points from a short-term top.
Updates
on Stock Selections
Notes: 1) To review the complete list of current TSI stock selections, logon at
http://www.speculative-investor.com/new/market_logon.asp
and then click on "Stock Selections" in the menu. When at the Stock
Selections page, click on a stock's symbol to bring-up an archive of
our comments on the stock in question. 2) The Small Stock Watch List is
located at http://www.speculative-investor.com/new/smallstockwatch.html
 Company
news/developments for the week ending Friday 4th May 2018:
Company
news/developments for the week ending Friday 4th May 2018:
[Note: AISC = All-In Sustaining Cost, FS = Feasibility Study, FY = Financial
Year, IRR = Internal Rate of Return, ISR = In-Situ Recovery, MD&A = Management
Discussion and Analysis, M&I = Measured and Indicated, NAV = Net Asset Value,
NPV(X%) = Net Present Value using a discount rate of X%, NSR = Net Smelter
Return, P&P = Proven and Probable, PEA = Preliminary Economic Assessment, PFS =
Pre-Feasibility Study]
*Blackham Resources (BLK.AX)
advised that metallurgical testing had indicated that "transitional" ore from
the Wiluna pit was amenable for processing through the current CIL plant. This
is a change from the Expansion PFS completed last year, which assumed that
transitional ore would be processed through the sulphide circuit.
The
effect of this change on overall project economics has not been determined, but
the effect will be positive because processing the transitional ore through the
CIL plant results in a higher recovery and a 30% lower processing cost. In other
words, this is good news.
We think that the stock market is
under-estimating the improvement in BLK's prospects. In addition to the greatly
improved production performance since late last year, over the past 6 weeks
there have been positive developments regarding this calendar year's production
from the high-grade Golden Age Underground mine, the Wiluna Tailings and the
above-mentioned change in the expected processing method for transitional ore.
And once its balance sheet becomes strong the company will be able to push ahead
with the Expansion Project, which should more than double the annual production
to circa 200K ounces.
*Golden Arrow Resources (GRG.V)
published a report showing its financial position at the end of 2017. The report
shows working capital of C$16.3M at 31st December, down by about C$3M since the
end of the preceding quarter.
GRG's financial position remains strong,
but the company will have to raise additional money within the coming few months
to fund its share of the capex for the Chinchillas silver mine in Argentina. As
previously advised, we expect the company to raise about C$10M via equity or
debt or a debt-equity combination.
The Pirquitas-Chinchillas project,
which is owned 25% by GRG and 75% by SSR Mining, is expected to have average
annual production of 6.1 million ounces of silver, 35 million pounds of lead and
12.3 million pounds of zinc. Consequently, in addition to offering exposure to
silver, GRG offers exposure to lead and zinc.
Production is forecast to
begin ramping up during the second half of this year and to achieve the design
rate next year.
*Premier Gold (PG.TO) reported
some spectacular results from holes drilled into three deposits at its South
Arturo gold mine in Nevada. Some of the best results were 42.7m of 11.20 g/t Au,
61.0m of 6.96 g/t Au, 68.6m of 15.92 g/t Au, 45.7m of 21.68 g/t Au, 36.2m of
7.95 g/t Au, 79.7m of 5.21 g/t Au and 35.7m of 16.54 g/t Au.
South Arturo
was a cash cow for PG last year and is likely to be a cash cow for the company
during 2019-2020.
*Ramelius Resources (RMS.AX)
published its quarterly report for the March-2018 quarter.
The company
had previously reported record-high gold production of 58.7K ounces. Somewhat
surprisingly, this above-plan production result coincided with an AISC that, at
A$1233/oz, was about A$50/ounce higher than expected.
Costs are projected
to be much lower in the June quarter, though. Gold production guidance for the
June-2018 quarter is for 58K-62K ounces at an AISC of about A$1090/oz.
FY2018 production guidance has been improved from 195K-205K ounces to 205K-215K
ounces.
List
of candidates for new buying
From within the ranks of TSI stock
selections the best candidates for new buying at this time, listed in
alphabetical order, are:
1) AAU (last Friday's closing price: US$0.80)
2) ALK.AX (last Friday's closing price: A$0.28)
3) BLK.AX (last
Friday's closing price: A$0.069)
4) EGD.V (last Friday's closing price:
C$0.40)
5) GRG.V (last Friday's closing price: C$0.50)
The above
list is limited to five stocks. It will sometimes contain less than five, but it
will never contain more than five regardless of how many stocks are attractively
priced for new buying.
Addition
to the TSI Stocks List: Aura Minerals (TSX: ORA). Shares: 43M. Recent price:
C$2.15
We wrote in previous commentaries (most recently in the
2nd April Weekly Update) that ORA.TO would be added to the TSI List as a
long-term position if the stock traded at C$2.05. It traded at this price on
both Thursday and Friday of last week and therefore has been added.
ORA
is a profitable gold miner with a healthy balance sheet that is currently
producing gold at the rate of around 140K ounces/year from mines in Honduras and
Brazil. It is 55% owned by Northwestern Enterprises, a private company.
About 60% of ORA's current production comes from the San Andreas project in
Honduras. San Andreas is an open-pit, heap-leach operation with annual gold
production of around 80K ounces. The project has an M&I resource of 1.7M ounces
grading 0.5-g/t.
The rest of the current production comes from the
Ernesto Pau-a-Pique (EPP) gold project in Brazil. This operation has a
relatively small total resource of around 400K ounces and comprises an open-pit
plus two underground mines.
Of ORA's non-producing assets, the most
valuable at this time appears to be the fully permitted, construction-ready
Almas gold project in Brazil. It is estimated that for a capital expense of
US$93M, Almas could be developed into a 52K-oz/year gold mine with an after-tax
IRR and NPV of 34% and US$147M, respectively, at a gold price of $1250/oz.
ORA also owns two mines that are presently on care-and-maintenance and will
potentially be brought back into production in the future: The Aranzazu copper
mine in Mexico and the Sau Francisco gold mine in Brazil. Aranzazu is the more
interesting of these, especially with the copper price above US$3/pound. In
March of this year ORA arranged a US$20M loan facility and an off-take agreement
with Louis Dreyfus Company Metals for the restart of operations at Aranzazu.
We roughly estimate the value of an ORA share to be C$6.90, which is more
than three times the current share price. This assumes that a) the 140K
ounces/year of current production is worth US$1000/oz (much lower than average),
b) the Almas project is worth 50% of the NPV estimated in the Feasibility Study
completed in 2016, c) the company has net working capital of US$30M, and d)
ORA's other assets are worthless.
In other words, we think that ORA has
more than 200% of valuation-related upside potential. That's why it is now part
of the TSI Stocks List.
If ORA interests you and you haven't yet taken a
position, be careful when buying. Despite being a 140K-oz/year producer with
mineral assets spread across three countries and US$30M of working capital, the
stock is not as liquid as we'd like and can be difficult to trade. We expect
that liquidity will improve as speculative enthusiasm returns to the gold sector
over the next 12 months.
Deletions
from the TSI Stocks List
Several months ago we imposed a
quantity limit of 15 on long-term positions in the TSI Stocks List. Our goal was
to eliminate enough stocks to reach this limit by the end of February, which we
didn't quite manage. The addition of ORA has taken the quantity of long-term
positions to 17, so we now have to remove two stocks to get down to our new
limit. There is no problem with either of the stocks we are removing. We expect
them to do well over the coming 12 months and will be retaining exposure in our
own account for now, but something has to go if we are to achieve our goal.
The first deletion is Ramelius Resources (RMS.AX), a 200K-oz/year gold
producer based in Western Australia. We estimate that RMS is worth about
A$0.80/share (about 40% above the current price) and plan exit our own position
in the stock if the price rises to near this level.
RMS is up by 50%
year-to-date and up by 46% since its addition to the List way back in 2012.
The second deletion is Solitario Zinc (XPL), an exploration-stage miner with
stakes in two high-grade zinc projects: the Florida Canyon project in Peru (30%
XPL, 70% Nexa Resources) and the Lik project in Alaska (50% XPL, 50% Teck). We
estimate XPL's fair value to be around US$1.00/share (about 150% above the
current price), so a good argument can be made that it is a candidate for new
buying. Our concern is that its 2018 work programs will not generate much in the
way of market-moving news, causing the stock to remain very under-valued for the
foreseeable future.
XPL is down by 31% year-to-date and down by 26% since
its 2016 inclusion in the List.
Changes
to the
TSI Small Stock Watch List (SSWL)
The SSWL is a list of
stocks that are too risky and/or illiquid to be considered for the TSI Stocks
List. We don't track these stocks closely in the TSI commentaries, but they have
favourable risk/reward ratios (in general: high risk versus much higher
potential reward) and could be of interest to speculators who are able to do
their own due diligence. Today we are making one addition to and one deletion
from the SSWL.
The deletion is Sarama Resources (SWA.V), a microcap gold
miner involved in a JV with Acacia Mining at an exploration-stage gold project
(called South Hounde) in Burkina Faso. The project has an Inferred gold resource
of 2.1M ounces.
Our view on this stock's potential hasn't changed. In
particular, we expect that Acacia eventually will make a takeover bid for SWA.
However, progress on the project has been too slow for our liking and a bid
probably won't happen until 2019 or later.
The addition is the
Australia-listed Breaker Resources (BRB.AX), an exploration-stage miner focused
on the Lake Roe gold project in Western Australia. BRB has about 145M shares on
issue (159M fully diluted) and A$7M of cash. It ended last week at an 18-month
low of A$0.24, giving it a current market cap of A$35M (US$26M) and a current
enterprise value of A$28M (US$21M).
BRB traded as high as A$0.80 last
year and traded above A$0.70 as recently as January of this year. Why, then, is
it now trading at only A$0.24?
The answer is that there were high
expectations built into the share price regarding the initial resource estimate
for the Bombora deposit at the Lake Roe project. When the initial resource
turned out to be smaller than expected, the share price collapsed. Here's the
price chart:
We've been following BRB for about a year due to the potential indicated by
numerous holes drilled into the Bombora deposit, but until recently it didn't
interest us as a speculation due to the high expectations that were built into
the share price. Now, however, expectations appear to be too low, setting up an
attractive risk/reward.
It's not like the initial resource estimate was a
disaster. After little more than a year of exploration work following a
greenfields discovery, the company has defined a total open-pit resource
comprising 624K ounces with an average grade of 1.6-g/t (a good grade for an
open-pit gold mine). It's expected that the resource will grow to at least 800K
ounces by year-end and to at least 1M ounces next year.
For more
information on the resource estimate and the project refer to the
recent Q&A with Tom Sanders, the company's executive chairman. Sanders owns
about 20% of the company, so he has a lot of skin in the game.
As further
exploration increases the resource estimate and changes perceptions, we suspect
that the stock price will rebound to at least A$0.50. In a more bullish
gold-mining market it could even return to its 2017 high. At the same time, the
initial resource should create a stock-price floor at around A$0.20. In other
words, at the current price of A$0.24-$0.25 we perceive upside potential of at
least 100% and downside risk of about 20%.
Chart Sources
Charts appearing in today's commentary
are courtesy of:
http://stockcharts.com/index.html
http://www.goldchartsrus.com/
http://www.kitco.com/
http://bigcharts.marketwatch.com/
