|
-- Weekly Market Update for the Week Commencing 7th September 2009
Big Picture
View
Here is a summary of our big picture
view of the markets. Note that our short-term views may differ from our
big picture view.
In nominal dollar terms, the BULL market in US Treasury Bonds
that began in the early 1980s will end by mid-2010. In real (gold)
terms, bonds commenced a secular BEAR market in 2001 that will continue
until 2014-2020. (Last
update: 09 February 2009)
The stock market, as represented by the S&P500 Index, commenced
a secular BEAR market during the first quarter of 2000, where "secular
bear market" is defined as a long-term downward trend in valuations
(P/E ratios, etc.) and gold-denominated prices. This secular trend will bottom sometime between 2014 and 2020. (Last update: 22 October 2007)
A secular BEAR market in the Dollar
began during the final quarter of 2000 and ended in July of 2008. This
secular bear market will be followed by a multi-year period of range
trading. (Last
update: 09 February 2009)
Gold commenced a
secular bull market relative to all fiat currencies, the CRB Index,
bonds and most stock market indices during 1999-2001. This secular trend will peak sometime between 2014 and 2020. (Last update: 22 October 2007)
Commodities,
as represented by the Continuous Commodity Index (CCI), commenced a
secular BULL market in 2001 in nominal dollar terms. The first major
upward leg in this bull market ended during the first half of 2008, but
a long-term peak won't occur until 2014-2020. In real (gold) terms,
commodities commenced a secular BEAR market in 2001 that will continue
until 2014-2020. (Last
update: 09 February 2009)
Copyright
Reminder
The commentaries that appear at TSI
may not be distributed, in full or in part, without our written permission.
In particular, please note that the posting of extracts from TSI commentaries
at other web sites or providing links to TSI commentaries at other web
sites (for example, at discussion boards) without our written permission
is prohibited.
We reserve the right to immediately
terminate the subscription of any TSI subscriber who distributes the TSI
commentaries without our written permission.
Outlook Summary
Market
|
Short-Term
(0-3 month)
|
Intermediate-Term
(3-12 month)
|
Long-Term
(1-5 Year)
|
Gold
|
Bullish
(02-Sep-09)
|
Bullish
(12-May-08)
|
Bullish
|
US$ (Dollar Index)
|
Bearish
(02-Sep-09)
| Neutral
(02-Sep-09)
|
Neutral
(19-Sep-07)
|
Bonds (US T-Bond)
|
Neutral
(02-Sep-09)
|
Bullish
(08-Jun-09)
|
Bearish
|
Stock Market (S&P500)
|
Neutral
(27-Jul-09)
|
Bearish
(11-May-09)
|
Bearish
|
Gold Stocks (HUI)
|
Neutral
(20-May-09)
|
Bullish
(17-Jun-09)
|
Bullish
|
| Oil | Neutral
(02-Sep-09)
| Bearish
(25-May-09)
| Bullish
|
Industrial Metals (GYX)
| Neutral
(02-Sep-09)
| Bearish
(25-May-09)
| Bullish
|
Notes:
1. In those cases where we have been able to identify the commentary in
which the most recent outlook change occurred we've put the date of the
commentary below the current outlook.
2. "Neutral", in the above table, means that we either don't have a
firm opinion or that we think risk and reward are roughly in balance with respect to the timeframe in question.
3. Long-term views are determined almost completely by fundamentals,
intermediate-term views by giving an approximately equal weighting to
fundmental and technical factors, and short-term views almost
completely by technicals.
This is funny, or would be if it weren't so serious
An investigation into the
Madoff affair found that "the SEC was hobbled by incompetence and the
inexperience of many staff members". The solution, according to Senator Schumer, is to give the SEC a lot more money.
Unfortunately, Schumer's solution to the SEC's bungling is typical. If
a government department doesn't achieve what it is supposed to achieve
it must be due to insufficient funding. It couldn't possibly be that
the premise upon which the department's existence is based is
completely wrong. By the same token, when government efforts to
"stimulate" the economy via increased spending lead to a weaker economy
down the track it must be because the efforts were not aggressive
enough. It couldn't possibly be that the efforts were supported by bad
economic theory and were thus always destined to fail.
Mixing up cause and effect
1. Credit Expansion
Observation: Credit tends to expand during periods of economic growth.
False conclusion(s): An expansion of credit is always a plus for the
economy. The central bank and the government should therefore do
whatever they can to keep the total supply of credit expanding.
The reality: Credit expansion can only have a positive effect on the
economy if the credit involves the lending of real savings. However,
when the central bank and the private banks lend new money into
existence, that is, when new credit is not related to the voluntary
transfer of real savings, interest rates and other prices are distorted
and the boom/bust cycle is set in motion.
2. Employment
Observation: The level of employment is high (the level of unemployment is low) during periods of strong economic growth.
False conclusion(s): An increase in employment causes the economy to
strengthen. If the government can put more people to work it can
therefore help strengthen the economy.
The reality: A high level of employment is an effect, not a cause, of
economic growth. When the government makes work for people by
increasing its spending it actually weakens the economy because the
jobs it creates in one part of the economy must be funded by the
transfer of resources from other parts of the economy. The effect is
that resources are used less efficiently than would otherwise have been
the case. A classic example is the former Soviet Union, which had
almost full employment and a miserable economy for decades.
Consequently, there are few things more worrisome than a politician who promises to take drastic action to create jobs.
3. Wages (the price of labour)
Observation: Real wages usually rise when the economy grows.
False conclusion(s): An increase in real wages is a cause of economic
growth. It should therefore be possible to moderate an economic
downturn by taking actions to boost real wages or maintain them at a
high level.
The reality: An increase in real wages is an effect, not a cause, of
economic growth. Furthermore, any attempt to maintain real wages at an
artificially elevated level will make the cost of labour prohibitively
high, leading to a weaker economy and greater unemployment. For
example, the Hoover and Roosevelt Administrations substantially
worsened the economic predicament during the 1930s through their
efforts to prevent the price of labour from falling.
4. Consumer Spending
Observation: Strong growth in the economy is invariably accompanied by increased consumer spending.
False conclusion(s): An increase in consumer spending causes the
economy to grow, so what we need, during periods of slow growth, are
policies that boost consumption.
The reality: In order for it to be beneficial, an increase in consumer
spending must be preceded by, and funded by, an increase in production.
The increase in production is the cause; the increase in consumer
spending is the knock-on effect.
Policies designed to short-circuit the growth process by boosting
consumption are attempts to get something for nothing. Such policies
can create the appearance of strength for a short while, but they
deplete the pool of real savings and thus lead to a weaker economy down
the track. The "Cash For Clunkers" program is a great example. It gave
auto manufacturers a temporary boost, but at the same time it a)
created financial difficulties for used car dealers, b) forced some
people to pay more for used cars and others to forego the purchase of a
used car, c) left the consumer participants in the program with more
debt, d) brought forward new-car purchases that would have occurred in
the future, meaning that there will now be less new cars sold in the
future, e) increased the government's debt, and f) transferred
purchasing power from other parts of the economy to the participants in
the program. The program was relatively small, but it's a virtual
certainty that the US economy will be a little weaker a year from now
than it would have been if "Cash For Clunkers" had never existed.
Commodities
Oil
Like many other markets, the oil market has reached a critical juncture. As evidenced by the following DecisionPoint.com
daily chart, the oil price tested its June peak during August and has
since pulled back to trend-line support. The test of the June peak
occurred alongside weakening momentum (refer to the Price Momentum
Oscillator at the bottom of the chart), so if this chart were all we
had to go on we would favour a breach of support and subsequent decline
to around $50. However, whether or not oil breaks down in the
short-term will be determined to a large extent by what happens to the
US$, and the probability of a downside breakout in the Dollar Index has
recently increased (weakness in the US$ helps the oil market).
If the Dollar Index breaks down then the oil price will probably hold
support and resume its advance, with $90 being the short-term target
projected by a break above $75.
The bottom line is that we think oil has about $20 of short-term
downside risk and upside potential, meaning that we view the short-term
risk/reward as "neutral".

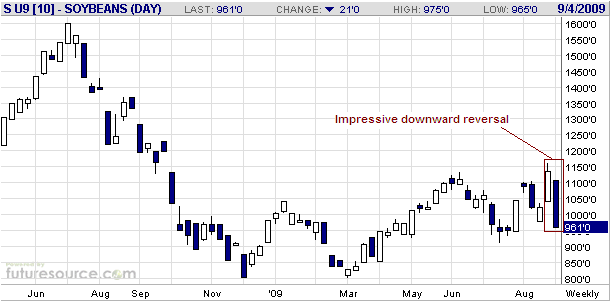
The following weekly chart shows that soybean futures made a new high
for the year during the week before last and then plunged last week.
This reversal, which was prompted by additional evidence of a bumper
crop, suggests that soybeans will soon join corn and wheat at
multi-year price lows.
Additional price weakness over the coming month or so would create an
excellent opportunity to re-establish long positions in the grains. The
weather won't always be as cooperative as it has been over the past
several months, and agricultural commodities are becoming
extraordinarily cheap relative to most other commodities.
The Stock
Market
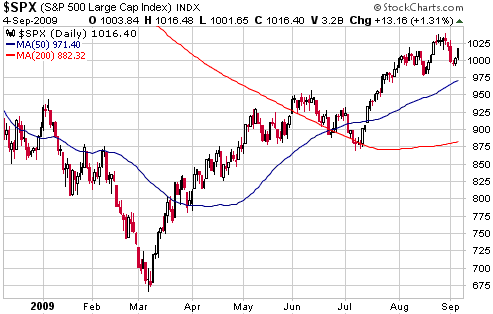
We are now into the middle of
the time-window when an average post-crash rebound would peak. The
window extends into October. Despite all the excitement it has
generated, the current rebound is still less than average in terms of
magnitude.
There have been some bearish divergences in the recent market action,
such as the declining number of individual stocks making new highs
during August while the senior stock indices pushed to new highs for
the year. Also of concern is the continuing slide in the Baltic Dry
Index. However, we don't see any big red flags at this time.
Our view continues to be that risk is high, but the potential for a
further rise to the 50% retracement level (1120 for the SPX) remains in
place.
With regard to risk,
it is worth noting that the rate of unemployment in the US economy
today is materially higher than it was in 1930. In fact, a number of
measures of the economy's health are worse today than they were during
the first year of the Great Depression. Keep this in mind when you read
comments to the effect that there is no chance of things getting as bad
this time around as they were back then.
This week's
important US economic events
| Date |
Description |
Monday Sep 07
| US markets closed for Labor Day
| Tuesday Sep 08
| Consumer Credit
| | Wednesday Sep 09
| Fed's Beige Book
| | Thursday Sep 10
| Trade Balance
| | Friday Sep 11
| Import and Export Prices
Consumer Sentiment
Treasury Budget
|
Gold and
the Dollar
Gold
Current Market Situation
There's a lot of talk/excitement about last week's upside breakout in
the gold price and what might have caused it, so we feel the need to
put things into perspective. First, the gold price only rose 4% last
week, and there is no good reason to spend time searching for
explanations for a price move of that size. Second, the gold price
broke above a trend-line last week, but on a longer-term basis it
hasn't yet done anything of real significance. As evidenced by the
following weekly chart, gold has been consolidating since March of 2008
and has only just risen to test the top of its 18-month trading range.
This longer-term pattern looks bullish and suggests that the next
multi-hundred-dollar move will be to the upside, but note that the
pattern will still look bullish if gold remains below $1000 for several
more months.
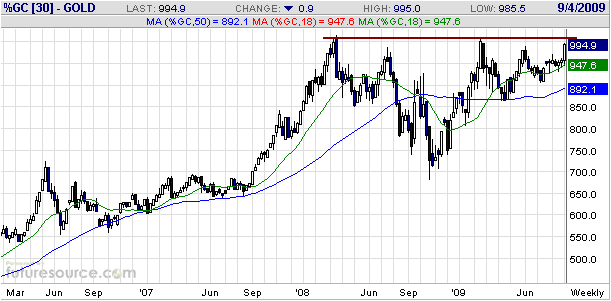
The markets were
delicately balanced at the beginning of last week, with the possibility
of a deflation scare on one side and the possibility of a 1-3 month
blow-off in inflation plays on the other. Last week's action tipped the
scales in favour of the latter, but not decisively so because gold is
still below resistance at $1000 and the Dollar Index is still above
support at 77.5.
If the Dollar Index breaks out to the downside then the gold price will
almost certainly break out to the upside, and vice versa. Note, though,
that on a longer-term basis the performance of the Dollar Index will
probably NOT be the primary determinant of gold's performance, because
the biggest up-moves in gold are driven by declining confidence in the
entire monetary system as opposed to US$ weakness relative to other
fiat currencies.
When managing money there is no need to 'go out on a limb' and make an
all-or-nothing bet with your portfolio. This is always true, but never
more so than now. For example, our own accounts are positioned for
additional gains in the gold price (and have been, to varying extents,
for about 10 years), but we are also partially hedged, via put options
and US$ cash, against the possibility of either a short-term deflation
scare or sharp pullback in the main inflation plays.
The Commitments of Traders (COT) Report
We don't think the COT report should be used as anything other than a
sentiment indicator, and like all sentiment indicators it provides the
most significant information when it diverges from the price action.
For example, prior to last week we were concerned that the speculative
net-long position in COMEX gold futures had remained high -- indicating
a high level of optimism on the part of gold speculators -- even though
the price action had been indifferent. But as we said in the 31st
August Weekly Update: "...the
uncommonly large speculative long position won't be the CAUSE of a
downside breakout and won't be an issue at all if the gold price breaks
out to the upside. If gold breaks out to the upside then the
speculative net-long position will likely become even larger as more
speculators pile on."
Gold has just taken its first step towards a major upside breakout, so the optimistic sentiment is now less of an issue.
Also with regard to the COT data, it is important to keep in mind that
in order for the speculative net-long position in gold futures to
increase, the commercial net-short position must increase by a
corresponding amount. To put it another way, an increase in speculative
long interest can only be accommodated via an offsetting increase in
commercial short interest. Therefore, if the commercial net-short
position rises sharply in response to last week's up-move in the gold
price it will not indicate something nefarious; it will, instead, be
the necessary offset of a sharp rise in the speculative net-long
position.
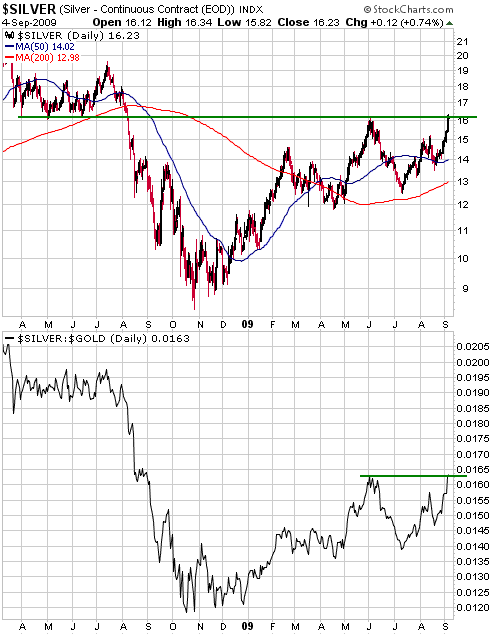
Silver
Below is a chart showing that both silver and the silver/gold ratio
declined between early June and early July and have since rebounded
back to their early-June highs. The rebound in the silver/gold ratio
over the past two months is linked to strength in the broad stock
market, in that silver tends to outperform gold when economic/financial
confidence is rising.
Although the inflation trade got the upper hand last week, the chart
underlines the point that the markets haven't yet tipped decisively one
way or the other. If the broad stock market continues to trend upward
over the weeks ahead then the silver/gold ratio will probably rise to
new highs for the year, but there will be a lot of downside potential
in silver, in US$ terms and relative to gold, after the stock market's
post-crash rebound runs its course.
Gold Stocks
In the email alert sent to subscribers following Thursday's interesting market action, we wrote:
"The HUI ended Thursday's
session at its 1st June peak. Also, Royal Gold (RGLD), a stock that we
regularly use as both a proxy and a leading indicator for the overall
gold sector, ended Thursday at intermediate-term resistance. Lastly,
silver bullion is at intermediate-term resistance (US$16) and gold
bullion is nearing major resistance at $1000.
Some sort of peak is
probably now in place in the gold sector or will be put in place via an
intra-day spike on Friday. However, given that the HUI traded above its
1st June high during Thursday's session and that the XAU has just
closed above its 1st June high, the odds favour additional gains over
the coming month or two following a near-term pullback. In other words,
our "Scenario #2", which involves the gold sector trending upward to an
intermediate-term peak during October-November, is now the front
runner. Note, however, that although the HUI probably hasn't yet topped
for the year, money management discipline dictates that investors with
substantial exposure to the gold sector now take some money off the
table."
The HUI gained a few more points on Friday, so it has now joined the
XAU in closing above the 1st June peak. This is potentially significant
because it means that the 1st June peak was not the intermediate-term
variety, and because over the past 10 years the gold sector has never
reached an intermediate-term top during September. Rather, previous
September peaks of importance -- specifically, the peaks that occurred
during September of 2001, 2002 and 2006 -- were lower than the peaks
reached earlier in the year. Also, whenever the HUI has made a new
4-month high during September -- as was the case in 2003, 2004, 2005
and 2007 -- its upward trend has always extended into November, and,
with one exception, has always ended in November. The exception was
2005, when the upward trend extended into May of the following year.
There are no guarantees, but an implication of the above is that the
intermediate-term upward trend that began last October will continue
until November of this year. It's unlikely to continue any longer than
that because by November the current advance would match the longest
intermediate-term advance of the past 10 years.
The most probable outcome, therefore, is that the gold sector will
achieve additional gains before it reaches its next intermediate-term
peak. We don't think the HUI has a realistic chance of exceeding its
2008 high (520) this year, but 450 looks achievable.
On a more immediate basis, thanks to the incredible speed of last
week's up-move the HUI looks stretched to the upside. In particular, at
the end of last week it was an unusually large distance above its
50-day moving average. This means that the risk is quite high on a 1-2
week basis and will become dangerously high if the HUI makes additional
gains during the first half of this week. Therefore, as we noted in the
above-mentioned email it would be appropriate for investors with large
exposure to gold/silver stocks to scale back a little.
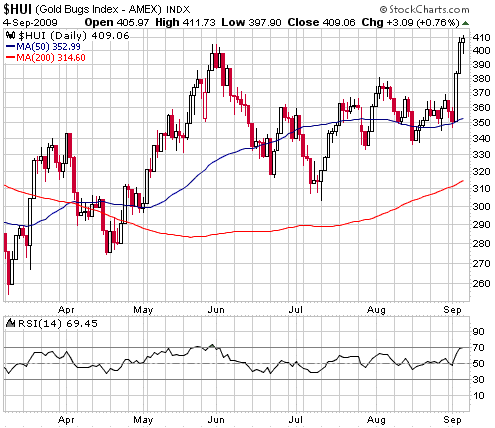
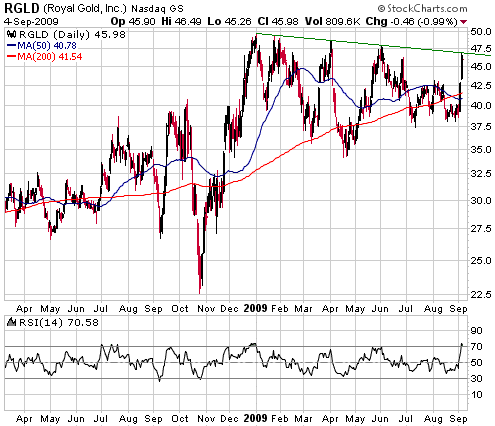
The following two charts illustrate the current situation. With
reference to the first chart (a daily chart of the HUI), notice that
the huge single-day gains on Wednesday and Thursday of last week,
combined with Friday's small rise, have taken the HUI from its 50-day
moving average to 16% above this moving average within the space of
only three days. With reference to the second chart (a daily chart of
RGLD), notice the well-defined sequence of declining tops dating back
to the first trading day of this year and that last week's advance
ended right at resistance. A daily close above US$48 would constitute a
breakout.
None of the TSI
gold/silver stocks look like 'sells' at this time, so the decision as
to which stocks to scale back on would have to be based primarily on
personal money-management considerations such as the amount of money
currently at risk in each position. For example, a sharp price rise
will sometimes cause our investment in a particular junior mining stock
to become excessively large, prompting us to do some selling even
though we remain very optimistic about the stock's prospects.
With regard to stock-specific buy/sell information, the best we can do
at this time is provide a list of TSI stocks that we would not buy
unless they first experienced corrections of at least 10%, and a list
of TSI stocks from which we would not make even a partial exit unless
they achieved substantial additional near-term gains (except, of
course, if selling was needed to get the position size down to a more
prudent level). The lists are presented below. Note that if a TSI
gold/silver stock does not appear in either list it means that at its
current price we don't have a strong opinion one way or the other.
1. Wait for significant (10%+) pullback before contemplating new buying:
Keegan Resources (TSX and AMEX: KGN)
Minefinders Corp. (AMEX: MFN)
New Gold (AMEX: NGD)
Nevsun Resources (TSX and AMEX: NSU)
2. Don't sell, unless position size requires it:
Andina Minerals (TSXV: ADM)
Chesapeake Gold (TSXV: CKG)
Fortuna Silver (TSXV: FVI)
Franco Nevada warrants (TSX: FNV.WT)
Gold-Ore Resources (TSXV: GOZ)
Lion Selection (ASX: LST)
Northgate Minerals (AMEX: NXG)
Orvana Minerals (TSX: ORV)
Resolute Mining (ASX: RSG)
Sabina Silver (TSXV: SBB)
Currency Market Update
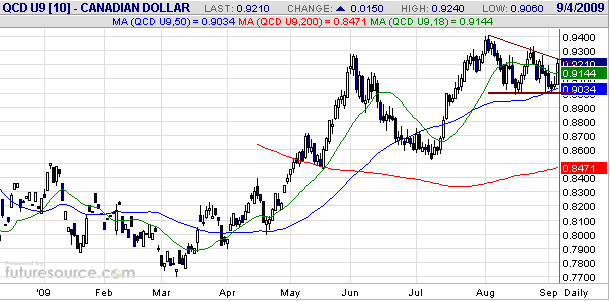
The Canadian Dollar was strong on Friday, but the following daily chart
of the September C$ futures contract shows that it didn't quite rise by
enough to break out of its short-term consolidation pattern.
The C$ is another market that is poised to break sharply in one
direction or the other over the next several weeks. A daily close above
0.93 would suggest that it was on its way to 0.98-1.00, whereas a daily
close below 0.90 would suggest that a drop to around 0.85 was on the
cards.
Update
on Stock Selections
(Note: To review the complete list of current TSI stock selections, logon at http://www.speculative-investor.com/new/market_logon.asp
and then click on "Stock Selections" in the menu. When at the Stock
Selections page, click on a stock's symbol to bring-up an archive of our comments on the stock in question)
 Updates on our two Australian gold stock selections: Updates on our two Australian gold stock selections:
1. Lion Selection (ASX: LST). Shares: 82M. Recent price: A$1.61
LST has performed very well over the past three months, but despite the
recent sizeable price increase the stock is still very under-valued and
is not, in our opinion, at risk of experiencing anything more than a
routine pullback.
The merger between LST and Catalpa Resources (ASX: CAH) will be
finalised within the next two months, and when that happens LST
shareholders will receive CAH shares with a current market value of
A$1.54 plus shares in a new company with a net asset backing of at
least A$0.60/share plus A$0.10 of cash. That is, they will receive
assets with a current value of about A$2.24, which is 37% above
Friday's closing stock price.
2. Resolute Mining (ASX:
RSG). Shares: 456M issued (incl. 103.4M A$0.50 convertible notes), 540M
fully diluted. Recent price: A$0.66
RSG's senior managers have frustrated the heck out of us with their
poorly timed and poorly managed financings. They have destroyed a huge
amount of shareholder value through abysmal financial management even
while they work diligently to add value at the mine operating level.
Despite everything that has happened, including the financing announced
last week, at the current stock price the risk/reward still looks
attractive. If the final ramp-up of the Mali-based Syama gold project
goes roughly according to the latest schedule then RSG's stock price
will have the potential to rise to at least A$1.50 over the coming
year. However, due to various uncertainties we would be inclined to
make a partial exit from this stock if its price rose to around A$1.00
within the next two months.
Chart Sources
Charts appearing in today's commentary
are courtesy of:
http://stockcharts.com/index.html
http://www.futuresource.com/
http://www.decisionpoint.com/

|