![]()
![]()
![]()
![]()
-- Weekly Market Update for the Week Commencing 7th November 2016
Big Picture
View
Here is a summary of our big picture
view of the markets. Note that our short-term views may differ from our
big picture view.
The BULL market in US Treasury Bonds that began in the early 1980s ended in early-2015, but there will be many years of topping action in bond prices and bottoming action in bond yields before major new trends get underway. (Last update: 29 June 2015)
The stock market, as represented by the S&P500 Index, commenced a secular BEAR market during the first quarter of 2000, where "secular bear market" is defined as a long-term downward trend in valuations (P/E ratios, etc.) and gold-denominated prices. This secular trend will bottom sometime between 2018 and 2020. (Last update: 29 June 2015)
A secular BEAR market in the US Dollar began during the final quarter of 2000 and ended in July of 2008. This secular bear market will be followed by a multi-year period of range trading. (Last update: 09 February 2009)
Gold commenced a secular bull market relative to all fiat currencies, the CRB Index, bonds and most stock market indices during 1999-2001. This secular trend will peak sometime between 2018 and 2020. (Last update: 29 June 2015)
Commodities,
as represented by the CRB Index, commenced a
secular BULL market in 2001 in nominal dollar terms. The first major
upward leg in this bull market ended during the first half of 2008, but
a long-term peak won't occur until 2018-2020.
(Last
update: 29 June 2015)
Copyright
Reminder
The commentaries that appear at TSI
may not be distributed, in full or in part, without our written permission.
In particular, please note that the posting of extracts from TSI commentaries
at other web sites or providing links to TSI commentaries at other web
sites (for example, at discussion boards) without our written permission
is prohibited.
We reserve the right to immediately
terminate the subscription of any TSI subscriber who distributes the TSI
commentaries without our written permission.
Outlook Summary
|
Market |
Short-Term (1-3 month) |
Intermediate-Term (6-18 month) |
Long-Term (2-5 Year) |
| Gold | N/A |
Bullish (10-Oct-16) |
Bullish |
| US$ (Dollar Index) | N/A |
Neutral (17-Aug-16) |
Neutral (19-Sep-07) |
| US Treasury Bonds (TLT) | N/A |
Bearish (19-Oct-15) |
Bearish |
| Stock Market (DJW) | N/A |
Bearish (19-Sep-16) |
Bearish |
| Gold Stocks (HUI) | N/A |
Bullish (10-Oct-16) |
Bullish |
| Oil | N/A |
Neutral (26-Oct-15) |
Bullish |
| Industrial Metals (GYX) | N/A |
Neutral (10-Oct-16) | Bullish |
4. Long-term views are determined almost completely by fundamentals and intermediate-term views
are determined by a combination of fundamentals, sentiment and technicals.
Last week's posts at the TSI Blog
Interesting aspects of the current financial situation
How should the real interest rate be measured?
Summary of current
thinking/positioning
1) Thinking that short-term
bottoms are in place for gold and the associated mining indices, but
expecting that the overall corrections will extend into Q1-2017 and that
multi-week rebounds from the October-2016 lows will be followed by tests
of the lows.
2) Expecting that 2017-2018 will be a very bullish
period for commodities, but acknowledging that the early-2016 lows could
be tested prior to the start of the aforementioned bullish period.
Gradually building up long-term exposure to non-gold commodities and
simultaneously hedging against short-term weakness via EEM (emerging
market) and USO (oil) put options. Will probably take profits on hedges
this week.
3) Thinking that the US stock market has additional
downside in store and positioned for such an outcome via QID call options,
but expecting a 1-2 week rebound to begin this week (perhaps following a
downward spike).
4) Thinking that the currency market is close to a
critical decision point. It could go either way, with the Dollar Index
breaking below support and signaling an intermediate-term top or holding
above support and resuming its intermediate-term advance.
5)
Maintaining a large cash reserve in recognition of the downside risk in
almost all equities (current cash percentage is around 45%), but looking
for opportunities to reduce cash and add to gold plus commodity exposure.
Commodities
Supply-demand versus
price
Commodity supply-demand fundamentals must always be
considered in relation to the market price. The reason is that it makes no
sense to be bullish or bearish based on an assessment of the fundamentals
if the fundamentals have been fully discounted by the current market
price. And how can we tell if the fundamentals have been fully discounted
by the current price? We can't tell for certain, but if the price is at a
relative extreme and it seems that 'everyone' is aware of the bullish or
bearish supply-demand story then it's a good bet that the market has
already discounted the story.
A good example is provided by the oil
market during January-February of this year. We wrote at the time that
although the supply-demand fundamentals were bearish and showed no sign of
improving, the oil price was probably close to an intermediate-term
bottom. Our reasons were that the oil price was trading near a
multi-decade low in inflation-adjusted terms and that the mainstream press
was inundated with articles harping on oil's bearish supply-demand
situation. This meant that something close to a worst-case scenario for
the oil market was baked into the current price, which, in turn, meant
that the risk/reward was bullish.
Copper could be near a
short-term price top
In the 24th October Weekly Update we
wrote that the copper price had fallen to support (near US$2.09) and that
a 1-2 week rebound would be a normal occurrence even if lower prices were
likely prior to a sustained upturn. A rebound has happened.
The
rebound has been a little stronger than anticipated and has enabled the
copper price to break above the top of the triangular pattern that limited
its movements over the past 10 months. This could be warning that a
substantial rally is has begun, but over the years we have seen countless
breaks above resistance that were not followed by significant additional
gains. Furthermore, there is important lateral resistance only a few cents
above the current price and the Commitments of Traders (COT) situation is
warning of a short-term price top.
The COT warning won't matter if a bull market has begun, because
bear-market sentiment benchmarks don't work during bull markets. However,
it will be prudent to heed such warnings until the bull-market scenario is
confirmed.
Platinum is rebounding
In the
24th October Weekly Update we wrote that platinum is the precious metal
with the best intermediate-term risk/reward, that the platinum price was
near multi-decade lows in real (inflation-adjusted) terms and relative to
gold, and that we had begun to purchase physical platinum for our own
accounts. The platinum price was US$932/oz at the time.
Having
included a long-term chart in the 24th October report to show platinum's
extreme cheapness in gold terms, today we are including a long-term chart
showing platinum's extreme cheapness in inflation-adjusted (IA) terms. The
following chart shows that the IA platinum price* is near its lowest level
since the late-1970s.
We also wrote in the 24th October report that the January-2016 low
near $825 could be tested -- most likely early next year following a
multi-week rebound -- prior to the start of a major rally.
The
platinum price has since rebounded to the low-$1000s, where it is
encountering resistance in the form of the 50-day and 200-day MAs. The
rebound is probably not over, although a pullback to as low as $960 would
be normal.
The upshot is that nothing has changed since our last platinum update.
Platinum is very cheap and, as anticipated, is rebounding from an
'oversold' extreme, but the rebound doesn't eliminate the possibility of
the January-2016 low being tested prior to the start of a major rally.
*We have our own method of 'inflation-adjusting'
that was first
explained back in 2010.
The oil price is experiencing a
predictable decline
Not surprisingly, the divergence
between the oil price and the currency market (the C$, mainly) is in the
process of being eliminated via a decline in the oil price.
The oil
market's decline is probably not close to being complete, but with the
price having just fallen for 6 days in a row and on 10 of the past 12
trading days to near support defined by the 200-day MA it's a good bet
that a 'pause for breath' will soon occur. Our guess is that the oil price
will make a multi-week bottom this week and then rebound/consolidate for
2-3 weeks before resuming its downward trend.

The uranium price has collapsed
Our most
recent comments on uranium were in the 21st September Weekly Update. Under
the heading "Why uranium investments could stay radioactive" we mentioned
the secondary source of supply (the under-feeding by uranium processors to
generate more fuel from less ore) that had counteracted the removal of
supply resulting from the termination of the "Megatons
to Megawatts program". We went on to write:
"We are
interested in maintaining some exposure to uranium mining on the basis
that the bearish fundamentals are well known and fully reflected in the
current price, but 2-3 years ago we gave up trying to predict the timing
of the eventual/inevitable uranium price reversal. The reversal could
happen this year, but it could also still be years away."
At
that time the uranium price was around $25/pound.
As illustrated by
the following chart, the price has since plunged to the $18-$19 range.
This is a 12-year low. It is therefore fair to say that the bearish
fundamentals were not fully reflected in the current price when the price
was in the mid-$20s.
The price plunge of the past several weeks was possibly a final
capitulation, but even if this is the case the risk for the companies
involved in uranium mining is that there will be a multi-year period of
basing prior to a sustained price rally. In fact, until/unless proved
otherwise this should be considered the most likely outcome. We are
therefore not interested in adding to our uranium exposure in response to
the current price weakness, but we continue to maintain some exposure and
to watch for signs of a 'change in the tide'.
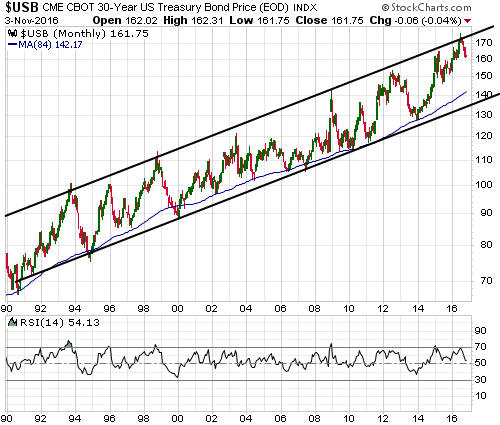
The T-Bond is
headed much lower, but not in the short-term
The T-Bond's downward reversal
from the top of its long-term price channel (refer to the following
monthly chart) points to significant additional weakness over the coming
12 months. Even if the secular bull market in government bonds is not
over, the historical record suggests that a decline to either the 84-month
MA (the blue line on the following chart) or the channel bottom lies in
store.
Rising inflation expectations will be the most likely
fundamental driver of the intermediate-term downward trend.
At the same time, there are reasons to suspect that the T-Bond will
have an upward bias over the coming 1-2 months. One is that the market
recently became short-term 'oversold' in both momentum and sentiment
terms. Of particular significance, the COT situation (a sentiment
indicator) is now the most constructive it has been since December of last
year. Another is that the T-Bond is likely to get a short-term boost from
nervousness associated with US politics (regardless of who wins the big
election) and stock-market weakness.
The Stock Market
The US
The Election Effect
The polls
point to a Clinton victory in the US Presidential election on Tuesday 8th
November, but the outcome is far from a foregone conclusion. The election
will therefore roil the financial markets in general and the US stock
market in particular over the next few days.
In a case of "better
the devil you know", a Clinton victory would almost certainly prompt a
stock-market rebound. We think that the gains would evaporate within a few
days and that the US stock indices would break below their early-November
lows before the end of the month, but for bearish speculators there is a
risk that the rebound would turn out to be more sustainable than we
expect.
A Trump victory would almost certainly prompt a sharp
stock-market decline and create an excellent opportunity to take profits
on short-term bearish speculations.
Another consideration is the
risk that the election result will be contested. Both sides in the
acrimonious battle for the Presidency have already set the scene for
claims of fraud/rigging if the vote doesn't go their way. This could cause
nervousness to extend well beyond Tuesday-Wednesday of this week even if
Clinton wins.
Current Market Situation
The S&P500 Index (SPX) finally breached support at 2120 last Tuesday.
It then followed through to the downside over the remainder of the week.
Our short-term target continues to be the "Brexit" sell-off low in the
1990s. However, we must guard against being complacent in our short-term
bearishness. Actually, it is never a good idea to be complacently bullish
or bearish, because there is never just one plausible outcome.
Over
the past couple of weeks the stock market has mostly done what it needed
to do to validate our short-term bearish expectations, but at the same
time there are some reasons to be wary. Here they are:
1) The SPX
has just declined for 9 days in a row. A daily losing streak of this
length is very unusual and has led to the market becoming sufficiently
'oversold' to enable a sizable bounce. The extent to which the SPX is
short-term 'oversold' is evidenced by the fact that apart from during the
drama of August-2015, at no time over the past four years has the SPX's
daily RSI(14) been lower than it is right now.
2) On Friday the SPX
reached its 200-day MA at 2083. Short-term declines often bottom at or
just below this MA.
3) The SPX has weakened significantly, but the
Dow Transportation Average (TRAN) has been holding up extremely well. In
fact, while the SPX was validating our short-term bearish outlook by
breaking below support, TRAN was consolidating in bullish fashion just
below resistance. This is potentially important because TRAN has been the
leading stock index to both the downside and the upside over the past 2
years.
The stock indices are likely to trade in a wide range over the next
few days as traders first anticipate and then react to the outcome of the
Presidential election. Significant weakness should be viewed as an
opportunity to take profits on bearish positions.
Hong Kong
Hong Kong's stock market rates a mention in today's report due to a
development that occurred after the close of trading last Friday. We are
referring to the
Hong Kong government's decision, effective immediately, to increase
the stamp duty on all residential property purchases to 15%. The stamp
duty applicable to property purchases had previously been a sliding scale
of 1.5% to 8.5%.
This measure is being taken in an effort to 'cool'
the world's hottest real estate market. It is another in a very long line
of examples of one problem caused by government or central-bank
intervention providing the justification for additional intervention. In
this case, the root of the problem is the HK government's determination to
maintain the nonsensical HK$ peg to the US$, which requires the importing
of destructive US monetary policy.
The news could cause a big
sell-off in Hong Kong's Hang Seng Index (HSI) on Monday. Important support
lies at 21500, or about 5% below Friday's closing price.
This week's
significant US economic events
[Notes:
1) The most important events
(to the markets) are shown
in bold. 2) A list of global economic events can be found
HERE]
| Date | Description |
| Monday November 07 | Consumer Credit |
| Tuesday November 08 | US Presidential Election |
| Wednesday November 09 | No important events scheduled |
| Thursday November 10 | Treasury Budget |
| Friday November 11 | Consumer Sentiment |
Gold and the Dollar