![]()
![]()
![]()
![]()
-- Weekly Market Update for the Week Commencing 8th January 2018
Big Picture
View
Here is a summary of our big picture
view of the markets. Note that our short-term views may differ from our
big picture view.
The BULL market in US Treasury Bonds that began in the early 1980s ended in mid-2016, but there will be many years of topping action in bond prices and bottoming action in bond yields before major new trends get underway. A major decline in government bond prices will unfold during the 2020s. (Last update: 11 September 2017)
The stock market, as represented by the S&P500 Index, commenced a secular BEAR market during the first quarter of 2000, where "secular bear market" is defined as a long-term downward trend in valuations (P/E ratios, etc.), gold-denominated prices and inflation-adjusted prices. This secular trend will bottom in 2020 or later. (Last update: 11 September 2017)
A cyclical BEAR market in the US Dollar began in 2016-2017. (Last update: 11 September 2017)
Gold commenced a secular bull market relative to all fiat currencies, the CRB Index, bonds and most stock market indices during 1999-2001. This secular trend will peak in 2020 or later. (Last update: 11 September 2017)
Commodities,
as represented by the CRB Index, commenced a
secular BULL market in 2001 in nominal dollar terms. The first major
upward leg in this bull market ended during the first half of 2008, but
a long-term peak won't occur until 2020 or later.
(Last
update: 11 September 2017)
Copyright
Reminder
The commentaries that appear at TSI
may not be distributed, in full or in part, without our written permission.
In particular, please note that the posting of extracts from TSI commentaries
at other web sites or providing links to TSI commentaries at other web
sites (for example, at discussion boards) without our written permission
is prohibited.
We reserve the right to immediately
terminate the subscription of any TSI subscriber who distributes the TSI
commentaries without our written permission.
True
Fundamentals Summary
[Notes:
1) The date shown next to the current True Fundamentals Model (TFM) signal is
when the most recent change occurred. 2) Charts of the Gold and Equity
TFMs are included in the "Charts and Indicators" section of the TSI web
site]
| Market | True Fundamentals Model (TFM) |
| Gold (US$ Price) | Bullish (29 Dec 2017) |
| US Equity (SPX) | Bullish (29 Dec 2017) |
| Currency (Dollar Index) | Bullish (15 Dec 2017) |
| Commodities (GNX) | Bullish (29 Dec 2017) |
Last week's posts at the TSI Blog
You can bet on the continuing popularity of superficial economics
Summary of current
thinking/positioning
1) Expecting that gold will test
its 2016 high of US$1377 during the first half of 2018 (possibly as soon
as next month).
2) Expecting a tradable US stock-market correction
to begin soon and planning to add a bearish position in the form of QID
and/or QQQ puts to the TSI List after a downward reversal in the market.
3) Thinking that industrial commodities such as oil and copper have
made or are close to making short-term highs.
4) Thinking that the
Dollar Index (DX) has resumed its longer-term downward trend, but
expecting a multi-week DX rebound to begin soon.
5) Thinking that
the T-Bond has almost completed an intermediate-term topping pattern
within the context of a long-term topping pattern.
6) Holding a
cash reserve of about 25% and looking for opportunities to boost this
reserve to 30%-35%.
Yearly Forecast
We do not believe that annual
forecasts add value. What matters is real-time analysis of the situation
over the course of a year, not a snapshot taken at a particular time each
year. However, doing an annual forecast near the start of each year is a
financial-industry tradition that we follow, despite our misgivings.
Our 2018 forecasts will be provided in commentaries over the coming
week or so.
Random
predictions about the year ahead
1) In 2017 the US stock market's
lack of volatility was record breaking. As noted last week, this is
evidenced by the SPX's average daily change in 2017 being the smallest
since 1964, the absence during 2017 of a single trading day with an SPX
gain of more than 1.4%, and the fact that the SPX is immersed in its
longest stretch ever (14 months and counting) without a peak-to-trough
decline of more than 3%.
In the financial markets, extremes in one
direction are often followed by extremes in the opposite direction. Also,
a lot of computer-generated trading is predicated on the continuation of
the low-volatility environment. This creates the potential for an increase
in volatility to become self-reinforcing at some point, with rising
volatility leading to the automatic selling of stocks, resulting in a
further rise in volatility, and so on.
Therefore, the US stock
market is set to experience greater-than-average volatility this year.
2) When attempting to predict when a period of economic growth will
end it is futile to look more than 6 months into the future, because there
are no leading recession indicators that can predict that far ahead with
acceptable reliability. There are, however, leading indicators that can be
used to determine the probability of a recession beginning within the next
several months. The current situations of these indicators result in the
following prediction:
The US economy will not commence an official
recession during the first half of this year.
3) It is yet to be
confirmed by the price action, but it's a good bet that the Bitcoin bubble
reached its maximum level of inflation late last year. Also, the broader
bubble in cryptoassets is set to burst during the first quarter of this
year.
We doubt that there will be a specific catalyst for the
bursting of the bubble, just a spreading realisation that these digital
tokens have unlimited supply, no sustainable value and no chance of ever
garnering widespread use as media of exchange.
By the end of 2018
it will be apparent that the public's enthusiasm for Bitcoin and the
"alt-coins" was one of history's great speculative manias.
4)
Despite spectacular collapses in the prices of the popular 'cryptoassets'
during 2018, central banks including the Fed and the ECB will firm-up
plans to introduce their own blockchain-based currencies. This will be
driven by a desire to eliminate physical cash, the thinking being that if
there is no physical money it will be more difficult for the average
person to make/receive unreported payments and escape a negative interest
rate.
5) Due to rising commodity prices it's a good bet that "price
inflation" will become a higher-profile issue during the first half of
2018, prompting the Fed to move ahead with its quantitative tightening
(QT) and make two more rate hikes. However, both the QT and the
rate-hiking will be put on hold during the second half of the year in
reaction to increasing downside volatility in the stock market.
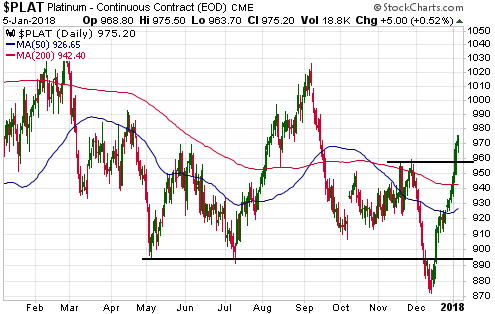
Commodities
The platinum price
confirms an intermediate-term bottom
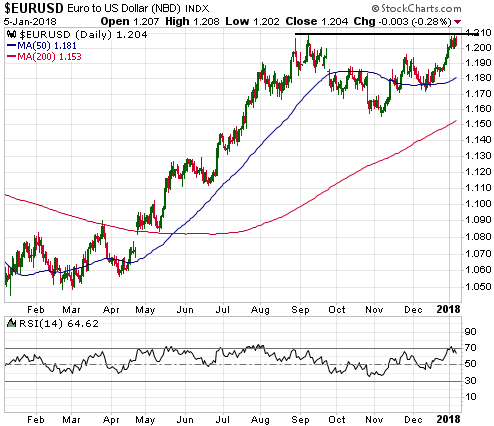
False breakouts are
more reliable than breakouts. For example, a break below an obvious and
important lateral support level that is quickly reversed is a more
reliably-bullish signal than an upside breakout.
Over the past two
months the financial markets have been replete with false downside
breakouts. The ones previously mentioned at TSI involved the euro, the US$
copper price, the HUI and the natural gas price. However, the performance
of the US$ platinum price is perhaps the most significant of all the
recent false downside breakouts.
During the first half of December
the platinum price broke below lateral support in the $890s. This opened
up the possibility that the January-2016 low near $800 would be tested
prior to an intermediate-term bottom being put in place, with January-2018
being the most likely time for such a test. However, a few days after the
downside breakout the market reversed direction.
The platinum price
has risen on 14 of the past 15 trading days and in the process has broken
above short-term resistance defined by its November-2017 high. It is now
'overbought' and likely to correct, but this strongly suggests that an
intermediate-term bottom was put in place in December.
The oil price reaches long-term resistance
A
week ago we wrote that the term structure in the oil futures market (the
only fundamental indicator that matters) was bullish. We also wrote that
the net speculative long position in oil futures was larger than it had
ever been, that the market was short-term 'overbought' and that the price
was within $2 of intermediate-term resistance defined by the 2015 peak.
A week later and not much has changed except that the price has risen
to test the aforementioned resistance.

Due to the bullish fundamental situation we still aren't tempted to
bet against oil, although there is now a high risk of a multi-month top
being put in place in January.
A copper consolidation
The US$ copper price completed an extraordinary run of 16 consecutive
up-days at the end of the week before last. It has since pulled back a
little.
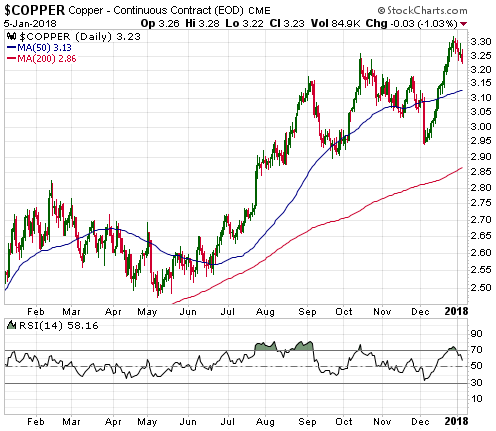
As is the case with oil, the COT numbers for copper indicate an
optimistic extreme on the part of speculators. This is illustrated by the
following weekly chart.
We are most interested in the blue bars in
the middle section of the following chart. These bars indicate the net
commercial position in copper futures, which is the mathematical inverse
of the total net speculative position in copper futures. The fact that the
commercials now have their largest-ever net-short position means that
speculators now have their largest-ever net-long position. It's the
positioning of speculators that matters, because commercial traders
generally don't bet on price direction.
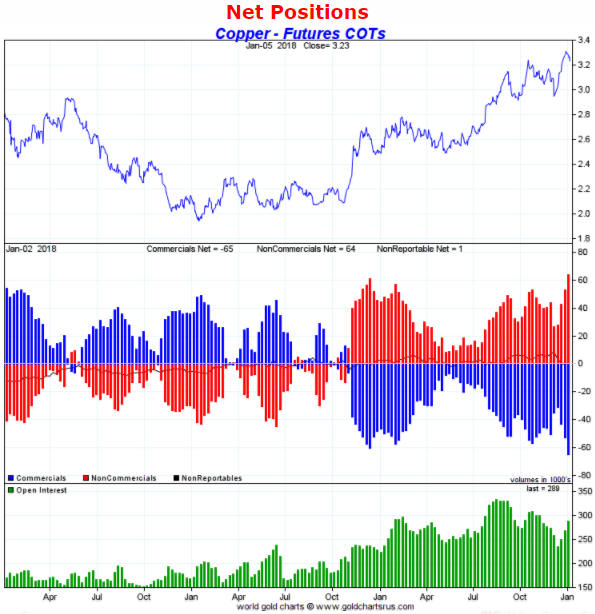
As is also the case with oil, the term structure in the copper futures
market is bullish. That is, the fundamental backdrop is supportive.
We expect that the copper price will go on to make new multi-year
highs during the first half of this year. There's even a realistic chance
of copper trading with a '4 handle' before mid-year. However, additional
short-term corrective activity is likely.
The Stock Market
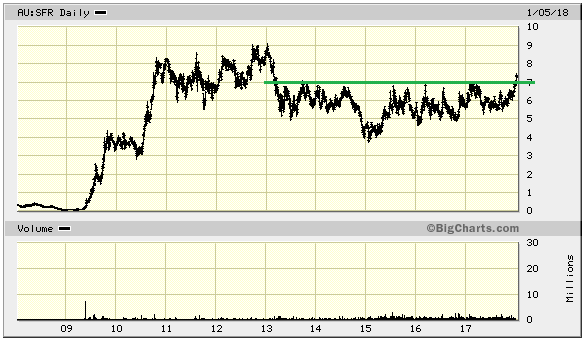
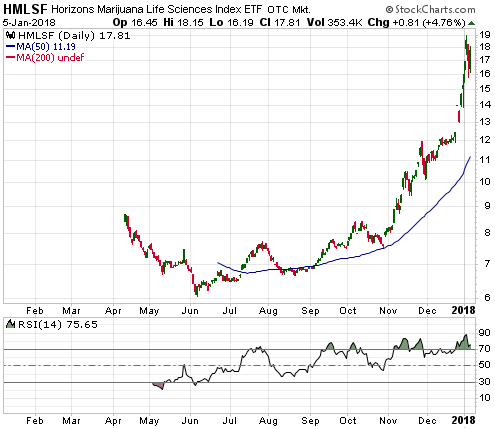
Marijuana Stocks
There were huge run-ups in the prices of most marijuana-related stocks
during the second half of last year and the first few trading days of this
year. This is illustrated by the performance of the Horizons Marijuana ETF
(HMLSF), which traded as low as US$6 last June and as high as US$19 on
Wednesday 3rd January (refer to the following chart for details). There
was then a plunge on Thursday 4th January in reaction to a decision by US
Attorney General Jeff Sessions to rescind the "Cole Memo", a set of Obama
Administration guidelines that encouraged federal prosecutors to treat
marijuana sales and consumption as a state issue. However, there is little
chance that the stupidity and maliciousness of Jeff Sessions will be able
to slow the growth of the marijuana industry. One reason is that the
industry will become an important source of revenue for state governments.
Another reason is that with the proportion of the US voting population in
favour of marijuana legalisation at 64% and rising, a federal crackdown on
the industry would constitute political suicide for the associated
politicians. So, should we be looking for opportunities to invest in this
industry via the stock market?
Perhaps, but it is yet another stock-market bubble. Marijuana
production is essentially a low-margin commodity business deserving of a
relatively low valuation, but most marijuana-related stocks now have
extremely high valuations. Therefore, buying these stocks should not be
called investing; it should be called betting on future sentiment. As long
as the industry continues to grow rapidly and market participants fixate
on this growth while ignoring the realistic earnings potential of the
companies involved, the bull market could continue.
Although the
downward price-spike prompted by Jeff Sessions' burst of idiocy was
largely retraced on Friday, there's a high risk that the marijuana sector
will soon commence a substantial correction. This is partly because the
sector has just experienced what appears to be an upside blow-off and
partly because the speculation in this sector would be interrupted by
weakness in the broad stock market.
A substantial correction may
create a new speculative buying opportunity.
Due to participation
in private placements, own account has positions in two companies involved
in medical marijuana. One of these companies is still private, but the
other one began trading in Canada on 29th December 2017. The newly-listed
company is Fincanna Capital (CSE: CALI). It is a royalty company for the
licensed medical cannabis industry and, as such, provides financing to
producers of medical marijuana in exchange for a percentage of the
revenue. It has 66M shares outstanding, which means that the market cap is
about C$63M at Friday's closing price of C$0.95.
CALI would be a
reasonable speculation if it were to move closer to the C$0.50/share price
of its most recent financing, but we have no plan to add it or the stock
of any other marijuana-related company to the TSI List. We may, however,
add a trading position in an ETF such as HMLSF if/when there is a big
improvement in the short-term risk/reward.
Metals and
Mining Stocks
The SPDR Metals and Mining ETF (XME) is
strongly influenced by the stocks of steel producers. The steel sector has
been 'on a tear' over the past several weeks, helping XME to rocket
upward. Based on the weekly RSI shown at the bottom of the following
chart, it is now as 'overbought' as it ever gets.
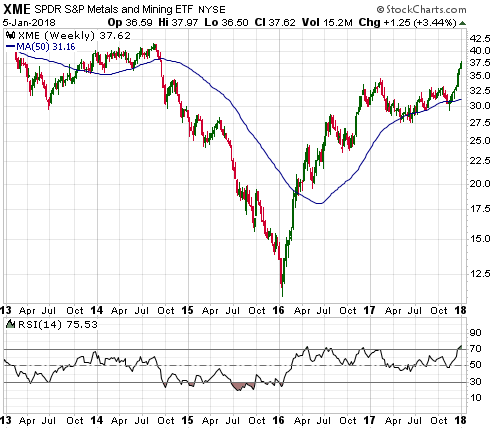
We suspect that the momentum peak -- as indicated by the weekly RSI --
has just been put in place or will occur this week. Based on XME's
performance following similar momentum peaks over the past 10 years, what
we can reasonably expect from here is either a) a sharp correction lasting
at least 3 weeks followed by a surge to a new high for the year, or b) a
choppy 3-4 month extension of the upward trend to an intermediate-term top
(likely the top for the year).
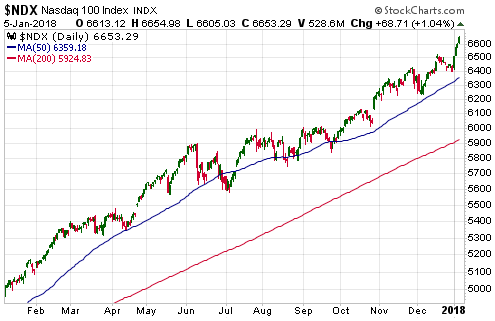
The Broad Market
We were anticipating an NDX spike to a new high during the first week
of the year that potentially would complete the short-term upward trend
and set the stage for a sizable correction. We got the surge to a new
high, but there hasn't yet been any sign of weakness and the market ended
last Friday near its high after rising on each of last week's four trading
days.
Also worth mentioning is that after generating a bearish signal by
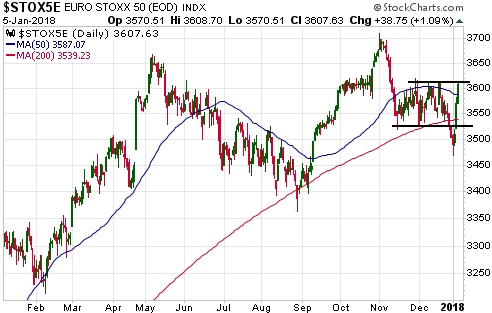
breaking out to the downside in late-December, the EURO STOXX 50 Index
(STOX5E), Europe's equivalent of the Dow Industrials Index, reversed
course last week and added to the rapidly-growing list of false
breakdowns. It is still well below its November peak, but the recent
bearish signal has been negated.
In last week's Interim Update we wrote that for our own account an
initial position had been taken on Wednesday 3rd January in the QQQ (NDX
Trust) April-2018 $150 put options, as much to hedge our exposure to
non-gold stocks as to bet on an NDX decline. We also hold some April-2018
Tesla (TSLA) put options purchased in mid-December. However, we won't add
a new bearish speculation to the TSI List or increase the NDX put-option
position in our own account until there is a downward reversal in the
market.
After a downward reversal, risk management will become more
straightforward. This is because it will then make sense to limit the risk
of loss by placing a protective stop slightly above the recent high.
Everybody's Bullish!
About three weeks ago we
noted that our put/call indicator was close to generating a rare sell
signal. Getting such a signal requires that the put/call situation
simultaneously indicate a high level of optimism on the part of the
general public (the relatively dumb money) and a high level of concern
about downside risk on the part of professional hedgers (the relatively
smart money). The signal never happened.
Currently, the put/call
situation shows complacency/optimism on the parts of both the dumb money
and the smart money. That is, at the moment hardly anyone perceives a high
risk of a large stock market decline.
In addition, some well-known
bears have said that they expect a melt-up to precede the start of a major
decline.
It therefore seems that everybody is bullish, at least
with regard to the market's prospects over the next several months. What
could possibly go wrong?
This week's
significant US economic events
[Notes:
1) The most important events
(to the markets) are shown
in bold. 2) A list of global economic events can be found
HERE]
| Date | Description |
| Monday Jan-08 | Consumer Credit |
| Tuesday Jan-09 | No important events scheduled |
| Wednesday Jan-10 | Import and Export Prices |
| Thursday Jan-11 |
PPI Treasury Budget |
| Friday Jan-12 |
CPI Retail Sales Business Inventories |
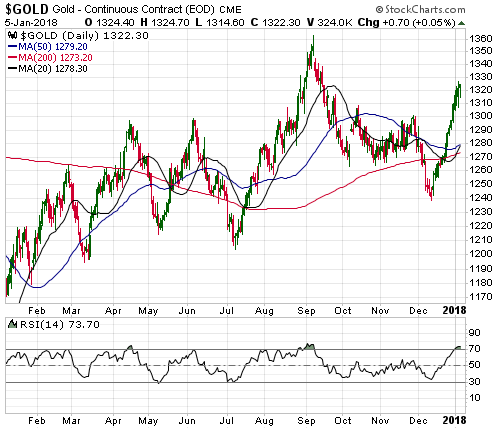
Gold and the Dollar