|
-- Weekly Market Update for the Week Commencing 8th February 2010
Big Picture
View
Here is a summary of our big picture
view of the markets. Note that our short-term views may differ from our
big picture view.
In nominal dollar terms, the BULL market in US Treasury Bonds
that began in the early 1980s will end by mid-2010. In real (gold)
terms, bonds commenced a secular BEAR market in 2001 that will continue
until 2014-2020. (Last
update: 09 February 2009)
The stock market, as represented by the S&P500 Index, commenced
a secular BEAR market during the first quarter of 2000, where "secular
bear market" is defined as a long-term downward trend in valuations
(P/E ratios, etc.) and gold-denominated prices. This secular trend will bottom sometime between 2014 and 2020. (Last update: 22 October 2007)
A secular BEAR market in the Dollar
began during the final quarter of 2000 and ended in July of 2008. This
secular bear market will be followed by a multi-year period of range
trading. (Last
update: 09 February 2009)
Gold commenced a
secular bull market relative to all fiat currencies, the CRB Index,
bonds and most stock market indices during 1999-2001. This secular trend will peak sometime between 2014 and 2020. (Last update: 22 October 2007)
Commodities,
as represented by the Continuous Commodity Index (CCI), commenced a
secular BULL market in 2001 in nominal dollar terms. The first major
upward leg in this bull market ended during the first half of 2008, but
a long-term peak won't occur until 2014-2020. In real (gold) terms,
commodities commenced a secular BEAR market in 2001 that will continue
until 2014-2020. (Last
update: 09 February 2009)
Copyright
Reminder
The commentaries that appear at TSI
may not be distributed, in full or in part, without our written permission.
In particular, please note that the posting of extracts from TSI commentaries
at other web sites or providing links to TSI commentaries at other web
sites (for example, at discussion boards) without our written permission
is prohibited.
We reserve the right to immediately
terminate the subscription of any TSI subscriber who distributes the TSI
commentaries without our written permission.
Outlook Summary
Market
|
Short-Term
(0-3 month)
|
Intermediate-Term
(3-12 month)
|
Long-Term
(1-5 Year)
|
Gold
|
Bullish
(01-Feb-10)
|
Bullish
(12-May-08)
|
Bullish
|
US$ (Dollar Index)
|
Neutral
(20-Jan-10)
| Bullish
(02-Nov-09)
|
Neutral
(19-Sep-07)
|
Bonds (US T-Bond)
|
Neutral
(18-Jan-10)
|
Bearish
(14-Dec-09)
|
Bearish
|
Stock Market (S&P500)
|
Neutral
(07-Dec-09)
|
Bearish
(11-May-09)
|
Bearish
|
Gold Stocks (HUI)
|
Bullish
(01-Feb-10)
|
Neutral
(16-Sep-09)
|
Bullish
|
| Oil | Neutral
(28-Oct-09)
| Neutral
(14-Oct-09)
| Bullish
|
Industrial Metals (GYX)
| Bearish
(21-Sep-09)
| Bearish
(25-May-09)
| Neutral
(11-Jan-10)
|
Notes:
1. In those cases where we have been able to identify the commentary in
which the most recent outlook change occurred we've put the date of the
commentary below the current outlook.
2. "Neutral", in the above table, means that we either don't have a
firm opinion or that we think risk and reward are roughly in balance with respect to the timeframe in question.
3. Long-term views are determined almost completely by fundamentals,
intermediate-term views by giving an approximately equal weighting to
fundmental and technical factors, and short-term views almost
completely by technicals.
Time to bet against junk bonds
In some respects the market
action since March of last year has been a fairly typical reaction to
the preceding crash. For example, although the rebound in the
S&P500 Index has lasted longer than a typical post-crash rebound,
its magnitude has been roughly in line with the historical average. In
other respects, however, the market action has been extraordinary, most
likely due to the huge amount of new money that the senior central
banks have pumped into their respective economies.
One of the most extraordinary aspects of the post-March-2009 market
action has been the phenomenal recovery within the realm of high-yield
bonds, often called "junk bonds". In many instances these bonds have
recouped almost all of their 2008 losses, even though default rates
have risen and there is scant evidence of sustainable economic
improvement.
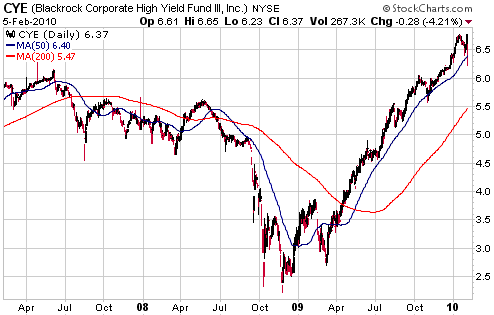
The incredible recovery of the junk bond market is exemplified by the
following chart of the Blackrock Corporate High-Yield Fund (NYSE: CYE),
which recently exceeded its 2007 peak. 'Investors' in junk bonds and
high-yield bond funds are literally partying like it was 2007. The
famous phrase "irrational exuberance" springs to mind.
In our opinion, this
is a good time for experienced speculators to bet against junk bonds
(by, for example, shorting CYE) or bet on a widening of credit spreads
(by, for example, going short CYE and long TLT (a fund that holds
long-dated US Treasury Bonds) in equal dollar amounts). Risk could be
managed by placing a 'buy stop' just above the recent high (the stop
would go just above the recent high in the CYE/TLT ratio if betting on
a widening of credit spreads).
The Stock
Market
In last week's report we
noted that the US stock market had quickly become very 'oversold' and
might bottom via a downward spike during the first half of the week.
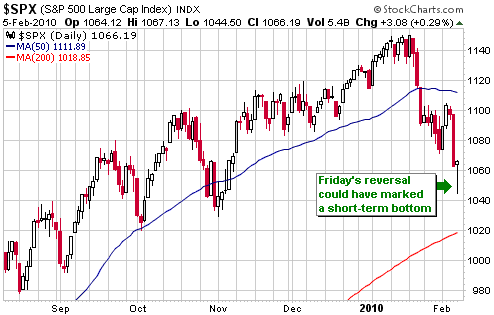
Instead, it rebounded to begin the week and then plunged to a new low
on Thursday. It dropped further during Friday's session before
reversing direction and ending the day with a small gain.
There's a reasonable chance that a short-term bottom was put in place on Friday.
Even if we were very
confident that a short-term bottom was put in place on Friday we
wouldn't be buyers of the S&P500 Index at this time. This is
because we don't perceive sufficient upside potential. We won't be
surprised if the US market makes a new 52-week high within the next two
months, but we will be surprised if it moves more than a few percent
above last month's high.
If the S&P500 Index manages to make a new 52-week high within the
next couple of months, our thinking is that the new high will be
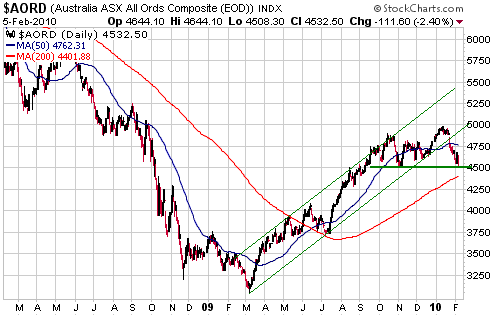
unconfirmed by many other indices. Australia's All Ordinaries Index
(AORD), for instance, is showing signs of having already completed its
post-crash rebound. With reference to the following chart, AORD has
support just below its current price and will probably soon bounce;
however, we suspect that its next rally will top out below the January
peak.
The strategy that
makes the most sense to us is one that involves a) maintaining a large
cash reserve, b) accumulating gold stocks on weakness, and c) scaling
out of most non-gold stocks on strength.
This week's
important US economic events
| Date |
Description |
Monday Feb 08
| No important events scheduled
| | Tuesday Feb 09 | No important events scheduled
| | Wednesday Feb 10
| Trade Balance
Treasury Budget
| | Thursday Feb 11
| Retail Sales
| | Friday Feb 12
| Consumer Sentiment
|
Gold and
the Dollar
Gold
What "usually" happens in a gold bull market
We occasionally read comments along the lines of "when gold is in a
bull market it usually..." and "in gold bull markets such-and-such
generally happens". Here are some specific examples of what we are
referring to:
- "In a gold bull market, silver usually does better than gold"
- "Gold bull markets are associated with rising interest rates"
- "Gold bull markets are driven by high and rising price inflation"
- "Gold bull markets continue until the market value of the US
gold reserve balances the value of US currency in circulation"
The point we want to make today is that comments about what usually
happens in a gold bull market, including the examples cited above, are
based on a sample size of ONE. Specifically, they are based solely on
what happened during the 1970s. (Note: the idea that silver outperforms
gold during a gold bull market is actually based on what happened
during only the final 6 months of the 1970s, because during the first
9.5 years of that decade silver did not outperform gold.)
It is difficult for contrary evidence to penetrate a mind once that
mind is set. Hence the term mind-set: a fixed mental attitude or
disposition that predetermines a person's responses to and
interpretations of situations. For example, the fact that silver has
under-performed gold during the current (10 years and counting) bull
market hasn't yet dented the popularity of the idea that silver
"usually" outperforms when the precious metals are in long-term upward
trends. Also, some analysts still assert that gold bull markets go
hand-in-hand with rising interest rates, even though gold has trended
upward over the past 10 years in parallel with falling interest rates.
Information can certainly be gleaned from what happened during the
1970s, but we shouldn't blindly assume that the characteristics of the
current gold bull market are the same as those of the only prior gold
bull market.
Current Market Situation
From the email alert sent to subscribers following last Thursday's dramatic market action:
"Rather than new
developments, part of what we are seeing right now is a change in the
primary focus of speculators -- from US economic/financial negatives to
European negatives. Some time in the future the primary focus will
undoubtedly return to the US and its trio of disasters known as the
Fed, the Obama Administration, and the ocean of unfunded liabilities.
The realisation that the
euro's fundamentals are just as bad as those of the US$ shouldn't be
bearish for gold, but sentiment is the dominant driver in the
short-term and the gold price tanked on Thursday in sympathy with a
broad-based plunge in commodity prices. Short-term support in the
$1070s was decisively breached and the preliminary sign of an upward
reversal that appeared on Monday was negated. The correction is
obviously still in progress."
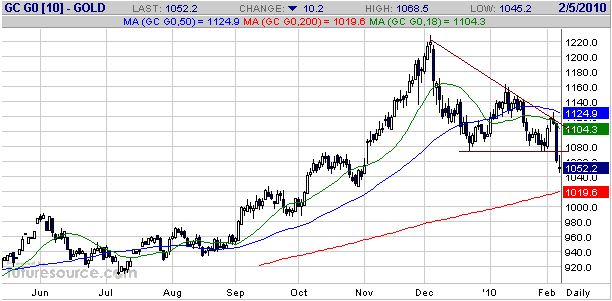
Thursday's breach of support in the $1070s is clearly evident on the
following daily chart of February gold futures. This support is now
resistance and could limit a near-term rebound.
With the benefit of
hindsight it is apparent that we shouldn't have upgraded our short-term
gold outlook last week. However, we are not going to downgrade it in
response to the price action of late last week. The reason is that we
are risk/reward assessors, not trend followers, and although the
downward correction is still in progress the Thursday-Friday decline
was large enough to significantly reduce the remaining downside risk.
Also, last week's strength in the gold stocks relative to the bullion
is a short-term plus for both the stocks and the bullion. The bottom
line is that if we hadn't upgraded our short-term outlook last week, we
would be doing so now.
Just to be clear, we've thought for the past several weeks that the
maximum downside risk on both a short- and intermediate-term basis was
defined by major support at around $1000. This is still the case. As
far as potential reward is concerned, we expect that the next rally
will, at a minimum, retrace a large chunk of the decline that got
underway in early December. This implies about $50 of additional
short-term downside risk versus short-term upside potential of well
over $100.
We don't want to downplay the significance of last week's market
action, because the reality is that the market action of the past few
trading days makes it more likely that gold's downward correction will
prove to be the intermediate-term variety. However, this doesn't
indicate to us that there is more downside risk than previously
thought. In our opinion, the implication of this being an
intermediate-term correction would be that we got several months of
back-and-forth price movement prior to the start of the next major
rally.
From a fundamental perspective, there are three main reasons why we
don't perceive a lot of additional downside risk in the gold price.
First, any significant increase in deflation fear (a potential source
of downward pressure on gold) would prompt a quick inflationary
response from both the Fed and the ECB; second, increasing instability
within Europe's monetary union (a recent source of downward pressure on
gold due to the upward pressure it put on the Dollar Index) should
eventually lead to greater investment demand for gold as well as the
US$; and third, US Federal Government spending is intentionally (you
don't come up with a $3.8 trillion dollar budget by accident) out of
control.
Silver
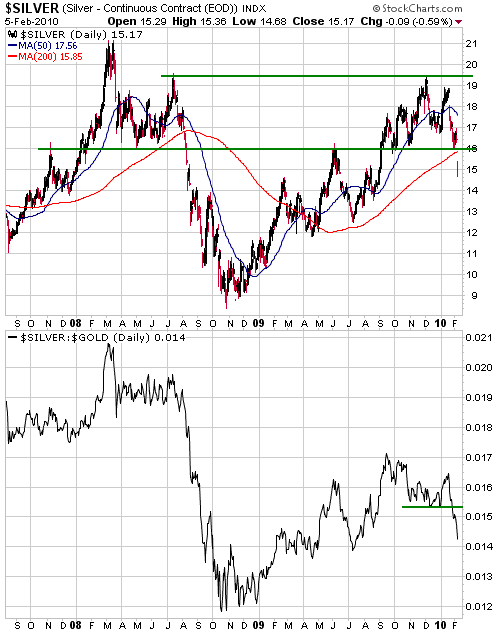
Whereas gold still has a realistic chance of making a new high within
the next few months, silver's chance was all but eliminated last week
when it plunged below intermediate-term support at $16.00. The top
section of the following daily chart shows silver's current situation.
The silver market is now very 'oversold' and will probably soon
rebound, but we expect that any rebound in the near future will
encounter formidable resistance in the $16-$17 range.
The bottom section of the following chart shows the silver/gold ratio,
which has also broken out to the downside. On an intermediate-term
basis the silver/gold ratio often trends with the broad US stock
market, so the pronounced weakness in this ratio over the past few
weeks could have implications beyond the precious metals.
Interestingly, the silver/gold ratio turned upward a few months ahead
of the broad stock market in October of 2008 and appears to have turned
downward a few months ahead of the broad stock market in September of
2009.
Gold Stocks
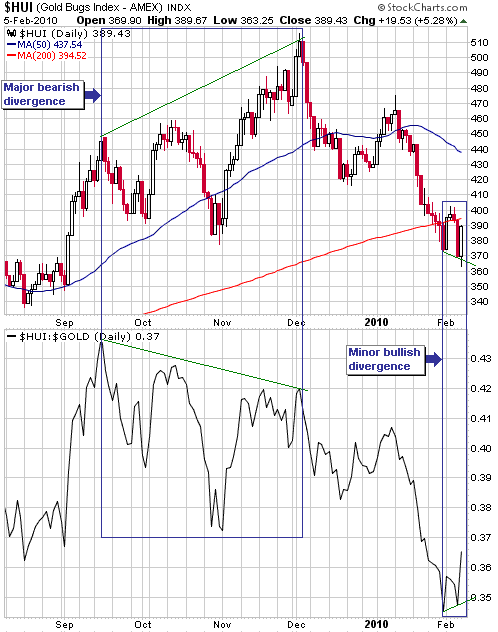
Gold bullion lost about $17 over the course of last week while the HUI
gained 16 points. This has created a bullish divergence between the HUI
and the HUI/gold ratio as indicated on the following chart. This
divergence has the form of a lower low for the HUI in parallel with a
higher low for the HUI/gold ratio, followed by a rise to a new
multi-week high by the HUI/gold ratio. It is the opposite of what
happened between mid September and early December of last year,
although on a much smaller time scale. Refer to the following chart for
details.
Based on what
happened during previous intermediate-term corrections over the past
decade, our expectation is that the HUI's next multi-week rally will
retrace 50%-70% of the decline from the 2nd December peak. If Friday's
intra-day low of 363 proves to be the bottom of the decline then we
will look for a rise to 440-470 within the next two months, with some
hesitation along the way at 400 and 420.
In the email alert sent after the close of trading last Thursday we
cautioned that even though the gold sector could be close to an
important low it was not the time to be buying anything -- including
gold stocks -- aggressively. In general terms, it can often be a
mistake to buy quickly in response to a price decline or to sell
quickly in response to a price rise; the reason being that prices will
regularly move much lower during the downward corrections and much
higher during the rallies than a rational observer initially expects.
This is particularly the case when dealing in small-cap stocks, as is
our wont. The fact is that many 'investors' are easily spooked,
oblivious to value, and liable to either cough-up shares at
ridiculously low prices or eagerly buy at ridiculously high prices.
The best way to take advantage of the market's manic-depressive nature
is to methodically build positions over time during the purges and to
methodically harvest gains over time during the subsequent surges.
Currency Market Update
The price action determines the news coverage
In October of last year there was a story in a British newspaper about
the Gulf Arab states being in secret talks with Russia, China, Japan
and France to replace the US dollar with a basket of currencies in
trading oil. We said at the time that the story was probably untrue,
but that in any case the dollar's relative value was determined by the
global demand to HOLD it; not by its use in oil trading (the demand for
dollars created by the oil trade is very small relative to the total
demand for dollars). We also pointed out that the story about pricing
oil in a currency other than the US$ always seems to crop-up after the
dollar has been trending lower for several months, and that we
considered it a contrary indicator.
Fast-forward to the present. These days, nobody in the mainstream press
talks about the possibility of the Arabian Gulf states requiring
payment in a currency other than the US$. The big story now is the
threat that some of the Euro Zone's peripheral countries will default
on their debts.
The stories that appear in the financial press are often nothing more
than reactions to the most recent price action. The story about
oil-producing nations shifting away from the US$ is a good example in
that this story was just as irrelevant in October of last year as it is
today, but it garnered a lot of credibility (and created a small storm)
back then because it meshed with the price action. Similarly, the risk
of Greece defaulting on its debt was just as real in October of last
year as it is today, but back then the risk wasn't featured prominently
in the mainstream media because the euro was in an upward trend.
Feedback loops regularly develop whereby the price trend prompts
financial journalists to emphasise certain news stories, and the news
coverage then helps to extend the price trend. In such cases it is
generally the price action that sets the loop in motion.
Current Market Situation
The following discussion is probably going to seem a bit complex or convoluted, but it can't be helped.
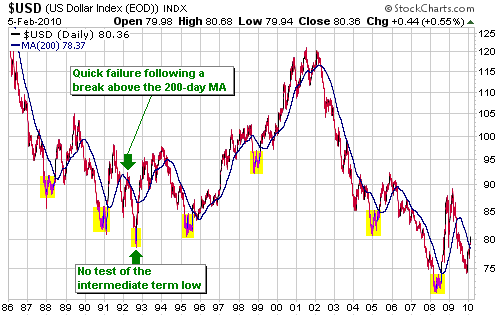
Displayed below is a daily chart of the Dollar Index covering the past
24 years. The intermediate-term lows that occurred during this period
-- excluding the November-2009 low, which has not yet been 100%
confirmed as the intermediate-term variety -- have been shaded in
yellow. The blue line on the chart is the 200-day moving average (MA).
The chart shows that there were seven intermediate-term lows during
1986-2008, and that six of these lows involved an initial multi-week
rally followed by a decline to test the low (note that the test of the
low is sometimes difficult to see on the long-term chart, but in each
case it becomes apparent when viewing a chart that zooms-in on the
price action around the low). The lone exception was the low that was
put in place during the third quarter of 1992.
The strong historical tendency for the Dollar Index to 'test' its low
is why we have thought that last November's low would probably be
tested prior to the start of a multi-month advance that would, at a
minimum, take the Dollar Index up to 90.
The chart also shows that a) when intermediate-term lows have formed
via an initial multi-week rally followed by a decline to test the low,
the initial rally has never exceeded the 200-day MA, and b) with only
one exception (early 1992), a move from well below the 200-day MA to
above this MA has always been followed by significant additional gains
over the ensuing 1-2 months.
Putting the above together, the combination of the recent price action
(the recent advance has taken the Dollar Index well above its 200-day
MA) and the historical record suggests that: 1) there will be no
pullback to test the November-2009 low and the Dollar Index will
maintain its short-term upward trend over the coming 1-2 months, OR 2)
the November-2009 low was NOT the intermediate-term variety (meaning
that the current short-term advance will be followed by a decline to a
new 52-week low).
The obvious question then is: how will we know which scenario is in play?
We won't know for certain until the Dollar Index moves to a much higher
level or breaks to a new low, but the extent of the next pullback
should give us a pretty good idea.
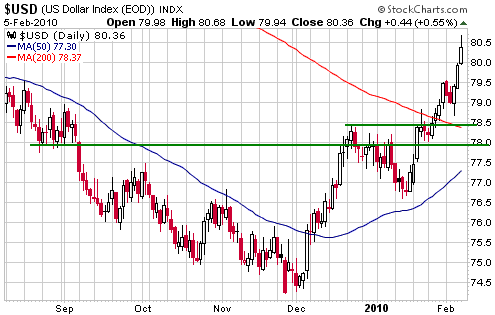
Zooming in to the current situation (refer to the chart displayed
below), we see the Dollar Index's recent break above lateral resistance
and the 200-day MA. If an intermediate-term advance is in progress --
meaning that Scenario 1) is most likely playing out -- then the next
pullback should not breach former resistance (now support) at
78.0-78.5. In this case, the next pullback would probably look similar
to the one that unfolded between the 3rd week of December and the
second week of January. Alternatively, a break below 78 would suggest
that the Dollar Index was headed to a new 52-week low and perhaps even
to a new all-time low.
Below is a chart
showing the S&P500 Index and the Canadian Dollar. The chart's
message is that you shouldn't be bullish on the Canadian Dollar unless
you are bullish on the US stock market.
Update
on Stock Selections
(Note: To review the complete list of current TSI stock selections, logon at http://www.speculative-investor.com/new/market_logon.asp
and then click on "Stock Selections" in the menu. When at the Stock
Selections page, click on a stock's symbol to bring-up an archive of our comments on the stock in question)
 New trading position: Junior Gold Miners ETF (NYSE: GDXJ). Recent price: US$22.93 New trading position: Junior Gold Miners ETF (NYSE: GDXJ). Recent price: US$22.93
We are going to add a short-term trading position in GDXJ to the TSI
Stocks List at Friday's closing price of US$22.93. The initial stop on
this trade will be a daily close below US$21.10. The stop has been set
at this level because the trade is based on the idea that a short-term
bottom was put in place on Friday, meaning that a daily close below
Friday's intra-day low ($21.18) would indicate that the basis of the
trade is wrong.
As previously suggested, longer-term speculators who don't want the
hassle of selecting and following individual junior gold/silver
companies could simply scale into a GDXJ position over time during
periods of weakness.
 VIX Futures ETN (VXX). Recent price: US$32.65 VIX Futures ETN (VXX). Recent price: US$32.65
Due to the likelihood of the US stock market having made a short-term
bottom last Friday we have decided to exit VXX at Friday's closing
price of $32.65. The profit on the 3-week trade was 12.7%.
As indicated by its name, VXX is designed to track VIX futures rather
than the VIX itself. This means that VXX will sometimes move by
significantly less than the VIX and at other times move by more than
the VIX.
One of the keys to how VXX performs relative to the VIX during a market
decline will be the difference between the VIX and the nearest VIX
futures contract at the beginning of the decline. For example, when the
nearest VIX futures contract is well above the VIX -- as was the case
when we added VXX to the TSI Stocks List in mid January -- then it's
likely that the futures contract will rise by substantially less than
the underlying index in response to the increase in fear that
accompanies a short-term market decline. This is because the futures
market has already discounted some of the increase in volatility.
Therefore, if we decide to return VXX to the TSI List in the future we
will pay more attention to the difference between the Volatility Index
(VIX) and the VIX futures at the time the trade is entered.
Chart Sources
Charts appearing in today's commentary
are courtesy of:
http://stockcharts.com/index.html
http://www.futuresource.com/

|

