![]()
![]()
![]()
![]()
-- Weekly Market Update for 8th July 2019
Big Picture
View
Here is a summary of our big picture
view of the markets. Note that our short-term views may differ from our
big picture view.
The BULL market in US Treasury Bonds that began in the early 1980s ended in mid-2016, but there will be many years of topping action in bond prices and bottoming action in bond yields before major new trends get underway. A major decline in government bond prices will unfold during the 2020s. (Last update: 11 September 2017)
The stock market, as represented by the S&P500 Index, commenced a secular BEAR market during the first quarter of 2000, where "secular bear market" is defined as a long-term downward trend in valuations (P/E ratios, etc.), gold-denominated prices and inflation-adjusted prices. This secular trend will bottom in 2020 or later. (Last update: 11 September 2017)
A cyclical BEAR market in the US Dollar began in 2016-2017. (Last update: 11 September 2017)
Gold commenced a secular bull market relative to all fiat currencies, the CRB Index, bonds and most stock market indices during 1999-2001. This secular trend will peak in 2020 or later. (Last update: 11 September 2017)
Commodities,
as represented by the CRB Index, commenced a
secular BULL market in 2001 in nominal dollar terms. The first major
upward leg in this bull market ended during the first half of 2008, but
a long-term peak won't occur until 2020 or later.
(Last
update: 11 September 2017)
Copyright
Reminder
The commentaries that appear at TSI
may not be distributed, in full or in part, without our written permission.
In particular, please note that the posting of extracts from TSI commentaries
at other web sites or providing links to TSI commentaries at other web
sites (for example, at discussion boards) without our written permission
is prohibited.
We reserve the right to immediately
terminate the subscription of any TSI subscriber who distributes the TSI
commentaries without our written permission.
True
Fundamentals Summary
[Notes:
1) The date shown next to the current True Fundamentals Model (TFM) signal is
when the most recent change occurred. 2) Charts of the Gold and Equity
TFMs are included in the "Charts and Indicators" section of the TSI web
site]
| Market | True Fundamentals Model (TFM) |
| Gold (US$ Price) | Bullish (04 Jan 2019) |
| US Equity (SPX) | Bearish (19 Apr 2019) |
| Currency (Dollar Index) | Neutral (15 Mar 2019) |
| Commodities (GNX) | Bearish (01 Jun 2018) |
Last week's posts at the TSI Blog
There were no blog posts last week.
Summary of current
thinking/positioning
1) The Dollar Index (DX) has
commenced a downward trend, but it could be a few months before the new
trend becomes consistent. In the meantime the price action could be
choppy, possibly involving a test of the May high near 98.
2) The
US$ gold price has broken out to the upside on a monthly basis.
Significant additional gains are likely within the next three months --
after a correction has run its course. The correction was/is expected to
result in a test of former resistance (now support) in the $1350-$1380
range. The US$ silver price stands a good chance of making a catch-up move
over the months ahead.
3) The gold-mining indices/ETFs became
extremely 'overbought' late last month and are now in correction mode. The
correction most likely will end after either a decline to the 50-day MA or
a few more weeks of sideways movement.
4) The SPX probably will
commence a sizable multi-week decline within the next two weeks.
5)
An upside blow-off has set the stage for a large T-Bond decline. If the
decline didn't begin on Friday 5th July then it should begin very soon,
although it could be September-October before the market starts trending
downward with conviction.
6) Oil's correction is probably over,
although there is still a risk that stock market weakness during
July-August will push the oil price to a new multi-month low.
7) We
are holding a cash reserve of 25%-30%.
US Recession
Watch
A month ago we wrote that if
commonsense did not prevail within the next few months then the Trump
tariffs could be comparable to the Smoot-Hawley tariffs of 1930 in terms
of their economic cost (one of the few things that almost all economists
agree on is that the Smoot-Hawley tariffs exacerbated the Great
Depression). Over the intervening period the tariff-related risk to the US
economy was reduced by the withdrawal of the threats to a) impose a hefty
tax on all imports from Mexico and b) add a tax to another $300B of
imported Chinese products. In any case, regardless of whether the
proximate catalyst for an economic contraction is the "trade war" or
something else entirely, our favourite leading recession indicators should
generate timely warning signals. These indicators are the ISM New Orders
Index (NOI), Real Gross Private Domestic Investment (RGPDI) and the yield
curve.
The latest monthly NOI was reported on Monday 1st July and
revealed that there was a small but significant decline in this measure of
manufacturing-industry strength in June. The index is now at 50, a new
2-year low.
50 is the official demarcation line between economic
expansion and contraction, but interpreting a sub-50 NOI as a recession
warning results in too many false signals. For example, it would have
resulted in false recession signals in 2012, 2013, 2015 and 2016. Most of
the false signals are eliminated without causing significant delays to
genuine signals if we set the demarcation line at 48, which is why we
define an NOI decline to below 48 (the red line on the following chart) as
a recession warning.
The upshot is that the NOI hasn't issued a
recession warning yet, but it is close to doing so.
The next quarterly RGPDI number will be published late this month, so
by the time we do our next "US Recession Watch" we will have new RGPDI
information.
The yield curve generates a recession warning when it
'flattens' to an extreme and then begins to steepen, regardless of whether
or not the extreme entails an inversion.
The US yield curve is
represented on the first of the following charts by the 10yr-2yr yield
spread and on the second of the following charts by the 10yr-3mth yield
spread. The 10yr-2yr spread has increased a little since bottoming late
last year and recently made a failed break above its 200-day MA, whereas
the 10yr-3mth spread remains in a clear-cut downward trend and close to an
11-year low.
As an aside, we require that a reversal in the yield
curve be signaled by reversals in both the 10yr-2yr and 10yr-3mth spreads.
This reduces the risk of being whipsawed. For example, if we had been
focused on only the 10yr-2yr spread then we would have been whipsawed by
this spread's recent non-sustained upward reversal.
The 10yr-3mth
spread has dropped well into negative territory, meaning that this part of
the yield curve is decisively inverted. The fact that it remains in a
declining trend indicates that the boom has not ended yet, but the fact
that it is well below zero indicates that the boom almost certainly will
end within the next 12 months.
Based on the latest data, our rough estimates of recession start-time
probabilities are:
- Q3-2019: 10% (down from 15% a month
ago)
- Q4-2019: 30% (down from 35% a month ago)
-
2020: 50% (not specified a month ago*)
- Later than 2020: 10%
(not specified a month ago*)
*Last month we
had a 50% probability of a recession starting later than 2019. That has
increased to 60%.
Monetary
Inflation Roundup
Here is our monthly update on
what's happening on the monetary inflation front in a few different
regions/countries.
Over the past three months the G2 (US plus
euro-zone) monetary inflation rate moved sideways at a 10-year low of 4.3%
and now has spent 21 months below the boom-bust threshold of 6%. Refer to
the following chart for details.
The low rate of G2 monetary inflation stems from the very low rate of
money-supply growth in the US. The year-over-year (YOY) rate of growth in
US True Money Supply (TMS) is languishing at 2%, which is close to a
20-year low.
Despite the slow pace of growth in US money supply,
US monetary conditions are still quite easy thanks to the reduced demand
to hold cash. That's why the slow monetary inflation rate has not yet set
in motion an economic bust and brought the bull market in US equities to
an end.
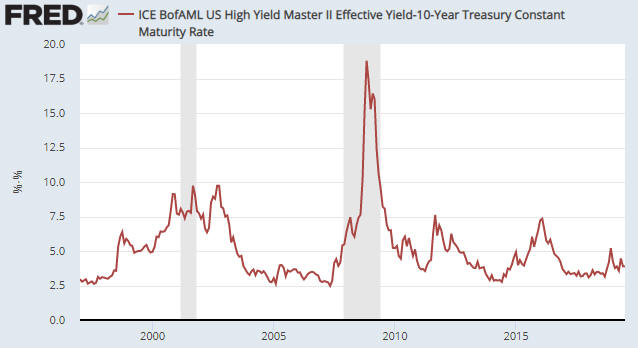
It isn't possible to measure directly the demand to hold
cash balances, but there are financial-market indicators of money demand
relative money supply. The average credit spread is one of the best.
Regardless of what's happening to the supply of money, when credit spreads
across the economy are narrow by historical standards it means that
monetary conditions are 'easy', and when credit spreads across the economy
are wide by historical standards it means that monetary conditions are
'tight'. The following chart shows that credit spreads currently are near
20-year lows.
Australia's monetary inflation rate has picked up a little over the
past few months, but the country remains on the verge of monetary
deflation.
The very slow money-supply growth has taken a
significant, albeit not yet substantial, toll on Australia's property
market. There are signs that a post-election boost to sentiment is
providing some price support, but house prices in Sydney and Melbourne,
the two largest Australian cities, are down by an average of 15% and 11%,
respectively, since their 2017 peaks.
Canada's monetary inflation rate bottomed at 2.8% (the lowest level in
more than 15 years) 12 months ago. It has since rebounded to a little over
5%, which is still very low based on the standards of recent decades.
On a nationwide basis the effects of the relatively slow pace of
money-supply growth have been minor to date. For example, house prices
have leveled off over the past 6-12 months, but a sizable price correction
has not occurred...yet.
The YOY rate of growth in Hong Kong's M2 money supply has languished
near a 10-year low in the 1%-4% range over the past year. Remarkably,
however, the low monetary inflation rate is yet to have a pronounced
effect on the world's most expensive real estate (the average house price
in HK is about 40% higher than the average house price in Singapore, the
world's second most expensive city to buy a house, and approximately
double the average house price in New York and London). Property prices
dropped in HK during August-December of last year, but they have since
made new all-time highs.
Due to the monetary backdrop we think
there's a high risk of a double-digit decline in HK property prices over
the next 12 months. That being said, it is notoriously difficult to
predict when a major investment bubble will burst.
In summary, the pace at which new money is being created around the
world remains unusually slow, but the effects of the monetary slow-down
have been surprisingly 'uninteresting' to date. As mentioned in relation
to the US, this could be due to a general decline in the desire to hold
cash.
Interest Rates
What the market expects
from the Fed
According to the prices of Fed Funds Futures
(FFF) contracts, over the past 1-2 weeks the market has dialed back its
expectations regarding Fed rate cuts.
Two weeks ago the market had
priced in three-and-a-bit 0.25% rate cuts before year-end, but now the
market is pricing in only two-and-a-half 0.25% rate cuts. Also, two weeks
ago the market had assigned a probability of around 50% that the Fed would
start its rate cutting with a 0.50% move at the end-July FOMC meeting, but
thanks largely to a positive surprise in the US employment numbers
reported on Friday 5th July the assigned probability of a 0.50% cut at the
end of July has dropped to zero. The expectation, now, is that the Fed
will cut by 0.25% at the end of this month and make 1-2 additional 0.25%
cuts before the end of the year.
Our current guess is that the Fed
will make two 0.25% rate cuts before the end of September and be on hold
for the remainder of the year.
A potential T-Bond reversal
Tentative signs have emerged of a downward trend reversal in the bond
market.
As illustrated by the following daily chart, the 20+ Year
Treasury ETF (TLT) made a new high for the year on Wednesday 3rd July and
then dropped sharply on Friday 5th July (the market was closed on
Thursday). In addition, the higher highs achieved by TLT since the end of
May have gone with a downward trend in the daily RSI shown at the bottom
of the following chart. This is a potentially bearish momentum divergence.
A daily close below last week's low would be preliminary evidence that
a top of at least short-term importance is in place.
The Stock Market
Current Market Situation
At this time last week the outcome of the Trump-Xi meeting had just
become known, prompting us to write: "Although the meeting outcome
appears to be in line with what most market participants were expecting,
the removal of a near-term source of uncertainty could give sentiment a
sufficient boost to push the senior US stock indices to new all-time highs
this week."
It turned out that sentiment was, indeed, given a
sufficient boost by the temporary winding-down of US-China government
conflict to push the SPX into new-high territory, with the breakout
confirmed and led by the Advance-Decline Line (ADL).

However, at this stage the S&P500 (SPX) is the only important US stock
index to break out to the upside on a weekly closing basis. Some indices
are testing their highs and therefore are close to breaking out to the
upside, while other indices are not remotely close to their all-time
highs. The following daily charts show an example of the former (the
NASDAQ100 - NDX) and the latter (the Dow Transports - TRAN). The NDX is
testing its April-2019 all-time. The TRAN, however, is well below its
April-2019 high, which, in turn, is well below the 2018 all-time high.
Given the TRAN's tendency to be a leader to the downside around
important stock market peaks, this index's relative weakness should be
viewed as a significant bearish divergence.
The on-going strength in the ADL indicates that a major decline is NOT
about to begin, but the combination of the recent put/call sell signal and
the divergences between the stock indices is a reason to think that a
tradable 1-2 month decline will get underway soon.
The tendency of
the US stock market to make an intermediate-term top during the first half
of July is also noteworthy. For example, intermediate-term tops occurred
at this time of the year in 1990, 1998, 1999, 2007, 2011 and 2015.
With regard to speculating ideas, over the past 1-2 weeks we wrote
that a boost from trade-related optimism would present an opportunity to
establish or add to short-term bearish speculations, with risk then
managed by placing an initial 'stop' slightly above whatever high is in
place by mid-July. We also mentioned an alternative tactic, which was to
wait for a downward reversal before entering or adding to a bearish
speculation. Specifically, we wrote that if the SPX closed at a new
all-time high (above 2964), then a subsequent daily close below 2940 could
be viewed as a reversal signal.
The SPX has closed at a new
all-time high, so a daily close below 2940 could now be viewed as a
reversal signal.
In summary, we think that the long-term bull
market is intact, but we are expecting that a tradable 1-2 month decline
will start by the middle of this month.
A brief comment on
the banking sector
On the following weekly chart there is
a note to the effect that the current position of the US Bank Index (BKX)
is similar to the position of this index at this time (early July) three
years ago. If the similarity persists then the BKX will perform very well
over the next 6 months.
One of the keys to how the banking sector
performs over the next several months will be the performance of the bond
market. In particular, if the T-Bond is about to embark on an
intermediate-term decline, which it was at this time three years ago, then
the BKX will be helped by an interest-rate tail-wind (bank stocks tend to
do relatively well when long-term interest rates are rising).
This week's
significant US economic events
[Notes:
1) The most important events
(to the markets) are shown
in bold. 2) A list of global economic events can be found
HERE]
| Date | Description |
| Monday Jul-08 | Consumer Credit |
| Tuesday Jul-09 | NFIB Small Business Index |
| Wednesday Jul-10 | FOMC Minutes |
| Thursday Jul-11 |
CPI Treasury Budget |
| Friday Jul-12 | PPI |
Gold and the Dollar