


-- Weekly Market Update for the Week Commencing 8th August 2016
Big Picture
View
Here is a summary of our big picture
view of the markets. Note that our short-term views may differ from our
big picture view.
The BULL market in US Treasury Bonds
that began in the early 1980s ended in early-2015, but there will be many years
of topping action in bond prices and bottoming action in bond yields before
major new trends get underway. (Last update: 29 June 2015)
The stock market, as represented by the S&P500 Index,
commenced
a secular BEAR market during the first quarter of 2000, where "secular
bear market" is defined as a long-term downward trend in valuations
(P/E ratios, etc.) and gold-denominated prices. This secular trend will bottom sometime between 2018 and 2020.
(Last update: 29 June 2015)
A secular BEAR market in the
US
Dollar
began during the final quarter of 2000 and ended in July of 2008. This
secular bear market will be followed by a multi-year period of range
trading.
(Last
update: 09 February 2009)
Gold commenced a
secular bull market relative to all fiat currencies, the CRB Index,
bonds and most stock market indices during 1999-2001.
This secular trend will peak sometime between 2018 and 2020.
(Last update: 29 June 2015)
Commodities,
as represented by the CRB Index, commenced a
secular BULL market in 2001 in nominal dollar terms. The first major
upward leg in this bull market ended during the first half of 2008, but
a long-term peak won't occur until 2018-2020.
(Last
update: 29 June 2015)
Copyright
Reminder
The commentaries that appear at TSI
may not be distributed, in full or in part, without our written permission.
In particular, please note that the posting of extracts from TSI commentaries
at other web sites or providing links to TSI commentaries at other web
sites (for example, at discussion boards) without our written permission
is prohibited.
We reserve the right to immediately
terminate the subscription of any TSI subscriber who distributes the TSI
commentaries without our written permission.
Outlook Summary
Market
|
Short-Term
(1-3 month)
|
Intermediate-Term
(6-18 month)
|
Long-Term
(2-5 Year)
|
|
Gold
|
N/A |
Neutral
(27-Jun-16) |
Bullish
|
|
US$ (Dollar Index)
|
N/A |
Bullish
(29-Feb-16) |
Neutral
(19-Sep-07) |
|
US Treasury Bonds (TLT)
|
N/A |
Bearish
(19-Oct-15)
|
Bearish |
|
Stock Market
(DJW)
|
N/A |
Neutral
(04-Jul-16) |
Bearish
|
|
Gold Stocks
(HUI)
|
N/A |
Neutral
(04-May-16) |
Bullish
|
|
Oil |
N/A |
Neutral
(26-Oct-15) |
Bullish
|
|
Industrial Metals
(GYX)
|
N/A |
Bullish
(04-July-16) |
Bullish |
Notes:
1. Our short-term expectations are discussed in the commentaries, but except in
special circumstances we won't attempt to assign a "bullish", "bearish" or
"neutral" label to these expectations.
2. The date shown below the current outlook is when the most recent outlook change occurred.
3. "Neutral" means that we think risk and reward are roughly in balance with respect to the timeframe in question.
4. Long-term views are determined almost completely by fundamentals and intermediate-term views
are determined by a combination of fundamentals, sentiment and technicals.
Last week's posts at the TSI Blog
There will never be a "commercial signal failure" in the gold market
Does the Fed support the stock market?
Summary of current
thinking/positioning
1) Concerned about short-term
downside risk in gold, silver and the associated mining stocks, but
comfortable maintaining 'core' exposure in anticipation of large
additional gains over the next two years. Also, still looking for
opportunities to buy into 'special situations' -- small/illiquid gold
stocks that could generate large gains independently of sector-wide
performance.
2) Planning to increase exposure to non-gold
commodity-related stocks (primarily base-metals producers/explorers, but
also energy and agriculture companies) during periods of price weakness
over the next four months in anticipation of 2017-2018 being a very
bullish period for commodities.
3) Thinking that the time has
arrived to start preparing for the possibility/risk of significant
downside in the stock market during September-October. The stronger the
market during August the more likely a large decline during
September-October.
5) Speculating on short-term downside in the
'safe haven' government bonds.
6) Starting to suspect that the
commodity currencies have completed the downward corrections that began in
late-April, but awaiting more evidence to confirm or deny.
7)
Maintaining a large cash reserve in recognition of the downside risk in
almost all equities, although the cash percentage has been slightly
reduced over the past month via the accumulation of non-gold commodity
stocks. Current cash percentage is around 50%.
Commodities
A possible bottom for
the oil price
The crude oil price has been following the
currency market. Oil's strongest positive correlation is with the Canadian
dollar (C$), but it also has an interesting relationship with the Chinese
Yuan.
Based on historical lead-lags, after both the C$ and the Yuan
reversed downward in April it became very likely that a significant
downward correction in the oil market would begin by early June. The
correction occurred and may or may not be complete. Whether or not it is
complete will be influenced to a large extent by whether the recent
upturns in the C$ and the Yuan prove to be sustainable.
The
following chart compares the oil price with CYB, a Yuan proxy. Notice that
since the beginning of this year CYB (the green line) has led the oil
price (the black line) by a few weeks at turning points. The periods from
a turning point in CYB to an equivalent turning point in the oil price are
indicated by blue boxes on the chart.

Copper warning signal still in place
The
warning about short-term weakness in the copper price that was generated
by the COT (Commitments of Traders) data a little more than a fortnight
ago remains in place, as copper's COT situation hasn't changed.
We
are not forecasting it, but we won't be surprised if the copper price
pulls back to around US$2.00 within the next few weeks.

The Stock Market
The US
A valuation and recession indicator
The Wilshire 5000 Index is the broadest of the popular US stock
indices. It pretty much covers the entire US stock market. The
Wilshire5000/GDP ratio therefore indicates overall stock-market
capitalisation relative to the size of the economy, which is a measure of
the extent to which the stock market is over/under-valued since the stock
market's total capitalisation should be proportional to the size of the
economy.
The chart shows that with the exception of the 1999-2000
bubble peak, since 1970 the US stock market has never been more expensive
than it has been over the past 2 years. Furthermore, despite having pulled
back from its Q2-2015 top, by this measure the US stock market is
currently about 10% more expensive than it was at the major high of 2007.
Remarkably, an unusually-high valuation has been sustained over the past
couple of years despite a complete absence of earnings growth.
The
overarching message is that there is a lot of valuation-related downside
risk in the US stock market.
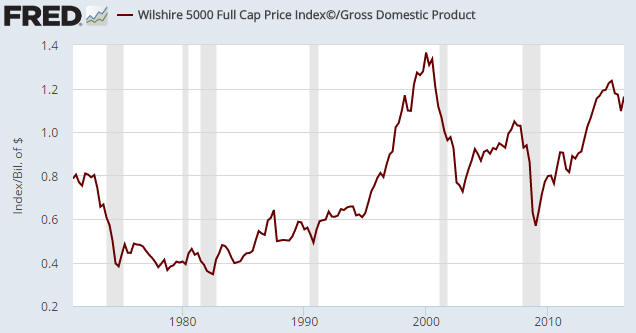
Interestingly, in addition to being a long-term measure of the stock
market's valuation the Wilshire/GDP ratio works rather well as a leading
indicator of economic recession. Periods of official recession are the
shaded areas on the above chart.
Notice that with the exception of
the 1980 episode, the Wilshire/GDP ratio turned down in advance of every
recession since 1970. The reason it probably didn't turn down ahead of the
1980 recession was that the stock market was very under-valued at the
time. In other words, it seems that prior to the 1980 recession the stock
market was already discounting the worst-case scenario. That's obviously
not the case today.
The decline in the Wilshire/GDP ratio from its
Q2-2015 peak is large enough to be interpreted as a recession warning. It
is similar to the warning generated by Real Gross Private Domestic
Investment, which was discussed at TSI last week, in that it points to a
recession beginning within the next few quarters but not necessarily
within the next few months.
Current
Market Situation
Last week's price action was bullish. Of
particular note, the NYSE Composite Index (NYA) reversed upward during the
second half of the week after testing support at 10600 during the first
half of the week.
The NYA appears to be on its way to a test of the
2015 peak. A break by the NYA above last year's high would be confirmation
of the new high achieved by the SPX, but it wouldn't reduce the
probability of a sharp decline during September-October.
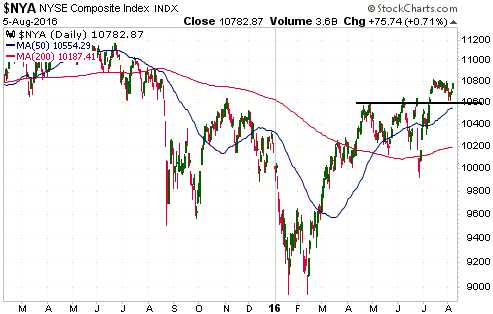
We are looking ahead to the possibility of a large decline during
September-October, but it should be understood that the set-up for a large
decline is currently not in place. To put it another way, certain things
will have to happen with the price action, market internals and sentiment
over the next few weeks to set the stage for the sort of decline that
could be very profitably traded. However, there is no guarantee that these
things will happen, and if they don't then any bearish speculations
established now or in the near future will end with losses.
Therefore, it is important to only have a small amount of money at risk in
bearish speculations at this time and to wait for more signs of
weakness/vulnerability before establishing a chunkier position.
Europe
Unlike the senior US stock indices, the
EURO STOXX 50 Index (STOX5E) suffered a cyclical decline during 2015-2016.
There is currently no decisive evidence that the decline is complete, but
it wouldn't take much additional strength from here to generate evidence
that a sustainable double-bottom was put in place during the first half of
this year.
A weekly close above 3157, which is about 6% above last
Friday's close, would do it. This is because such a development would
break the STOX5E's sequence of declining tops that dates back to the
April-2015 high and also break the index above both its channel top and
its 200-day MA.
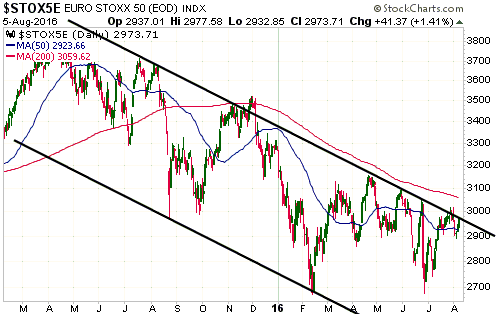
One of the US stock market's biggest pluses at the moment is the
realistic possibility that the senior European stock indices have
completed cyclical declines. The reason is that if European equities are
in the process of turning upward on a sustained basis then an important
source of downward pressure will be removed from the US market.
This week's
significant US economic events
[Notes:
1) The most important events
(to the markets) are shown
in bold. 2) A list of global economic events can be found
HERE]
| Date |
Description |
|
Monday August 08 |
No important events scheduled |
| Tuesday
August 09 |
Q2 Productivity and Costs |
|
Wednesday August 10 |
Treasury Budget |
|
Thursday August 11 |
Import and Export Prices |
|
Friday August 12 |
Retail Sales
PPI
Business Inventories
Consumer Sentiment |
Gold and the Dollar
Gold
Gold remains hostage to small changes in the expected
FFR
The monthly US employment reports have no relevance except for
their influence on the Fed and market expectations regarding future Fed actions.
The moderately strong employment data reported last Friday, for example,
provides no information about the current or likely future performance of the US
economy, but was noteworthy because it led to a slight increase in the expected
level of the Fed Funds Rate (FFR).
The change in the expected level of
the FFR in response to Friday's employment news is illustrated by the following
daily chart. The last bar on the chart shows a fall of 0.09 in the price of the
January-2018 Fed Funds Futures (FFF) contract, which means that the expected
level of the FFR in January-2018 rose by 0.09 (9 basis points) last Friday.
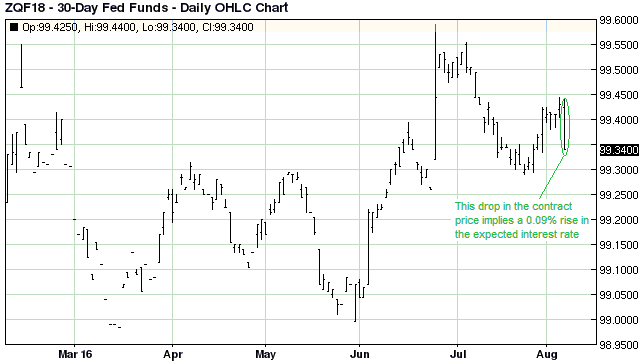
Now, under more normal circumstances a 0.09% change in the expected level of
the FFR in 17 months' time would not have a significant effect on the gold
market, but these aren't normal circumstances. These are circumstances in which
the actions and expected future actions of central banks are dominating all
other considerations. Consequently, just as a minor decrease in the expected FFR
during the final week of July and the first two trading days of August propelled
the gold price from around $1310 to the $1370s, a minor increase in the expected
FFR on Friday predictably had the opposite effect.
Does this mean that if
the expected FFR builds on Friday's gain over the days/weeks ahead then the gold
price will probably trend downward over the same period? Yes, that's exactly
what it means. It also means that if something happens in the world to cause the
expected FFR to move below the lows of the past few weeks then the gold price
will probably move to a new high for the year.
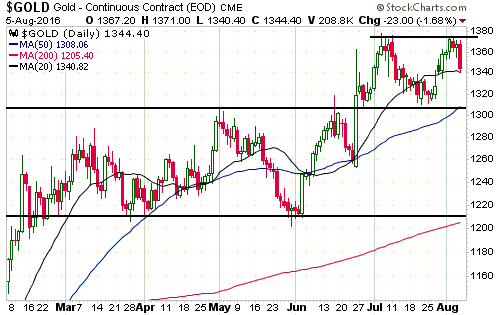
The Price Action
The US$ gold price tested its early-July peak
during the first half of last week and then dropped back to its 20-day MA on
Friday. Friday's price action hasn't significantly altered the chart pattern and
makes a near-term rise to around $1400 only slightly less probable.
Trend-defining support remains at $1308. A daily close below this support would
make it very likely that a multi-month top was in place and suggest a short-term
target in the low-$1200s.
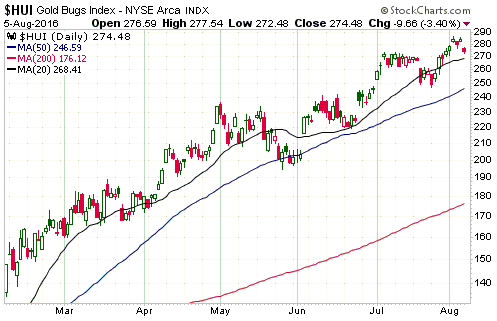
Gold Stocks
Last Friday's 10-point decline in the HUI
doesn't look significant on the following chart, although it could obviously
turn out to be the start of a meaningful decline. Some additional weakness over
the next two trading days would raise the probability that the incredible rally
from the January-2016 bottom was finally over, but in the absence of immediate
follow-through to the downside the potential for a near-term surge to around 300
will remain intact.
Trend-defining support for the HUI lies at 235-240,
so it will take a solid break below this support to confirm a multi-month top.
However, it would now be reasonable to use a daily close below the July low of
247 as an early warning of a trend change from up to down.
Below is our updated comparison between this year's rally in the HUI and the
1982-1983 rally in the Barrons Gold Mining Index (BGMI). If the HUI continues to
keep pace with the 82-83 rally then it will surge to around 300 this week and
then enter a prolonged decline with an initial low during the second half of
October.
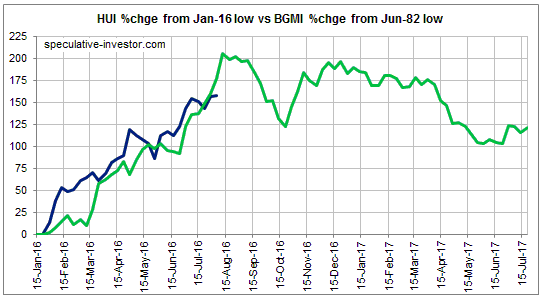
As previously advised, from a fundamental-analysis perspective we don't like
the comparison with the 1982-1983 rally. This is because the current economic,
monetary and financial-market environments have almost nothing in common with
the early-1980s. However, there is no other gold-mining rally from a multi-year
low that does such a good job of matching this year's price action.
We
will continue to view the 1982-1983 price action as a potential roadmap until
there is evidence that today's market is taking a different route.
The Currency Market
The Pound
Last Thursday, Bank of England (BOE) chief Mark Carney channeled his ECB
counterpart Mario Draghi SCBE (Stupidest Central Banker Ever). About 4 years ago
Draghi famously said that the ECB would "do whatever it takes" to maintain
Europe's monetary union. Last week Carney said "the BOE stands ready to take
whatever action is needed". Of course, neither Draghi nor Carney has any clue
about what's actually needed. All they ever do in response to signs of economic
weakness is cut interest rates and monetise bonds, as if any economy could ever
really be helped by distorting price signals.
True to form, the BOE
reacted to the short-term economic weakness and uncertainty stemming from
"Brexit" by cutting its targeted interest rate from 0.25% to 0.50%, announcing a
plan to monetise 70B pounds worth of bonds (government and corporate), and
offering the banking industry 100B pounds of low-interest credit. Additionally,
Carney made it clear that more would be done if deemed necessary by the monetary
machinators. In other words, the beatings will continue until morale improves!
The BOE actions/plans announced last Thursday were apparently a little more
than 'the market' was bargaining on, because the news was followed by a sharp
decline in the Pound. However, further to the comment we made in last week's
Interim Update it is still possible that the Pound is tracing out a basing
pattern.
It is also possible that the Pound is consolidating prior to
making a move to new multi-year lows. It needs to break above 134 to confirm the
basing-pattern scenario.
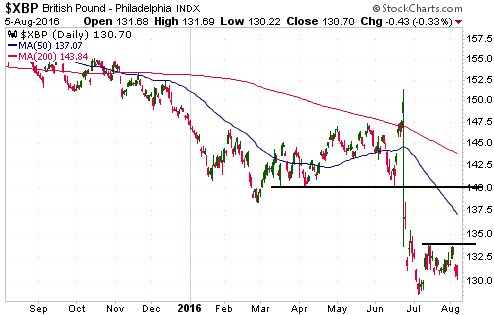
We are in the process of building up long-term exposure to the Pound, meaning
that we are looking for opportunities to convert part of our US$ cash reserve
into Pounds. We took an initial position in the Pound shortly after the Brexit
news in late-June and added to the position last Friday.
We currently
plan to hold the position for at least a couple of years and to add during times
of weakness in GBP/USD over the next several months.
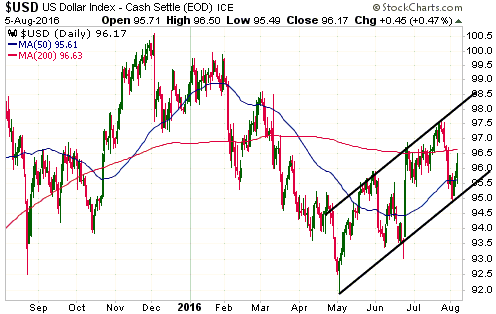
The Dollar Index
The Dollar Index
reached its short-term channel bottom during the first half of last week and
then rebounded.
The price action contains no clues about what the near
future holds in store, but the fundamentals are still bullish for the US$
relative to the euro (USD/EUR is almost 60% of the Dollar Index). We therefore
continue to expect an eventual break in the Dollar Index to new multi-year
highs, although we won't be surprised if support at 93 is re-tested as part of
the on-going intermediate-term consolidation.
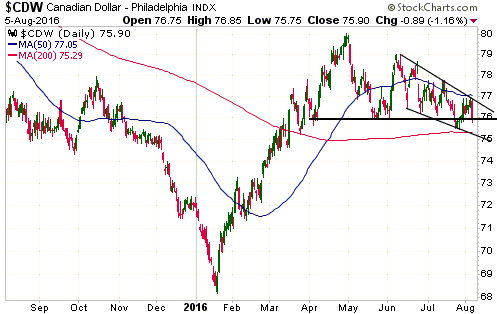
The Canadian Dollar (C$)
Last week the
C$ failed to follow through on the preceding week's bullish reversal. It is
again testing support at 76 and is at risk of breaking out to the downside. A
downside breakout would create a measured objective of 72, although there is
some support near 75 that could limit the decline.
A close above 78 is
needed to confirm a bottom.
Updates
on Stock Selections
Notes: 1) To review the complete list of current TSI stock selections, logon at
http://www.speculative-investor.com/new/market_logon.asp
and then click on "Stock Selections" in the menu. When at the Stock
Selections page, click on a stock's symbol to bring-up an archive of
our comments on the stock in question. 2) The Small Stock Watch List is
located at http://www.speculative-investor.com/new/smallstockwatch.html
 Company
news/developments for the week ending Friday 5th August 2016:
Company
news/developments for the week ending Friday 5th August 2016:
[Note: AISC = All-In Sustaining Cost, FS = Feasibility Study, FY = Financial
Year, IRR = Internal Rate of Return, MD&A = Management Discussion and Analysis,
M&I = Measured and Indicated, NAV = Net Asset Value, NPV(X%) = Net Present Value
using a discount rate of X%, P&P = Proven and Probable, PEA = Preliminary
Economic Assessment, PFS = Pre-Feasibility Study]
*Energy
Fuels (EFR.TO, UUUU) had three pieces of significant news last week.
The first piece of news relates to EFR's agreement in March to buy Mestena
Uranium LLC, a privately held uranium miner that operated the Alta Mesa ISR (In
Situ Recovery) project in Texas. The purchase price was 4.5M EFR shares. Alta
Mesa is a fully-permitted production facility capable of producing 1.5M pounds
of uranium per year that is on standby pending a higher uranium price.
Although Alta Mesa was in production for 8 years before being put on standby in
2013, prior to last week the project didn't have a resource estimate. The maiden
resource estimate has just been reported by EFR.
The NI-43-101resource
estimate is: 3.6M pounds of U3O8 in the M&I category plus 16.8M pounds of U3O8
in the Inferred category. In other words, about 20M pounds in total. This is a
very significant quantity and makes the Mestena acquisition look even better
than it did in March.
With its White Mesa mill, its Nichols Ranch ISR
project and the Alta Mesa project, EFR will have the ability to ramp up uranium
production to as much as 11.5M-pounds/year once the uranium price moves high
enough. It is therefore positioned to be one of the 'go to' uranium stocks
during the next multi-year upward trend in the uranium price. Unfortunately,
there is no evidence yet that the next multi-year upward trend in the uranium
price has begun.
Second, EFR announced that it has agreed with the
holders of $22M of convertible debt to extend the maturity date of the debt from
30 June 2017 to 31 December 2020 and to reduce the conversion price of the debt
from C$15.00 to C$4.15. This news is positive, because it gives EFR more
financial breathing room.
Third, EFR published its quarterly and
half-year financial results. The company's balance sheet remains in reasonable
shape, although despite some cash generation resulting from uranium
production/sales there was a US$11M reduction in working capital during the
first half of the year. This was due to investment in plant/equipment and a
decline in the market value of the company's uranium inventory (the uranium
price fell from around $35/pound to around $26/pound during the first 6 months
of this year).
At this time it is reasonable to have a small position in
EFR with the aim of adding to the position following evidence of a uranium
turnaround.
*Premier Gold (PG.TO) announced the
details of the package put in place to finance the US$122M cash component of the
Mercedes gold mine purchase announced the previous week.
The financing
package is being provided by Orion Mine Finance and comprises 1) a loan in the
amount of US$42.2M that will be repaid via the delivery of 2,450 ounces of gold
per quarter for 15 quarters plus an interest rate of 6.5%, 2) a silver stream
with an up-front payment of US$11.5M, 3) an unsecured credit facility in the
amount of US$45M, of which $40M remains to be drawn, and 4) new shares in the
amount of US$35M.
The press release that provided the details of the
financing included the following comment: "This financing arrangement was
constructed with a view toward minimizing near-term shareholder dilution."
This comment relates to the fact that only $35M of the $122M package
involved the issuing of new shares, but by entering into a gold loan and a
silver stream the company avoided diluting the stock by diluting the asset. What
we mean is that more than 10% of the production has just been lost to loan
repayments and "streams". Furthermore, the gold loan creates a significant risk.
First, the repayment amounts are reasonable with gold at $1350/oz, but if the
gold price rises to $2000/oz within the next couple of years then the cost of
the loan becomes exorbitant. Second, if the mine were to stop production for any
reason during the next four years then the company would have to buy gold on the
market to meet its quarterly repayment obligation.
In general, the ONLY
time it makes sense for a gold-mining company to enter into a gold stream or
take out a gold loan is when the shares are dirt cheap (meaning: issuing new
shares is costly to existing shareholders) and the balance sheet is not strong
enough to take-on normal unsecured debt. This is not the case with PG.
So, all things considered we would prefer that PG had done a larger equity
financing instead of the gold loan and silver stream. However, at this time the
news does not significantly weaken the case for owning PG.
*Ramelius
Resources (RMS.AX) announced two minor financial deals last week.
First, RMS announced that it has sold its Burbanks processing facility,
which has been on care-and-maintenance since the Wattle Dam gold mine became
depleted in 2014, for A$2.5M in staged payments over 24 months. This is a little
disappointing as we expected that RMS would be able to make good use of this
facility at some point in the future, but the company's management has obviously
decided to direct all of its attention to the Mt Magnet operation.
Second, RMS has sold the mining leases associated with its Kathleen Valley gold
project to Liontown Resources (LTR.AX) for 25M LTR shares (current market value:
about A$500K). LTR will explore the acquired mining leases for lithium and other
rare metals while RMS will retain all gold-related rights and uninhibited access
to conduct its gold mining.
*Taseko Mines (TGB)
has received from the Arizona Department of Environmental Quality (ADEQ) the
permit to construct and operate a production test facility at its Florence
copper project. If all goes well, the test facility will confirm the viability
of this project.
The plan is for the
Florence project to be developed
into an in-situ recovery (ISR) operation. This is a method of mineral extraction
that has a very small environmental footprint and is therefore generally easier
to permit than either an open-pit or an underground mine. It is common for
uranium, but rarely used for copper.
There is apparently one more permit
to be obtained before TGB can start building the test facility. This final
permit is expected to be granted in the near future.
*UEX
Corp. (UEX.TO) published its quarterly reports for the June quarter.
The reports show that UEX had about C$9M of working capital at 30th June, which
should be enough to fund the company's uranium exploration business for the next
12 months.
Updates
to
Small Stocks Watch List (SSWL) and "special situations"
The SSWL contains stocks that are too small and/or too illiquid to be
included in the TSI Stocks List, but appear to have substantial upside
potential. Although we don't follow these stocks closely via the TSI
commentaries, they could be of interest to risk-tolerant speculators capable of
doing their own company research.
Here are brief updates on three members
of the SSWL and one other "special situation" that was mentioned in a recent TSI
commentary.
Since being added to the SSWL about two months ago, junior
gold miners Emmerson Resources (ERM.AX) and Sarama Resources (SWA.V) have both
gained almost 200%. Over the same period the HUI is up by around 25%. Both ERM
and SWA are involved in joint ventures with mid-tier gold-mining companies and
will eventually, in our opinion, be purchased by their JV partners. We
anticipate large additional price gains, but the short-term risk of new buying
is now considerably higher by virtue of the recent stock-price gains.
A
sector-wide correction over the next couple of months could create new
opportunities to buy ERM and SWA.
A1 Consolidated Gold (AYC.AX) and
Carpathian Gold (CPN.CN) have not fared so well. Since being mentioned at TSI a
few weeks ago and in AYC's case added to the SSWL, these stocks have dropped a
little.
For AYC, the source of the downward pressure is a rights issue to
address a cash shortage. The rights issue is on-going and therefore likely to
keep a lid on the stock price for a while longer, but this could be viewed as an
opportunity for risk-tolerant speculators to pick away at the stock at a price
(A$0.027-A$0.03) that could eventually prove to be extremely low.
For
CPN, the lacklustre performance could be due to an absence of news/promotion and
the fact that it trades on the CSE (Canadian
Securities Exchange), a junior exchange that might not be accessible to
accounts outside Canada. CPN also trades in the US OTC market under the symbol
CPNFF, but a lot of traders (including us) will avoid this market due to its
wide buy-sell spreads and market-maker manipulation.
We think the keys to
better performance by CPN are news flow, stock promotion (getting the story
known), and getting the stock onto either the TSX or the TSXV. The underlying
asset (the Rovina Valley gold project in Romania) is superior to many
gold-mining assets that are currently being given much higher valuations.
Chart Sources
Charts appearing in today's commentary
are courtesy of:
http://stockcharts.com/index.html
http://www.barchart.com/
http://research.stlouisfed.org/
