|
-- Weekly Market Update for the Week Commencing 8th December 2003
Big Picture
View
Here is a summary of our big picture
view of the markets. Note that our short-term views may differ from our
big picture view.
Bond yields (long-term interest
rates) reached a major low in June of 2003 and will trend higher until
at least mid 2004.
The US stock market will reach
a major bottom (well below the October-2002 low) during 2004.
The Dollar commenced a bear
market in July 2001 and will continue its decline during 2003 and 2004.
A bull market in gold stocks
commenced in November 2000 and will continue during 2003 and 2004.
Commodity prices, as represented
by the CRB Index, will rally during 2003 and 2004 with most of the upside
occurring in 2004.
Copyright
Reminder
The commentaries that appear at TSI
may not be distributed, in full or in part, without our written permission.
In particular, please note that the posting of extracts from TSI commentaries
at other web sites or providing links to TSI commentaries at other web
sites (for example, at discussion boards) without our written permission
is prohibited.
We reserve the right to immediately
terminate the subscription of any TSI subscriber who distributes the TSI
commentaries without our written permission.
Gold versus
Commodities
The below chart compares the gold price,
since 1970, with the ratio of the gold price and the CRB Index. Interestingly,
the two chart patterns are almost identical over this 34-year period. (Thanks
to Nick Laird at www.sharelynx.com for supplying some of the data used
to create this chart.)
The implication of the above chart
is that when gold is in a long-term up-trend it not only rises against
the US$ (and other fiat currencies), it also rises against most commodities.
Similarly, when gold is in a long-term downtrend it not only falls against
the US$ it also falls against commodities. In other words, if we are right
that the US$ gold price is in a long-term upward trend then over the remainder
of this decade we should expect that the gold price will continue to trend
higher relative to the CRB Index. There will probably be some individual
commodities that do better than gold over the next five years and there
will no doubt be periods during which the CRB Index will out-perform the
gold price, but long-term investors looking for a relatively low-risk way
of participating in the emerging bull market in commodities should just
buy gold.
The US
Stock Market
Current Market Situation
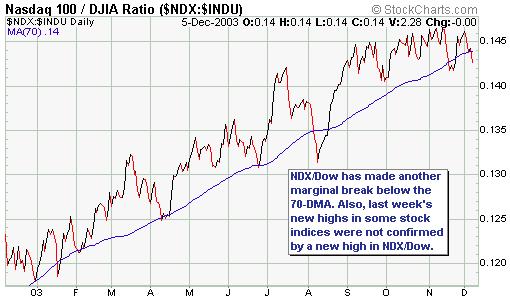
The evidence continues to build that
the US stock market is within 4-6 weeks of making an important peak. For
example, the NDX/Dow ratio -- a measure of the level of risk aversion in
the market -- has just edged below its 70-day moving average for the second
time in the space of a month (see chart below). And perhaps of even greater
significance, the new recovery highs in the Dow Industrials Index and the
S&P500 Index that occurred last week were not confirmed by new highs
in the NDX/Dow ratio.
Our expectation has been that the NDX/Dow
ratio would turn down prior to a major peak in the market, so while the
recent weakness in this ratio is not exactly decisive it is consistent
with our view that January-2004 is a likely time for a major peak.
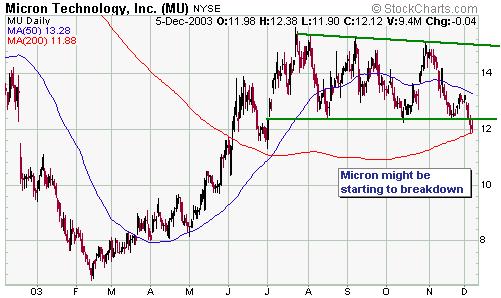
Another sign that market participants
might be starting to become a little more circumspect (a little less willing
to ignore valuation risk) is the recent weakness in the Micron Technology
(NYSE: MU) stock price. Micron is a perennial money loser, but facts such
as this tend to be conveniently ignored as long as a general trend towards
more risky investments remains in force.
The below chart shows that MU has just
dropped below the bottom of the range in which it has moved over the past
5 months, although all is not lost for the Micron bulls because the stock
has, to date, managed to hold above its 200-day moving average.
From a US-centric perspective the US
stock market has had a very good year, but from the perspective of a European
investor the US market's performance has been unimpressive. In fact, when
measured in terms of the euro the S&P500 is currently about the same
as it was during the first week of January. Furthermore, the S&P500
in terms of the euro is yet to make a higher high on an intermediate-term
basis (the below chart shows that S&P500/euro has made a sequence of
lower highs since August 2002).
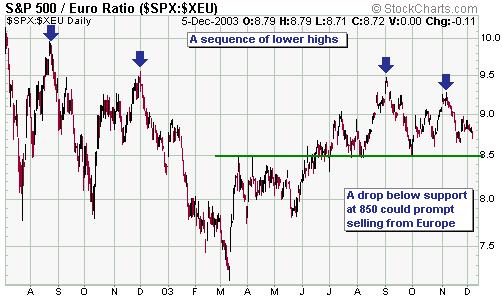
Critical support for the S&P500
in terms of the euro exists at 850 and a decisive move below this support
could prompt Europeans to exit the US market en masse. At the current exchange
rate, 850 for the S&P500/euro ratio corresponds to 1033 for the nominal
S&P500 Index.
There's another Federal Open Market
Committee (FOMC) Meeting this Tuesday and it will be interesting to see
if there is any significant change in the wording of the monetary policy
statement. Unless we've under-estimated the incompetence of the Committee
members the announcement should be worded in such a way as to indicate
that the risks of rising inflation and falling inflation are now in balance.
If this turns out to be the case then the FOMC Meeting probably won't have
much influence on the markets apart from causing a temporary increase in
volatility. If, however, Tuesday's monetary policy statement still contains
the ridiculous assertion from previous statements that "the risk of inflation
becoming undesirably low remains the predominant concern for the foreseeable
future" then the US$ will probably accelerate lower. And this would no
doubt generate some negativity in the stock market.
This week's important economic events
| Date |
Description |
| Monday Dec 08 |
No significant events |
| Tuesday Dec 09 |
FOMC Meeting |
| Wednesday Dec 10 |
No significant events |
| Thursday Dec 11 |
Retail Sales
Import / Export Prices |
| Friday Dec 12 |
Trade Balance
PPI |
Gold and
the Dollar
Gold and Currencies - contemplating
some possibilities
At the end of last week the December
Swiss Franc closed at 78.42 (versus our upside target range of 78-80),
the December euro closed at 121.63 (versus our target of 122), the cash
Dollar Index closed at 89.15 (versus our target of 89), and February gold
closed at $407.30 (versus our short-term target range of $410-$420). So,
if our targets are roughly 'on the mark' then the US$ is within 1% of a
short-term bottom and gold is within 3% of a short-term top.
As discussed in last week's Interim
Update, we expect a 1-2 month rally in the US$ to soon begin from near
the current level. This rally would likely be shallow and, we think, coincide
with a final surge in the US stock market and some consolidation in the
gold market.
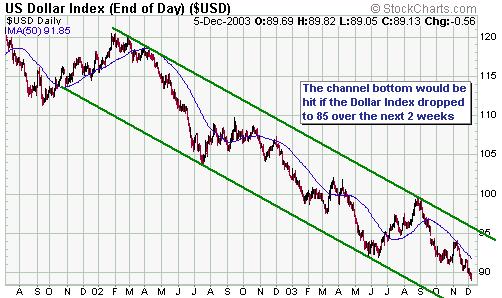
An alternative worth considering, though,
is that the currency and gold markets are going to overshoot our targets
over the next 2-3 weeks. For instance, our target of 89 for the Dollar
Index was arrived at by assuming that the Dollar would find support at
the bottom of the downward-sloping price channel that began to form in
October of 2000. However, in previous commentaries we've also mentioned
the possibility that the steeper downward-sloping channel that began towards
the end of 2001 (this channel is shown on the below chart) would remain
in force. In this were the case then the Dollar Index would need to fall
to around 85 before year-end in order to reach the channel bottom.
A drop of that magnitude in the US$
would probably light a fire under a gold price that has been consolidating
nicely in the low-$400 area, resulting in our longer-term target of $460
being achieved within the next 2 weeks.
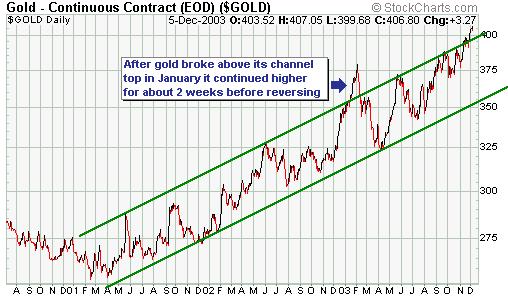
The below chart shows the channel in
which the gold price has been moving since the final quarter of 2000. Notice
that prior to last week the only move outside this channel occurred in
January of this year and that after breaking above the channel top in January
the gold price continued higher for about 2 weeks before reversing course.
With gold having just broken above its channel top for only the second
time in more than three years something similar could be on the cards,
perhaps in response to an overshoot to the downside (as far as our short-term
targets are concerned) by the US$.
If the above-described alternative
scenario plays out then the resultant extremes (a bottom for the dollar
and a peak for the gold price) would probably be followed by much larger
and longer counter-trend moves than we are currently anticipating. In particular,
we've long expected that a drop in the Dollar Index to near the major support
that exists in the low-80s would complete the first phase
of the Dollar's bear market and be followed by a rebound (or stabilisation)
lasting 1-2 years.
One problem with the idea that a downward
spike in the Dollar over the next few weeks could create a bottom that
holds for 1-2 years is that it doesn't mesh with what we see happening
in the US economy and stock market over the next 6 months. Specifically,
the evidence is steadily building that we are going to get a major peak
in the stock market during the early part of next year and that the US
economic recovery will run out of steam by the end of next year's first
quarter. This, in turn, would make it unlikely that the US$ could experience
anything more significant than an 'oversold bounce' over the next few months.
It is, of course, possible that the
Dollar Index will fall to 85 over the next 2-3 weeks, then rebound for
1-2 months, and then collapse anew to well below the long-term support
that exists in the low-80s. However, considering the enormous amount of
central bank intervention that would no doubt occur if the US currency
threatened to break below long-term support, such a dire short-term outcome
for the Dollar looks unlikely.
It is also possible that we are under-estimating
the underlying strength of the US economy and/or the ability of the US
financial establishment to create enough liquidity to keep stock prices
elevated for many more months. If this were the case then a 1-2 year period
of US$ strength or stability would not be out of the question. However,
this appears to be even less likely than the Dollar collapsing below major
support in the face of massive and coordinated central bank intervention.
Hopefully, the above discussion hasn't
created too much confusion. In our opinion the odds continue to favour
a short-term bottom for the US$ occurring near its current level, but the
probability of a near-term overshoot is high enough to warrant a mention.
If we do get such an overshoot we'll deal with the implications in more
detail and, if necessary, revise our forecasts for the first half of next
year.
We are presently short-term neutral
on the US$ and will turn short-term bullish (whilst remaining long-term
bearish) following a daily close in the cash Dollar Index above its 50-day
moving average.
The A$ versus the euro
Over the past several years the Australian
Dollar has tended to dramatically out-perform the euro during those periods
when global stock markets were rallying and dramatically under-perform
during stock market declines, most likely because the A$ is a 'growth'
currency whereas the euro is a 'safety' currency. Therefore, once the US
stock market begins heading lower in earnest we should expect the euro
to start out-performing the A$, although if we are right about the stock
market not peaking until January then the A$ could remain strong, relative
to the euro, for another 1-2 months.
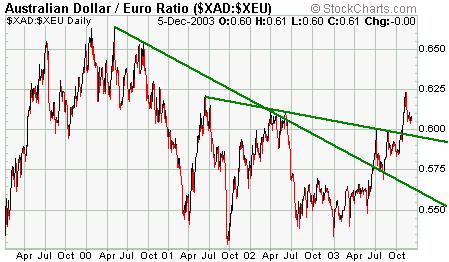
The A$ might be headed for a period
of weakness relative to the euro during the first half of next year, but
the longer-term downward trend in A$/euro has been broken (see chart below).
In fact, A$/euro bottomed with commodity prices back in September-October
of 2001 and has since been working its way higher. Therefore, if we are
right about the bull market in commodities then A$/euro should make a sequence
of higher highs and higher lows over the remainder of this decade.
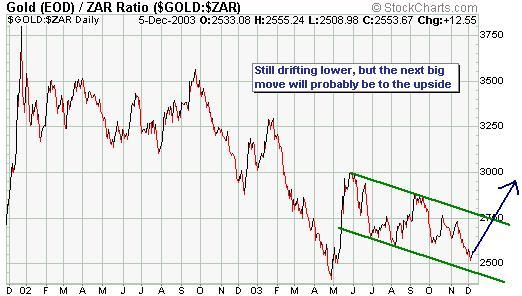
Gold in terms of the SA Rand
The South African Rand is continuing
to make new multi-year highs against the US$ on almost a daily basis and
this Rand strength is causing the Rand gold price to drift lower. However,
whereas the Rand is making new highs against the Dollar the Rand gold price
is still comfortably above the low reached in April of this year (see chart
below). In fact, the relentless slide in the Rand gold price over the past
6 months looks more like a consolidation within a new intermediate-term
upward trend than a continuation of the previous downward trend.
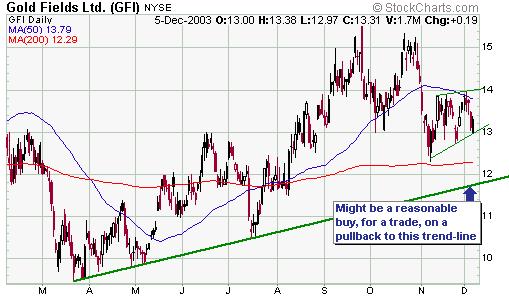
If there is a general pullback in the
gold sector over the next 2-3 weeks (as per our current short-term forecast)
then we will consider adding another SA gold stock -- either Gold Fields
(NYSE: GFI) or Harmony Gold (NYSE: HMY) -- to the Stocks List.
Silver
When silver broke out of the contracting
triangle shown on the below chart it created an upside target of around
$5.80. This chart-based projection also happens to correspond with long-term
resistance, so $5.80 was (and remains) our upside target for silver. We
should, however, allow for an overshoot to around $6.20. This is because
if the gold/silver ratio remains at its current level of 74 then our target
of $460 for the gold price -- a target that should be reached within 6
months and could be reached as early as this month -- implies a silver
price of $6.20.
Update
on Stock Selections
 A
decision to sell a good stock in reaction to bad news when that news has
no significant bearing on the company's longer-term fundamentals might
look right in the immediate-term but often won't look right several weeks
later. Such has been the case with Aquiline Resource (TSXV: AQI) over the
recent past. A
decision to sell a good stock in reaction to bad news when that news has
no significant bearing on the company's longer-term fundamentals might
look right in the immediate-term but often won't look right several weeks
later. Such has been the case with Aquiline Resource (TSXV: AQI) over the
recent past.
The AQI stock price dropped from the
C$0.90-C$1.00 range to around C$0.70 in response to a legal threat from
IMA Explorations (TSXV: IMR). Our view was that this drop represented a
buying opportunity because there didn't appear to be any downside to AQI
as a direct result of the dispute with IMR (the only real threat appeared
to be that AQI's management would be forced to devote resources to a lawsuit).
As it turned out, buying AQI following the legal-threat-inspired sell-off
would have worked out quite well as the stock-price has gained 50% over
the past 4 weeks.
Is AQI still a buy at Friday's closing
price of C$1.18? Well, we expect the AQI stock price to continue trending
higher, but the real question is; if you decided NOT to buy last month
in the 0.70-0.80 range why would you buy now? The only difference between
now and then is that the stock price is now 50% higher.
In a bull market one of the most reliable
strategies is to buy good stocks following sharp pullbacks.
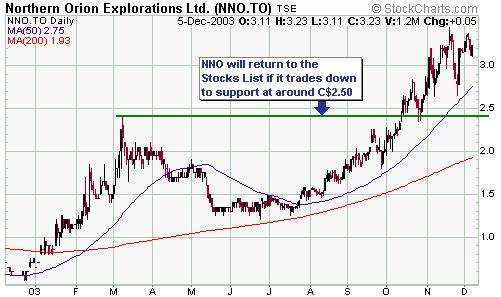
We
removed Northern Orion (TSX: NNO) from the Stocks List a couple of weeks
ago when it traded up to C$3.40. We will return this stock to the List
if it trades down to intermediate-term support at around C$2.50 before
year-end. Note that the aforementioned price is not a forecast, it's just
a price we would be happy to pay if the opportunity presented itself.
Now
is not a good time to be buying gold stocks for anyone who already has
substantial exposure to the gold sector because the valuation risk is greater
than it has been at any time since May of 2002. This valuation risk applies
mainly to the large and mid-tier North American gold stocks, many of which
are priced as if gold were already trading north of $500, and anyone with
a lot of money invested in these stocks should probably be scaling out
now.
As far as our favourite junior gold
stocks are concerned, now is a good time to 'sit tight'. These stocks would
suffer from a downturn in the market (a downward reversal in leading stocks
such as Newmont and Goldcorp would be likely to affect the entire sector),
but in many cases are still under-valued relative to the current
gold price and have huge upside potential. This large upside potential,
relative to the general market risk, means that these stocks remain attractive
from a risk-versus-reward perspective.
The junior stocks are, of course, very
volatile, and many people start to fret when the price of a stock they
own suddenly drops by 10%-20% (daily moves of 10%-20% in either direction
are not uncommon for the junior gold stocks). However, the effect on your
portfolio of a sharp move in any individual stock can be dampened by making
sure that a) your exposure to the juniors is spread over at least 7-10
stocks, and b) you always have a substantial cash reserve.
Despite the general market risk, for
those that have almost no exposure to the gold sector some buying
is warranted at this time and this buying should be focused on the under-valued
juniors. Here are a few ideas for those looking to start a gold stock portfolio:
- Exeter Resource (TSXV: XRC)
at around C$1.00
- Cumberland Resources (TSX:
CBD) at around C$4.50
- Northgate Exploration (AMEX:
NXG) at around US$2.00
- NovaGold Resource (AMEX:
NG) at around US$4.80
- NovaGold warrants (TSX: NG.WT)
at around C$2.50
- Patricia Mining (TSXV: PAT)
at around C$0.80
- Northern Orion (TSX: NNO)
at around C$2.50
- Metallica Resources (AMEX:
MRB) at around US$1.50
- Canarc Resource (TSX: CCM)
at around C$1.00
Chart Sources
Charts appearing in today's commentary
are courtesy of:
http://stockcharts.com/index.html
http://www.futuresource.com/

|
