|
-- Weekly Market Update for the Week Commencing 8th December 2008
Big Picture
View
Here is a summary of our big picture
view of the markets. Note that our short-term views may differ from our
big picture view.
Bonds commenced a secular BEAR market in
June of 2003. (Last
update: 22 August 2005)
The stock market, as represented by the S&P500 Index, commenced
a secular BEAR market during the first quarter of 2000, where "secular
bear market" is defined as a long-term downward trend in valuations
(P/E ratios, etc.) and gold-denominated prices. This secular trend will bottom sometime between 2014 and 2020. (Last update: 22 October 2007)
The Dollar commenced a secular BEAR market during the final quarter of 2000. The
first major downward leg in this bear market ended during the first
quarter of 2005, but a long-term bottom won't occur until 2008-2010. (Last update: 28 March 2005)
Gold commenced a
secular bull market relative to all fiat currencies, the CRB Index,
bonds and most stock market indices during 1999-2001. This secular trend will peak sometime between 2014 and 2020. (Last update: 22 October 2007)
Commodities, as
represented
by the CRB Index, commenced a secular BULL market in 2001. The first
major upward leg in this bull market ended during the first half of 2008, but a long-term
peak won't occur until 2014-2020. (Last update: 03 November 2008)
Copyright
Reminder
The commentaries that appear at TSI
may not be distributed, in full or in part, without our written permission.
In particular, please note that the posting of extracts from TSI commentaries
at other web sites or providing links to TSI commentaries at other web
sites (for example, at discussion boards) without our written permission
is prohibited.
We reserve the right to immediately
terminate the subscription of any TSI subscriber who distributes the TSI
commentaries without our written permission.
Outlook Summary
Market
|
Short-Term
(0-3 month)
|
Intermediate-Term
(3-12 month)
|
Long-Term
(1-5 Year)
|
Gold
|
Bullish
(30-Jun-08)
|
Bullish
(12-May-08)
|
Bullish
|
US$ (Dollar Index)
|
Bearish
(17-Nov-08)
| Bearish
(24-Nov-08)
|
Neutral
(19-Sep-07)
|
Bonds (US T-Bond)
|
Bearish
(21-Nov-08)
|
Bearish
(22-Sep-08)
|
Bearish
|
Stock Market (S&P500)
|
Bullish
(16-Oct-08)
|
Bullish
(08-Oct-08)
|
Bearish
|
Gold Stocks (HUI)
|
Bullish
(30-Jun-08)
|
Bullish
(12-May-08)
|
Bullish
|
| Oil | Bullish
(17-Nov-08)
| Neutral
(22-Sep-08)
| Bullish
|
Industrial Metals (GYX)
| Bullish
(26-Nov-08)
| Neutral
(22-Sep-08)
| Bullish
|
Notes:
1. In those cases where we have been able to identify the commentary in
which the most recent outlook change occurred we've put the date of the
commentary below the current outlook.
2. "Neutral", in the above table, means that we either don't have a
firm opinion or that we think risk and reward are roughly in balance with respect to the timeframe in question.
3. Long-term views are determined almost completely by fundamentals,
intermediate-term views by giving an approximately equal weighting to
fundmental and technical factors, and short-term views almost
completely by technicals.
Gold and the Money Supply
Assuming
that 0.20 approximates 'fair value' for the gold/TMS ratio under normal
circumstances we arrive at a current inflation-adjusted fair value for
gold of around US$1,100/ounce. ...speculators purchase gold in
anticipation of the increased rate of currency depreciation and other
problems that will eventually stem from a higher rate of monetary
inflation, or sell gold in anticipation of the reduced rate of currency
depreciation that will eventually stem from a lower rate of monetary
inflation.
The following discussion mostly covers old ground, but the relationship
between gold and the money supply has important investment implications
and therefore warrants some repetitive treatment.
An inflation-adjusted 'fair value' for gold of several thousand dollars
per ounce could be arrived at by taking the January-1980 high in the
gold price as the starting point and then accounting for the amount of
money-supply growth that subsequently occurred. However, gold was
extremely over-valued at its 1980 peak, so it makes no sense to use
this price level as the starting point for such an analysis. For this
reason, the author of a recent "Seeking Alpha" article
used January-1971 as the starting point. But this also makes no sense
because gold was at least as under-valued in 1971 as it was over-valued
in 1980. In January of 1971 the gold price had been fixed at $35/oz for
about 37 years, a period during which the money supply expanded year
after year after year. The bottom line is that by taking January-1980
as the starting point we end up with a ridiculously high
inflation-adjusted 'fair value' for gold, whereas by taking
January-1971 as the starting point we end up with a ridiculously low
number.
The impossibility of determining a point in the historical record when
gold was fairly valued is one reason we don't like the whole concept of
using changes in the dollar supply to calculate the US$ price at which
gold would be fairly valued today. Some analysts have gone to great
lengths to do such calculations of gold's so-called fair value, but
their calculations are invariably based on a number of arguable
assumptions and a small change in any single assumption potentially
leads to a large change in the end result. Another reason we don't like
the concept is that over a normal investment timeframe (2-10 years) the
rate of change in the supply of money is just one of several important
drivers of the gold price.
In any case, if we are going to determine an indicative
inflation-adjusted 'fair value' for gold we must use a sensible
starting point. And in our opinion a reasonable assumption is that gold
was close to being fairly valued at $35/ounce in the early-1940s. This
assumption is primarily based on James Turk's analysis of net gold
flows into the US. In a nutshell: the net flow of gold into the US
suggests that gold was over-valued at $35/ounce during the second half
of the 1930s and under-valued at $35/ounce from around the mid-1940s.
Keeping the above in mind, we'll now turn our attention to the
following chart of the gold/TMS ratio (the chart shows the US$ gold
price divided by the True Money Supply (TMS), with TMS expressed in
millions of US dollars).
We unfortunately don't have TMS data prior to 1959, but it is very
likely that TMS would have grown by at least 80% during the 15-year
period leading up to 1959 because an 80% increase over 15 years equates
to a compound annual growth rate of only 4%. We therefore assume that
the gold/TMS ratio was around 0.20 in the early 1940s.
Significantly, 0.20 appears to be a reasonable starting point, or 'fair
value', for the gold/TMS ratio for three other reasons. First, after
the official lid was removed from the gold price in 1971 the gold/TMS
ratio sprinted up to 0.20 before pausing for breath. Second, after the
1980 bursting of the gold bubble the gold price embarked on a steep
downward trend that ended with the gold/TMS ratio slightly above 0.20.
Third, ignoring the 1979-1980 upward spike and the dramatic
under-valuation of the 1960s we can see that the long-term average is
roughly 0.20.
Assuming that 0.20 approximates 'fair value' for the gold/TMS ratio
under normal circumstances we arrive at a current inflation-adjusted
fair value for gold of around US$1,100/ounce.
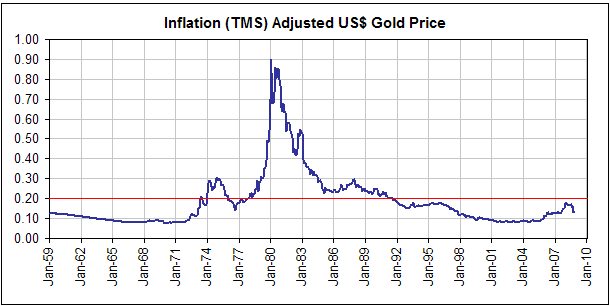
Long-term bull
markets never end until the price of the investment in question moves a
huge distance above its 'fair value' based on traditional valuation
metrics. For example, gold's previous long-term bull market didn't end
until gold was trading at 4-5 times its fair TMS-adjusted value. Our
expectation, therefore, is that the gold/TMS ratio will move well above
0.20 before the gold bull market ends.
Before leaving this topic we'd like to address the idea, expressed in
the above-linked "Seeking Alpha" article, that moves in the gold price
come before moves in the money supply.
The relationship between gold and the money-supply growth rate entails
such long and variable leads/lags that a purely chart-based analysis
could conclude that gold leads and the money supply follows. However,
the opposite conclusion could also be drawn from chart observation,
which is why logical deduction must, in this case, come before an
assessment of the empirical evidence. Here is the way it SHOULD work:
Some time after a new money-supply trend gets underway, gold
speculators begin to discount the future effects of this new monetary
situation on currency purchasing power. Specifically, speculators
purchase gold in anticipation of the increased rate of currency
depreciation and other problems that will eventually stem from a higher
rate of monetary inflation, or sell gold in anticipation of the reduced
rate of currency depreciation that will eventually stem from a lower
rate of monetary inflation.
Logic therefore tells us that long-term (multi-year) money-supply
trends should LEAD long-term gold trends. For their part, charts of the
year-over-year TMS growth rate and the gold price tell us that the
lead-time varies between 2 and 4 years. That is, the charts indicate
that 2-4 years after a major trend reversal in the YOY TMS growth rate
there will likely be a major trend reversal in the gold price in the
same direction. Due to the length and variability of this lead-lag
relationship, gold cannot be traded based on changes in money supply.
Taking this decade's events as an example, the money-supply trend
suggested that there would be an important peak in the gold price
between 2004 and 2006. The actual peak occurred in 2006. The
money-supply trend also suggested that there would be an important
bottom in the gold price somewhere between the 4th quarter of 2008 and
the 4th quarter of 2010 (2-4 years after the October-2006 bottom in the
TMS growth rate). Now, the gold price obviously moved well above its
2006 high during 2007 and ultimately reached an intermediate-term peak
in March of 2008, but gold's 2007-2008 surge to new highs was not
driven by money-supply changes. As we said earlier in this discussion,
the rate of change in the supply of money is just one of several
important drivers of the gold price.
Should counterfeiting be encouraged?
A
popular view is that an increase in the money supply would be
beneficial. If so, then counterfeiting should be encouraged. If the
economy would benefit from printing more money then expert
counterfeiters (those able to produce currency notes that are
indistinguishable from the 'real thing') would be performing a valuable
service.
But doesn't counterfeiting cause an undeserved transfer of wealth from
most people to the people who print the money? The answer is yes, but
that's no different to what happens when the central bank creates money
out of nothing.
And doesn't counterfeiting, if done on a large scale, distort price
signals and thus bring about a reduction in real savings? The answer is
yes, but again that's no different to what happens when the central
bank creates money out of nothing.
The point we are trying to make is that counterfeiting is unhelpful,
regardless of whether it is done legally by the banking system or
illegally by unregulated/unofficial operators. People often forget that
money is not wealth and that adding more money to the economy does not
add more real savings.
The problem is not now, and never will be, a shortage of money. One of
today's problems in the US, Australia, and several other Western
nations is a shortage of savings, and not only will increasing the
money supply not help the situation it will very likely make the
situation worse because it will lead to a further reduction in real
savings.
Increasing the money supply by creating new money 'out of thin air' is
always a bad idea, but it is currently a popular idea and is likely to
remain so. That's one reason why recession-like economic conditions are
likely to prevail for many years to come.
Commodities
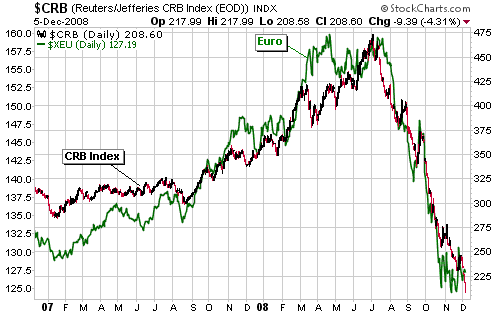
The Commodity-Currency Relationship
The following chart illustrates the strong positive correlation over
the past two years between the euro and the CRB Index, which naturally
translates into a strong inverse correlation between the US$ and the
CRB Index. The reason for including this chart in today's report,
however, isn't to show that the commodity and currency markets have
been 'joined at the hip'; rather, it's to show that the bottoming
process currently underway appears to be similar to the topping process
that occurred between April and July of this year.
Between April and July the euro traded sideways (it peaked in April and
then successfully tested its peak in July) while the CRB Index moved
steadily upward. Now we have the euro holding above its early October
low -- and essentially trading sideways -- while the CRB Index moves
steadily downward.
If the bottoming process lasts as long as the preceding topping process
then the CRB will bottom in January, after which both the CRB and the
euro will begin to trend strongly upward.
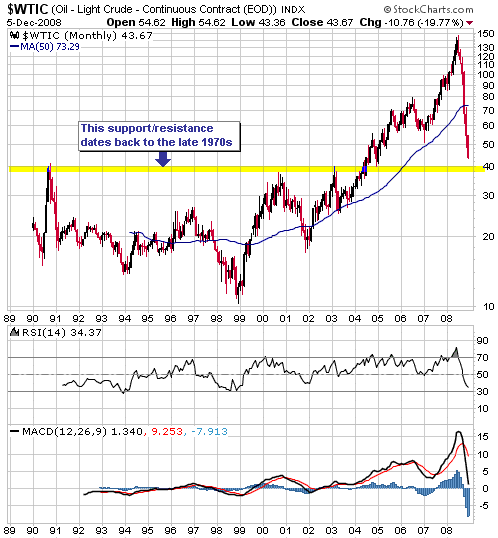
The following monthly chart shows that oil has long-term support at
$38-$40. After acting as resistance for about 25 years, this price area
was finally surmounted for good in 2004. At least, until recently it
appeared to have been surmounted for good.
Oil's decline from its July peak has been much larger and much steeper
than we expected, and we were expecting a large decline. It's a good
bet that oil will rebound strongly during the first half of next year,
but of some concern to us is that the July-December plunge could be
just the INITIAL downward leg of a cyclical bear market -- in wave
terms, the 'A' leg of an A-B-C correction -- and yet we are already
closing in on long-term support.
At the moment we are focused on the potential for a strong
counter-trend rebound over the coming 3-6 months. The closer that oil
gets to long-term support, the better the short- and intermediate-term
risk/reward will be.
The commodity, equity and currency markets are entwined at the moment
such that trend changes will happen together or not at all. We expect
strong rebounds in equities and commodities over the next few months in
parallel with a downward correction in the US$, but right now the
markets seem intent on prolonging the commodity/equity bottoming
process and the associated US$ topping process.
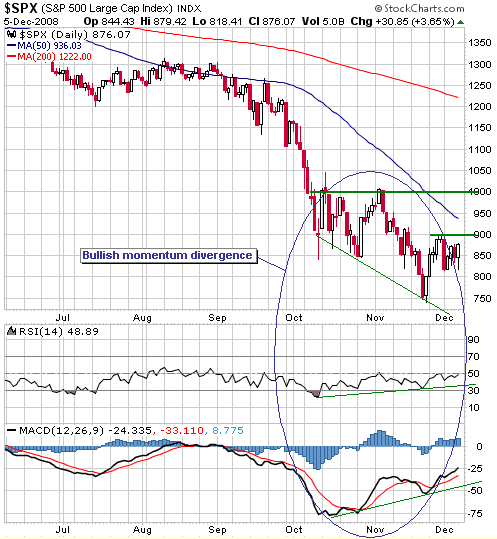
The Stock
Market
The stock market hasn't yet
shown much strength, but the bullish divergences continue to build. The
following daily chart of the S&P500 Index (SPX) highlights the
bullish momentum divergence that has developed since the 10th October
low.
The chart also shows near-term resistance at 900 and the more important
resistance that lies at 1000. A trend change from down to up won't be
confirmed until the higher of these resistance levels is overcome, and
this is not likely to happen until early next year. A daily close above
the lower resistance level would, however, be a warning that a trend
reversal was in the works.
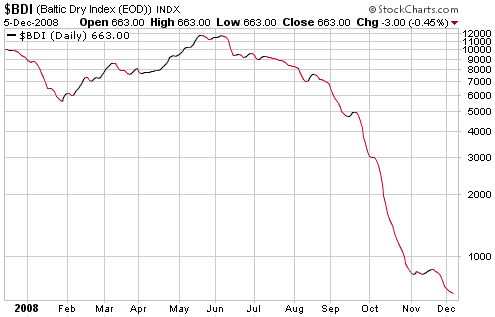
One thing that hasn't
yet happened, but should happen within a few weeks of the stock market
reversing upward 'for real', is an upward trend reversal in the Baltic
Dry Index (BDI). As evidenced by the following chart, the BDI is not
yet showing any sign of strength.
Our view continues to
be that the coming multi-month stock market rally will be the
counter-trend variety (a rebound within an on-going bear market).
However, we won't be surprised if the November-2008 low proves to be
the market's ultimate price low in nominal dollar terms.
It should be clear to any objective observer that the Fed and its
central banking cohorts will, by hook or by crook, ensure that the
supply of money grows rapidly over the years ahead. This will
eventually cause money to become worth substantially less, which will,
in turn, support the money prices of equities. Therefore, while a lot
of additional weakness is likely in gold terms we might already have
seen the ultimate lows in nominal currency terms.
It is also worth noting that stock market valuations are now attractive
in the US, and especially outside the US. In fact, many stock markets
around the world are now at the sorts of valuation levels that are only
ever seen near the ends of major bear markets.
This week's
important US economic events
| Date |
Description |
Monday Dec 08
| No important events scheduled
| | Tuesday Dec 09 | Pending Home Sales
| | Wednesday Dec 10
| Treasury Budget
| | Thursday Dec 11
| Trade Balance
Import and Export Prices
| | Friday Dec 12
| PPI
Retail Sales
|
Gold and
the Dollar
Gold
The Physical Premium
Much has been written about the large premiums to the COMEX price being
paid in the retail gold/silver coin market in the US and a few other
countries. The popular conclusion is that the divergence of the
"physical" and futures markets indicates that the futures price is
being held at an artificially low level by unnatural forces. Several
points related to this issue are presented below.
First, it is not smart to pay a large premium for gold/silver coins,
or, for that matter, any investment. One way or another the premium
will disappear, so the people who pay today's large premiums for some
types of bullion coin are guaranteed to lose that premium. Rather than
paying the current high coin premiums, someone who wants to own more
gold coins would be smarter to immediately obtain the equivalent amount
of gold exposure in a way that does not entail paying a significant
premium, such as via a non-levered futures position or an ETF or
goldmoney.com or bullionvault.com, and to then switch to coins after
premiums have dropped to more normal levels.
Second, the retail coin market is NOT the physical market; it is a
small fraction of the physical market. About 20M ounces of physical
gold, or about 2-3 times the amount of gold represented by an average
day's trading volume on the COMEX, changes hands every day via the
London Bullion Market Association (LBMA), and it does so at close to
the COMEX price. In addition, more than 1M ounces of gold are imported
into India each month at close to the COMEX price, and a lot of gold
trading occurs in the Dubai market at close to the COMEX price. It is
reasonable to conclude, therefore, that the COMEX price accurately
reflects the overall supply/demand situation in the gold market.
Third, the fact that some members of the investing public are willing
to pay large premiums for bullion coins should NOT be construed
bullishly. As we've noted in the past, the existence of these premiums
is either meaningless or a bearish divergence. We think it is
meaningless because other sentiment indicators -- the COT data, for
instance -- show that sentiment in the gold market is constructive
(conducive to higher prices).
Fourth, the gold market SHOULD demonstrate different characteristics to
every other commodity market because gold is the ONLY monetary
commodity. (As part monetary commodity and part industrial commodity,
silver shares some of gold's characteristics and some of copper's
characteristics.) Gold's supply/demand picture is dominated by an
aboveground supply accumulated over centuries, which means that
traditional commodity analyses are totally inapplicable to gold.
Fifth, the gold market's perennial contango has shrunk to almost
nothing. For example, as at the close of trading on Friday the Dec-08
contract was priced at $750.50, the Feb-2009 contract was price at
$752.20, and the Apr-2009 contract was priced at $753.70. This reflects
some tightness in the market, but we don't know that it says anything
about gold's likely future price performance.
Sixth, gold has done what it should have done over the past several
months given the financial backdrop: it has rocketed upward relative to
all other commodities and most other investments.
Seventh, the reason to be bullish on gold right now is the only good
reason to ever be bullish on gold: the expectation of monetary
debasement and the loss of confidence in the official money that will
eventually stem from the debasement.
Current Market Situation
December gold broke below short-term support on Friday, potentially
setting the stage for a re-test of more important support in the low
$700s over the coming days.
The 16th December FOMC Meeting could turn out to be a big event for the
gold market because in addition to a reduction in the Fed Funds rate to
almost zero there's a decent chance that the outcome of this meeting
will include plans for a new inflation-promoting scheme (the
suppression of long-term interest rates via debt monetisation, for
example). We therefore suggest that traders take advantage of any
further weakness in the gold price over the coming days to get
positioned on the long side ahead of next week's meeting.
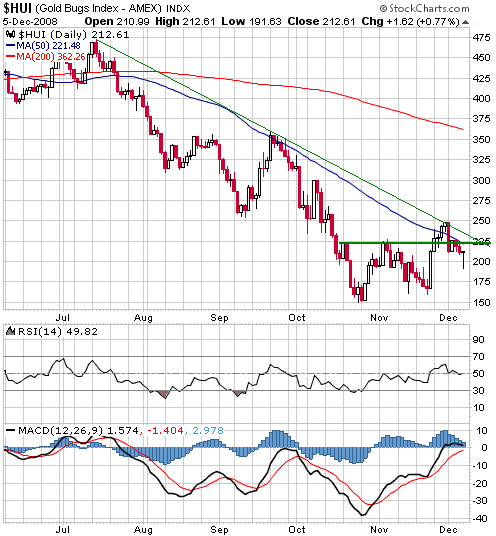
Gold Stocks
The first of the following daily charts shows that the HUI's lateral
resistance, 50-day moving average and downward-sloping trend-line from
its July peak are coming together at around 225. Friday's action was
bullish in that the HUI plunged 10% during the early going and then
recovered all its losses by day's end, but if gold re-tests support in
the low-$700s during the first half of this week then the HUI will
probably consolidate below 225 for a while longer before resuming its
advance.
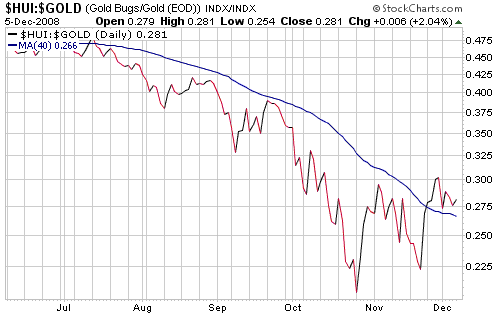
The next chart shows
that the HUI/gold ratio is currently doing what it should be doing:
holding above its 40-day moving average (the blue line on the chart)
during the current consolidation. As noted in last week's Interim
Update, if HUI/gold can continue to hold above its 40-day moving
average during this short-term consolidation and then move above its
late-November peak it will constitute additional evidence that a major
bottom is in place.
The final chart shows
Yamana Gold (NYSE: AUY). Like the HUI, AUY is consolidating below
resistance and could continue to do so for a short while before
resuming its advance.
We were stopped out of an AUY trading position at the beginning of last
week, but we are now going to re-establish a trading position at
Friday's closing price of US$4.94. We will set an initial sell stop at
US$4.19 and will then switch to a 15% trailing stop.
Depending on price action we might add a couple more gold/silver trading positions within the next few days.
Update
on Stock Selections
(Note: To review the complete list of current TSI stock selections, logon at http://www.speculative-investor.com/new/market_logon.asp
and then click on "Stock Selections" in the menu. When at the Stock
Selections page, click on a stock's symbol to bring-up an archive of our comments on the stock in question)
 Lion Selection (ASX: LST). Shares: 83M. Recent price: A$0.82 Lion Selection (ASX: LST). Shares: 83M. Recent price: A$0.82
LST shareholders who participated to the fullest possible extent in the
company's off-market buy-back have just sold 66.6% of their shares at
A$1.47 per share. It would be reasonable, we think, to use part of this
capital return to replace some of the LST shares that have just been
sold given that the stock is now trading at around half its net asset
value. Other possible uses for the returned cash include the shares
and/or convertible notes to be issued by Resolute Mining (ASX: RSG) as
part of its recently announced financing, and the shares of Dominion
Mining (ASX: DOM). DOM has been remarkably strong of late and ended
Friday's session at its highest level since July, but still has
significant upside potential and would be a candidate for new buying
below A$3.00.
International Royalty Corp. (TSX: IRC, AMEX: ROY). Shares: 78M issued, 84M fully diluted. Recent price: C$1.42
The stock price of IRC has been almost dead flat near its all-time low
over the past three weeks, but some interesting stuff has been
happening beneath the surface. In particular:
1. The past three weeks contained the stock's three biggest single-day trading volumes of the past three years.
2. The company established a shareholder rights plan on 21st November
designed to "ensure that all shareholders receive equal treatment, to
give the IRC board of directors adequate time to consider and respond
to any unsolicited bid for the company, and to maximize shareholder
value in the event of a takeover bid or other acquisition that could
lead to the change in control of IRC." Plans such as these are
commonplace in Canada, but the timing of this plan is interesting given
item 3 below.
3. Chris Verbiski announced on 4th December that he had recently
acquired additional IRC shares and now controls 14.57% of IRC's share
capital. Mr. Verbiski is the co-discoverer of the massive Voisey's Bay
nickel project and was the co-owner of the company that sold IRC its
2.7% royalty on the Voisey's Bay project back in 2005. The sale price
for the Voisey's Bay royalty was $180M, so it's reasonable to assume
that Mr. Verbisky is 'well heeled'.
Mr. Verbiski's interest in IRC generates some intrigue and additional
speculative appeal, but on its own it isn't a reason to buy the stock.
The reasons to buy the stock are its extreme under-valuation and its
relatively low risk (as a royalty company, IRC is not exposed to many
of the normal mining-related risks).
Chart Sources
Charts appearing in today's commentary
are courtesy of:
http://stockcharts.com/index.html

|