|
-- Weekly Market Update for the Week Commencing 9th February 2015
Big Picture
View
Here is a summary of our big picture
view of the markets. Note that our short-term views may differ from our
big picture view.
In nominal dollar terms, the BULL market in US Treasury Bonds
that began in the early 1980s ended in 2012. In real (gold)
terms, bonds commenced a secular BEAR market in 2001 that will continue
until 2018-2020. (Last
update: 20 January 2014)
The stock market, as represented by the S&P500 Index,
commenced
a secular BEAR market during the first quarter of 2000, where "secular
bear market" is defined as a long-term downward trend in valuations
(P/E ratios, etc.) and gold-denominated prices. This secular trend will bottom sometime between 2014 and 2020.
(Last update: 22 October 2007)
A secular BEAR market in the Dollar
began during the final quarter of 2000 and ended in July of 2008. This
secular bear market will be followed by a multi-year period of range
trading.
(Last
update: 09 February 2009)
Gold commenced a
secular bull market relative to all fiat currencies, the CRB Index,
bonds and most stock market indices during 1999-2001.
This secular trend will peak sometime between 2014 and 2020.
(Last update: 22 October 2007)
Commodities,
as represented by the Continuous Commodity Index (CCI), commenced a
secular BULL market in 2001 in nominal dollar terms. The first major
upward leg in this bull market ended during the first half of 2008, but
a long-term peak won't occur until 2014-2020. In real (gold) terms,
commodities commenced a secular BEAR market in 2001 that will continue
until 2014-2020.
(Last
update: 09 February 2009)
Copyright
Reminder
The commentaries that appear at TSI
may not be distributed, in full or in part, without our written permission.
In particular, please note that the posting of extracts from TSI commentaries
at other web sites or providing links to TSI commentaries at other web
sites (for example, at discussion boards) without our written permission
is prohibited.
We reserve the right to immediately
terminate the subscription of any TSI subscriber who distributes the TSI
commentaries without our written permission.
Outlook Summary
Market
|
Short-Term
(1-3 month)
|
Intermediate-Term
(6-18 month)
|
Long-Term
(2-5 Year)
|
|
Gold
|
N/A |
Bullish
(26-Mar-12) |
Bullish
|
|
US$ (Dollar Index)
|
N/A |
Bearish
(26-Jan-15) |
Neutral
(19-Sep-07) |
|
US Treasury Bonds (TLT)
|
N/A |
Neutral
(18-Jan-12)
|
Bearish |
|
Stock Market
(DJW)
|
N/A |
Bearish
(28-Nov-11) |
Bearish
|
|
Gold Stocks
(HUI)
|
N/A |
Bullish
(23-Jun-10) |
Bullish
|
|
Oil |
N/A |
Bullish
(17-Dec-14) |
Bullish
|
|
Industrial Metals
(GYX)
|
N/A |
Neutral
(15-Sep-14) |
Bullish
(28-Apr-14) |
Notes:
1. Our short-term expectations are discussed in the commentaries, but except in
special circumstances we won't attempt to assign a "bullish", "bearish" or
"neutral" label to these expectations.
2. The date shown below the current outlook is when the most recent outlook change occurred.
3. "Neutral" means that we think risk and reward are roughly in balance with respect to the timeframe in question.
4. Long-term views are determined almost completely by fundamentals and intermediate-term views
are determined by a combination of fundamentals, sentiment and technicals.
Last
week's posts at the TSI Blog
Spurred on by the Fed, banks are blowing bubbles again
Money Supply and recession indicators
Just when I thought it couldn't get any worse...
Chris Powell goes off on a tangent
The Stock
Market
The US
The Big Picture
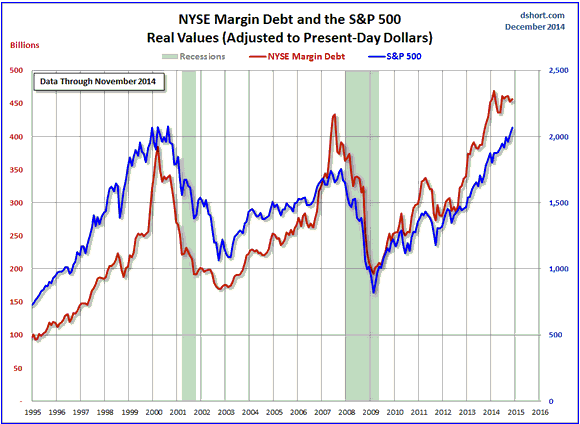
The following chart was extracted from the article posted
HERE and shows that NYSE margin debt remains below its February-2014 peak.
Because major peaks in NYSE margin debt have a track record of occurring prior
to major peaks in the S&P500 Index, this is a warning that a major topping
process is underway in the US stock market. In fact, it is one of two warnings,
the other being the downward reversal in the SPX/T-Bond ratio discussed in
previous commentaries over the past few months.
Current Market Situation
The US Bank Index (BKX) has rebounded strongly since re-testing critical support
at 66. It ended last week at its 50-day MA, which means that the current price
is a likely place for a downward reversal IF we are dealing with a counter-trend
rebound within a declining trend.
A weekly BKX close below 66 would be persuasive evidence that a major top was in
place.
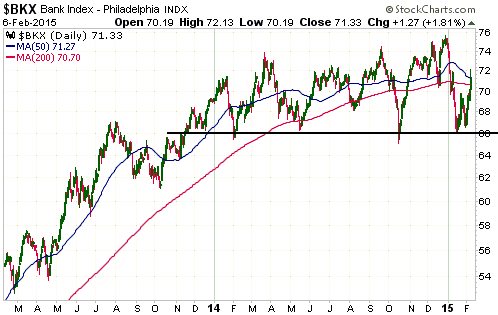
The senior US stock indices ended last week at short-term resistance. Due to
their chart positions they will either reverse lower almost immediately or
signal that there is at least one more new multi-year high in store prior to a
major top.
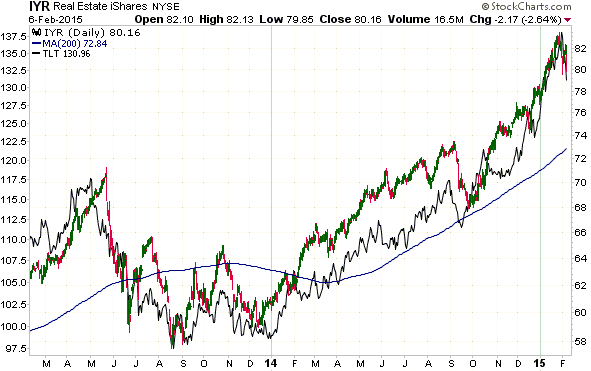
However, one sector of the market could suffer a sizable decline over the next
few months even if the broad market's bullish trend remains intact. We are
referring to the REIT sector, represented on the following chart by Real Estate
iShares (IYR). The chart also shows the 20+ Year Treasury Bond Fund (TLT).
IYR tends to perform like a leveraged play on long-term interest rates, with a
declining trend in the T-Bond yield generally coinciding with an upward trend in
IYR and a rising trend in the T-Bond yield generally coinciding with a downward
trend in IYR. That's why the following chart reveals a strong positive
correlation between IYR and TLT.
We suspect that the T-Bond yield will be roughly flat over the course of this
year, but that with the T-Bond price having hit an 'overbought' extreme in
January (refer to the chart in the 26th January Weekly Update for details) there
is a good reason to expect a significant downward correction in price and upward
correction in yield over the next few months. If this correction occurs it will
probably result in a tradable decline in IYR, which appears to be rolling over
to the downside from an 'overbought' extreme of its own.
We don't have any specific suggestions, but for some traders it could make sense
to average into a bearish IYR speculation over the coming 1-2 weeks. A decline
to the low-70s looks feasible.
Europe
Germany's DAX Index, France's CAC40 Index and the EURO STOXX 50 Index have
recently broken above last year's highs. Italy's MIB (Milano Italia Borsa, not
Men In Black) Index hasn't managed to break above last year's high, but the
following chart shows that it has broken out to the upside from an
intermediate-term channel.
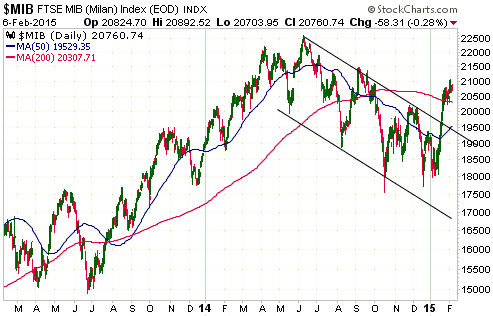
The recent strength in European equities, not only in nominal currency terms but
also relative to US equities, is probably due to acceleration in the rate of
euro-zone monetary inflation during the final two months of last year. With
additional ECB money-pumping scheduled to begin in March there's a decent chance
that this nominal and relative strength will be sustained for at least a few
more months.
Japan
After rocketing upward in late-2012 and early-2013 in anticipation of the "Abenomics"
pro-inflation program, the Japan iShares ETF (EWJ) has oscillated within a wide
rectangle. This long-term pattern is neutral, in that it could be a lengthy
sideways consolidation or it could be a lengthy topping process.
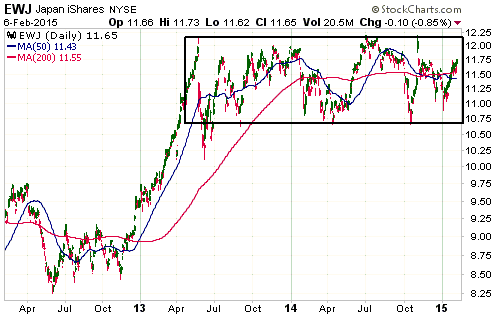
Our view is that one of the following two Japan-related outcomes will happen
this year (probably during the first half):
1. EWJ breaks above resistance at $12.20 and moves sharply higher
2. The Yen gains 10%-20% against the US$
There's a small chance that both will happen, but there's a good chance that at
least one will happen. That's why we like the 'pair trade' that involves owning
long-dated FXY (Yen) and EWJ call options.
This week's
significant US economic events
(The most important events are shown
in bold)
| Date |
Description |
| Monday Feb 09 |
No important events scheduled | | Tuesday
Feb 10 |
No important events scheduled | | Wednesday
Feb 11 |
Treasury Budget | | Thursday
Feb 12 |
Retail Sales
Business Inventories
|
| Friday Feb 13 |
Consumer Sentiment
Import and Export Prices |
Gold and
the Dollar
Gold
The futures market and the gold price
It is sometimes said that the trading of paper gold, such as gold futures,
drives the gold price. This is not true. The trading of gold futures will often
have a significant effect on price performance, but the effect will be
short-lived and fully reversed unless it is supported by what's happening in the
underlying physical market.
That futures trading can only have a short-lived effect on price is evidenced by
the fact that almost all positions in the gold futures market are short-term,
with every buyer of futures today necessarily being a seller tomorrow (not
literally "tomorrow", but within the next few months) and every short-seller of
futures today necessarily being a buyer tomorrow. It is also evidenced by the
fact that the opening of a new futures contract involves both a purchase and a
short-sale.
That being said, in the past there has been a long-term relationship between the
futures market and the gold price. The relationship is that the trend in futures
open interest (OI) moves in the same direction as the price trend. In other
words, during a gold bull market the OI will generally trend upward, meaning
that the number of contracts purchased and the offsetting number of contracts
sold short will tend to make progressively higher highs along with the price.
And during a gold bear market the OI will generally trend downward, meaning that
the number of contracts purchased and the offsetting number of contracts sold
short will tend to make progressively lower highs along with the price. This
relationship can be seen by comparing the top and bottom sections of the
following chart (the top section shows the gold price and the bottom section
shows the COMEX gold futures open interest). By the way, this means that the
amount of gold sold short on the COMEX was less in 2014 than it was in 2011.
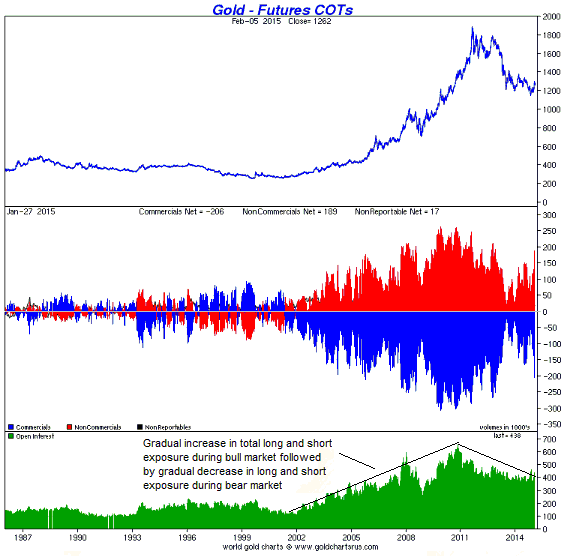
Chart Source: http://www.sharelynx.com/
The other point that deserves to be made and that can be made with the help of
the same chart is that speculators move in synch with the price trend. This is
evidenced by the fact that the net speculative position in gold futures (the red
bars in the middle section of the chart) was generally short during the
1996-2000 cyclical decline and became increasingly long as the price rose from
its 2001 bottom to its 2011 peak.
The tendency for the speculative net-long position in the futures market to rise
and fall with the gold price stems largely from the fact that many speculators
in the futures market are trend followers. However, we believe that it is also
partly due to some speculators making correct assessments of gold's true
fundamentals or correctly anticipating changes in gold's true fundamentals.
In any case, the speculative net-long position tends to rise and fall with the
price. Since it is mathematically impossible for the speculative net-long
position to increase without an offsetting increase in the commercial net-short
position (the blue bars in the middle section of the above chart), this means
that as the price rises the commercials tend to become increasingly net-short
and as the price falls the commercials tend to reduce their collective net-short
position. It also means that the commercials will always look wrong while the
price is trending upward and look right at price peaks.
The final point we'll make is that the maximum net-long position of large
speculators and the maximum total speculative net-long position (the net-long
positions of large speculators plus small traders -- the exact opposite of the
commercial net-short position) appeared to be limited to around 250K contracts
and 300K contracts, respectively, during the cyclical bull market that ended in
2011. We don't know why this was the case, but we expect that, just as OI and
total position-size records were broken during the 2005-2011 period, the
aforementioned limits will be exceeded during the next bull market.
Current Market Situation
The catalyst for last Friday's sharp decline in the gold price was news that the
US economy was doing better than expected, or at least news that was interpreted
this way. However, gold's decline on Friday was less about economic news than
the extent to which the market had become 'overbought'. In US$ terms the price
didn't look stretched to the upside, but speculators had piled into long futures
positions over the preceding few weeks. This made the market vulnerable. Also,
in non-US$ terms the gold price clearly did look stretched to the upside --
sufficiently so that we were (and still are) expecting a few months of
'corrective' activity.
Gold's recent 'overbought' condition in non-US$ terms is illustrated by the
following charts of the euro-denominated gold price and the gold/oil ratio. Note
that the large and steep rise in the euro-denominated gold price is why
speculators are simultaneously net-long gold futures in a big way and net-short
euro futures in a big way (the speculative net-long position in gold futures is
at a 2-year high and the speculative net-short position in euro futures is
within spitting distance of an all-time high).
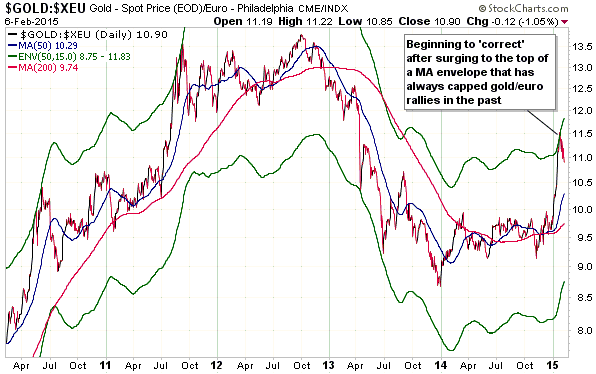
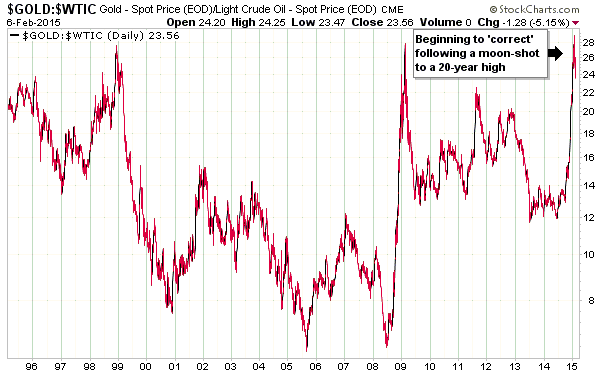
As we keep saying, it could easily take a few months to 'correct' these
extremes.
In US$ terms the short-term situation is illustrated below. Notice that Friday's
decline ended just above the 50-day MA.
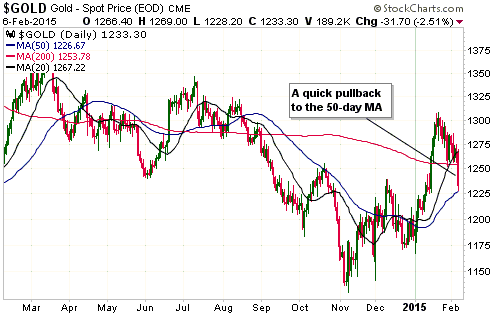
The correction in the US$ gold price will probably continue for a minimum of a
few more weeks, but that doesn't imply that there will be significant additional
price weakness prior to the start of a rally to new highs for the year. As
mentioned a week ago, based on past performance it is reasonable to anticipate a
correction that is long enough and/or deep enough to reduce the total
speculative net-long position in COMEX gold futures by at least 70K contracts.
This could potentially be achieved via additional price weakness or a multi-week
period of choppy sideways movement.
Brief note on silver
Our most recent comment on silver was in the 19th January Weekly Update, at
which time we wrote that silver would probably soon test, but not breach,
important resistance at $18.50-$19.00. It subsequently traded as high at $18.50
and then embarked on a correction.
Like gold, silver plunged to its 50-day MA last Friday. It ended the week
exactly at this moving average.
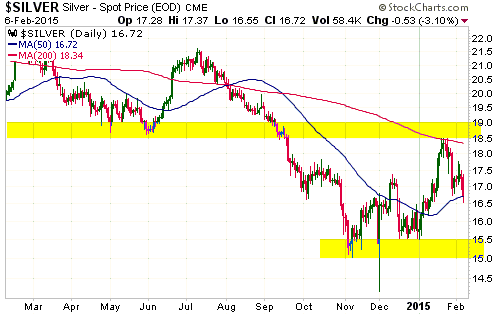
Other than not expecting it to exceed resistance at $18.50-$19.00 within the
next few weeks, we don't have an opinion on how silver will perform in the near
future. It could rebound from the 50-day MA, but it could also continue to work
its way down to intermediate-term support at $15.00-$15.50.
Gold Stocks
At that end of last Thursday's trading session the HUI's price pattern was
neutral with regard to near-term direction, in that it didn't contain any clues
as to whether the price would break above resistance in the low-200s or break
below support in the mid-190s. However, in last week's Interim Update we said
that regardless of the direction of the coming breakout, a decline to near the
50-day MA (at 179 and rising) was likely prior to the next correction low and
was needed to create the next sector-wide buying opportunity.
In response to last Friday's release of positive economic data in the US, the
gold price quickly fell 2.6% and the gold-mining indices fell with gold. The HUI
closed below its 20-day MA for the first time this year.
As a result of this price action there is now a high probability that the HUI's
January peak was the top of the initial rally from last year's crash low, but
otherwise nothing has changed. Our expectation continues to be that a decline to
the 50-day MA or lateral support at 180 is on the cards and that a decline of
that magnitude would set up the next sector-wide (as opposed to stock-specific)
buying opportunity. Stock-specific buying opportunities already exist, with
EDV.TO being the most obvious.
We plan to add a new gold stock to the TSI List in the near future, but our
first choice for the new selection will have to fall in price by around 10% from
its current level to create the buying opportunity we want.
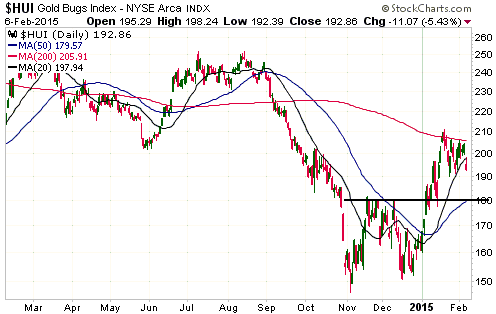
The HUI has performed well relative to gold bullion over the past seven weeks
and should continue to do so if a new bull market is underway.
The Currency Market
The strong rise in the Dollar Index from a December low of 88 to a January high
of 96 was mostly about problems in the euro-zone and declining confidence in the
ECB, but last Friday's rise in the Dollar Index was clearly driven by the
perception of US economic strength. That's why, for at least one day, gold and
the US$ went back to being negatively correlated. In other words, economic data
that created the impression that the US economy was doing better than generally
thought propelled the US$ upward and gold downward.
However, the market reaction to last Friday's US employment report could aptly
be described as subdued, considering that it represented the most bullish
employment news in years. The report included greater than expected job creation
in January, large upward revisions to the job-growth numbers reported in
previous months, and a robust increase in hourly earnings. Even the up-tick in
the unemployment rate was a sign of strength in that it was the result of more
people entering the workforce. Why, then, did the Dollar Index do no better than
rebound to the top of the little downward-sloping channel drawn on the following
daily chart?
The answer is that the Dollar Index was near an historic extreme when it peaked
in January and is still close to its most 'overbought' level ever. With 9 out of
every 10 speculators already bullish on the US$ and bearish on the euro, it is
going to be very difficult for the Dollar Index to break above its January high
prior to a substantial correction.
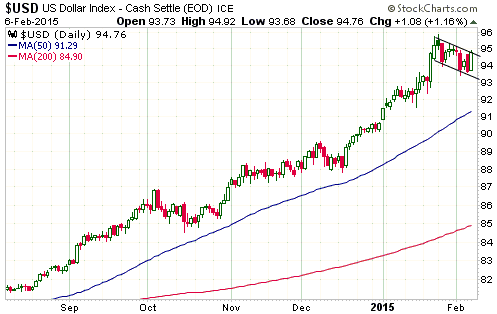
The price action hasn't yet confirmed a short-term top in the Dollar Index, so
we should allow for the possibility that the January high will be tested and
perhaps marginally exceeded before a substantial correction gets underway.
Uncertainty regarding the outcome of the new Greek government's debt-related
negotiations with its EU partners could get in the way of a euro rally and help
the US$ stay near its high for another week or two.
Updates
on Stock Selections
Notes: 1) To review the complete list of current TSI stock selections, logon at
http://www.speculative-investor.com/new/market_logon.asp
and then click on "Stock Selections" in the menu. When at the Stock
Selections page, click on a stock's symbol to bring-up an archive of
our comments on the stock in question. 2) The Small Stock Watch List is
located at http://www.speculative-investor.com/new/smallstockwatch.html
 Company
news/developments for the week ended Friday 6th February 2015: Company
news/developments for the week ended Friday 6th February 2015:
[Note: AISC = All-In Sustaining Cost, FS = Feasibility Study, IRR = Internal
Rate of Return, MD&A = Management Discussion and Analysis, M&I = Measured and
Indicated, NAV = Net Asset Value, NPV(X%) = Net Present Value using a discount
rate of X%, P&P = Proven and Probable, PEA = Preliminary Economic Assessment,
PFS = Pre-Feasibility Study]
*Endeavour Mining (EDV.TO, EVR.AX) announced that it has received
the final signed mining permit to develop and operate the Hounde gold project in
Burkina Faso. Based on the FS completed in November of 2013, if the Hounde
project were developed into a mine it would add about 180K ounces to EDV's
annual production.
The FS indicated that the Hounde project would be economically viable, but not
robust, at a gold price of $1300/oz. According to EDV, updated details on the
economics of the project will be provided in the near future.
*Energy Fuels (EFR.TO, UUUU) is making preparations to restart
uranium production at the Canyon mine in Arizona. Most of the surface
development is in place at Canyon. To complete the mine the company plans to
extend the existing shaft by 1,200 feet and install two ventilation shafts.
No timeline for the aforementioned work has been provided, but it's unlikely
that EFR will need or want additional production until the earlier of 2018 and
the time when the spot uranium price makes a solid break above $50/pound.
The current uranium price is around $38/pound and the market is showing signs of
strength.
*Pilot Gold (PLG.TO) reported last October that it had discovered
another gold-copper porphyry deposit, called the Columbaz Target, at its TV
Tower project in Turkey. This is the 5th deposit and 3rd gold-rich porphyry
discovered at the project.
Three holes drilled to follow up on the Columbaz discovery hole encountered
significant mineralisation. The grades are low, but the widths are substantial
(e.g. 0.36 g/t Au and 0.13% Cu over 499.1 metres) and the mineralisation begins
at the surface.
*Premier Gold (PG.TO) announced very positive news. The news is
that PG.TO has done a joint-venture deal with Centerra Gold (CG.TO) concerning
the development of PG's Trans-Canada (TC) gold project in Ontario. It is very
positive because it a) immediately injects a lot of cash into PG, b) almost
certainly means that PG won't have to spend anything on the TC project for at
least the next 12 months and perhaps for much longer, c) greatly de-risks the
project, and d) is a clear-cut vote of confidence in the economic potential of
the TC project.
The specifics of the JV deal are as follows:
1) The JV will be owned 50/50 by PG and CG
2) PG's contribution to the JV will be the TC project
3) In exchange for obtaining its 50% interest in the JV, CG will a) make an
up-front payment of C$85M directly to PG, b) pay the next C$185M of development
expenses, which is expected to cover a resource re-estimate, a Feasibility Study
and part of the initial capex, and c) make an additional payment of between zero
and C$30M to PG, with the actual amount determined by the resource re-estimate.
The immediate financial benefit to PG from the deal is therefore between
C$177.5M and C$207.5M ($85M plus half of $185M plus a contingent payment of
$0-$30M). This is obviously very significant for a company that had an
enterprise value of around $300M prior to the announcement of the deal.
That PG was able to do this deal in the current moribund market is a credit to
Ewan Downie, its CEO. Downie is clearly one of the savviest business managers in
the junior gold-mining sector.
We estimate that PG currently has about $30M of working capital, so as soon as
this deal is consummated the company should have about $115M of working capital
and no need to spend anything on its flagship project for the foreseeable
future. Part of this cash hoard will no doubt be used by PG to add value to its
Cove-McCoy gold project in Nevada and its Rahill-Bonanza gold project in
Ontario.
*Ramelius Resources (RMS.AX) estimates that it made a pre-tax
profit of A$5.7M during the 6-month period ending 31st December 2014. Full
details will be provided in the half-year report due later this month.
The return to profitability is obviously a positive change, but our main
concern/interest is the improvement to the balance sheet stemming from free
cash-flow. We'll find out what this was when the company publishes its half-year
report later this month.
*Sabina Gold and Silver (SBB.TO) announced that Rob Pease, the
company's current CEO, is about to retire and will be replaced by Bruce McLeod.
We view this news as neutral. We have not been impressed with Rob Pease and view
his departure as a plus, but his replacement has a checkered past. In
particular, although Bruce McLeod has a lot of worthwhile experience, he most
recently presided over the slide into bankruptcy of copper miner Mercator
Minerals.
*Timmins Gold (TGD) reported drilling results that reveal the
potential for a satellite deposit several kilometres to the north of the
company's San Francisco gold mine in Mexico, but it is far too early in the
exploration process to determine the extent to which this potential can be
converted into new production.
List of candidates for new buying
From within the ranks of TSI stock selections the best candidates
for new buying at this time, listed in alphabetical order, are:
1) AKG (last Friday's closing price: US$1.46).
2) EDV.TO (last Friday's closing price: C$0.59).
3) PG.TO following a pullback to C$2.10-$2.20 (last Friday's closing
price: C$2.44).
4) TGD (last Friday's closing price: US$1.01).
Note that the above list is limited to five stocks. It will
sometimes contain less than five, but it will never contain more
than five regardless of how many stocks are attractively priced for
new buying.
Insider Buying
For insider buying or selling to be noteworthy, it must be
substantial. Over the past three weeks there has been noteworthy
insider buying in two TSI stocks.
The most significant buying has come from company insiders at
Endeavour Mining (EDV.TO, EVR.AX). From 20th January through to 2nd
February, EDV insiders purchased around 1.1M shares in the
C$0.57-C$0.66 range. EDV insiders therefore clearly believe that the
stock offers excellent value near its current price, but what would
they know.
There was also significant buying of True Gold Mining (TGM.V) shares
by Mark O'Dea, the company's most important "insider". Specifically,
from 28th January through to 4th February O'Dea bought 315K shares
in the C$0.16-$0.19 range. This represents a meaningful show of
support at a time when the company and the stock are under pressure
due to a major community-relations issue.
Chart Sources
Charts appearing in today's commentary
are courtesy of:
http://stockcharts.com/index.html

|
