|
-- Weekly Market Update for the Week Commencing 9th March 2015
Big Picture
View
Here is a summary of our big picture
view of the markets. Note that our short-term views may differ from our
big picture view.
In nominal dollar terms, the BULL market in US Treasury Bonds
that began in the early 1980s ended in 2012. In real (gold)
terms, bonds commenced a secular BEAR market in 2001 that will continue
until 2018-2020. (Last
update: 20 January 2014)
The stock market, as represented by the S&P500 Index,
commenced
a secular BEAR market during the first quarter of 2000, where "secular
bear market" is defined as a long-term downward trend in valuations
(P/E ratios, etc.) and gold-denominated prices. This secular trend will bottom sometime between 2014 and 2020.
(Last update: 22 October 2007)
A secular BEAR market in the Dollar
began during the final quarter of 2000 and ended in July of 2008. This
secular bear market will be followed by a multi-year period of range
trading.
(Last
update: 09 February 2009)
Gold commenced a
secular bull market relative to all fiat currencies, the CRB Index,
bonds and most stock market indices during 1999-2001.
This secular trend will peak sometime between 2014 and 2020.
(Last update: 22 October 2007)
Commodities,
as represented by the Continuous Commodity Index (CCI), commenced a
secular BULL market in 2001 in nominal dollar terms. The first major
upward leg in this bull market ended during the first half of 2008, but
a long-term peak won't occur until 2014-2020. In real (gold) terms,
commodities commenced a secular BEAR market in 2001 that will continue
until 2014-2020.
(Last
update: 09 February 2009)
Copyright
Reminder
The commentaries that appear at TSI
may not be distributed, in full or in part, without our written permission.
In particular, please note that the posting of extracts from TSI commentaries
at other web sites or providing links to TSI commentaries at other web
sites (for example, at discussion boards) without our written permission
is prohibited.
We reserve the right to immediately
terminate the subscription of any TSI subscriber who distributes the TSI
commentaries without our written permission.
Outlook Summary
Market
|
Short-Term
(1-3 month)
|
Intermediate-Term
(6-18 month)
|
Long-Term
(2-5 Year)
|
|
Gold
|
N/A |
Bullish
(26-Mar-12) |
Bullish
|
|
US$ (Dollar Index)
|
N/A |
Bearish
(26-Jan-15) |
Neutral
(19-Sep-07) |
|
US Treasury Bonds (TLT)
|
N/A |
Neutral
(18-Jan-12)
|
Bearish |
|
Stock Market
(DJW)
|
N/A |
Bearish
(28-Nov-11) |
Bearish
|
|
Gold Stocks
(HUI)
|
N/A |
Bullish
(23-Jun-10) |
Bullish
|
|
Oil |
N/A |
Bullish
(17-Dec-14) |
Bullish
|
|
Industrial Metals
(GYX)
|
N/A |
Neutral
(15-Sep-14) |
Bullish
(28-Apr-14) |
Notes:
1. Our short-term expectations are discussed in the commentaries, but except in
special circumstances we won't attempt to assign a "bullish", "bearish" or
"neutral" label to these expectations.
2. The date shown below the current outlook is when the most recent outlook change occurred.
3. "Neutral" means that we think risk and reward are roughly in balance with respect to the timeframe in question.
4. Long-term views are determined almost completely by fundamentals and intermediate-term views
are determined by a combination of fundamentals, sentiment and technicals.
Last
week's posts at the TSI Blog
Price manipulation is not inherently wrong
Total guesswork regarding China's gold holdings
Revisiting the global boom/bust indicator
US Economic Numbers
The manufacturing sector slowdown
Last week the financial markets were focused on the monthly US employment
numbers published on Friday, but our main interest was the set ISM manufacturing
numbers published on Monday. The employment numbers are significant to the
extent that they have some influence on the Fed, but as economic indicators they
aren't useful. This is because they lag the economy by at least a few months and
because they are often subject to large future revisions. The ISM manufacturing
numbers, on the other hand, are significant because they are reliable indicators
of how the economy is currently performing and how it will likely perform in the
near future.
Of the ISM Report's components, the most useful is the New Orders Index. Here's
a chart showing the performance of this index since the beginning of the 21st
Century. There has clearly been a slowdown in the manufacturing sector over the
past 4 months, but not enough of a slowdown, yet, to suggest that a recession
lies around the next corner.
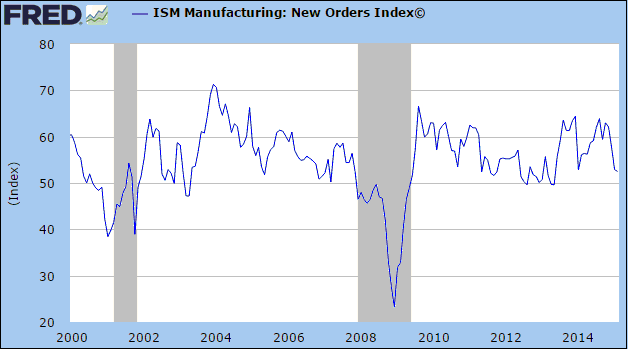
A warning signal of an imminent recession would be generated by a solid break
below 50 in the ISM Manufacturing Report's New Orders Index. The above chart
shows that there were a few occasions during 2011-2013 when this index dropped
to the low-50s, but that on each of these occasions there was no follow-through
to the downside and therefore no recession signal.
The economic slowdown reflected by the recent decline in the New Orders Index is
probably related to the retrenchment in the US oil industry stemming from the
collapse in the oil price. Considering that the oil industry was responsible for
a lot of the 'real' growth in the US economy over the past several years, it's
possible that the rapid scaling-down currently taking place in this part of the
economy will soon push the entire economy into recessionary territory. Possible,
but not likely. Given that the New Orders Index is still above 50, that the
monetary backdrop is still supportive and that private domestic investment
hasn't yet turned down, we think it's safe to assume that the start of the next
US recession lies more than three months into the future. On this matter, that's
as far ahead as we need to look.
The employment ramp-up
While the ISM numbers contained the more useful information about economic
performance, the employment numbers had by far the bigger effect on the
financial markets.
The stronger-than-expected employment report published last Friday had a big
effect on the financial markets for two reasons. First, a lot of short-term
traders rightly believe that the continuation of strong (250K+) monthly gains in
the headline jobs-creation number makes it likely that the Fed will commence a
rate-hiking program at its June meeting rather than waiting until later in the
year. Second, a lot of short-term traders wrongly believe that moving the Fed
Funds rate up from 0.25% to 0.50% or 0.75% will make a difference to the
monetary backdrop. It won't make a difference, not just because a 0.50% increase
is trivial but also because -- as most recently discussed in last week's Interim
Update -- the Fed is now able to boost the Fed Funds rate without reducing bank
reserves or money supply, that is, without tightening monetary conditions.
Based on changes in the pricing of Fed Funds futures contracts, we know that in
reaction to last Friday's US employment news the market went from expecting
one-to-two 0.25% rate hikes to expecting two-to-three 0.25% rate hikes during
the second half of this year. Not much of a change, but clearly enough to roil
the currency, bond, stock and gold markets.T-Bond
Update
The word "extreme" is mentioned often
in today's report. It's the single word that best describes current and recent
conditions in some of the most important markets. In particular, at this time
the currency market is at an extreme and the stock market is possibly near an
extreme, whereas in late-January there were extremes in the T-Bond market, the
oil market and, by some measures, the gold market. Below is an update of a
weekly chart that we included in our 2015 forecast to illustrate the January
extreme in the T-Bond.
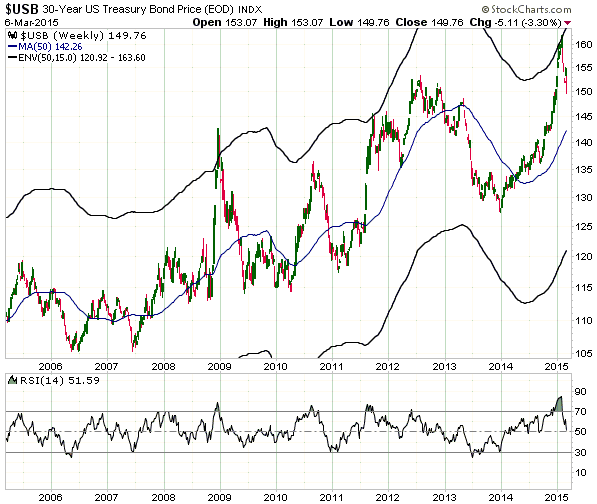
As we noted in late-January, the 30-year T-Bond had reached the top of the
moving-average (MA) envelope that limited the powerful rallies of 2008 and 2011,
and the T-Bond's weekly RSI was at its highest level in more than 10 years. This
suggested that the T-Bond had minimal additional upside potential over the
ensuing 12 months and that a significant correction was likely. The correction
obviously began a short time later and is probably not complete, although we
expect that the T-Bond will attract 'flight to safety' buying when the stock
market suffers its next meaningful decline. This could lead to the T-Bond making
a short-term bottom this month and then rallying back to near its January high
as part of a longer-term corrective process.
The Stock
Market
Last Friday was the first time in a long
time that good economic news was taken negatively by the US stock market due to
the effect of the news on interest rates. However, we doubt that stocks and
T-Bonds will decline together over the weeks immediately ahead. It's more likely
that the T-Bond will soon begin to rebound if it turns out that a significant
stock market downturn has just begun.
The only reason we attribute significance to last Friday's pullback in the
S&P500 Index (SPX) is that it happened a few weeks after an upside breakout to
new highs and invalidated the breakout. Failed breakouts tend to be important.
A short-term and a potentially longer-term bearish signal could now be generated
by the following 3-step process:
1. An interim low within the next couple of trading days.
2. A rebound to a lower high (ideally, around 2090).
3. A daily close below the Step 1 low.

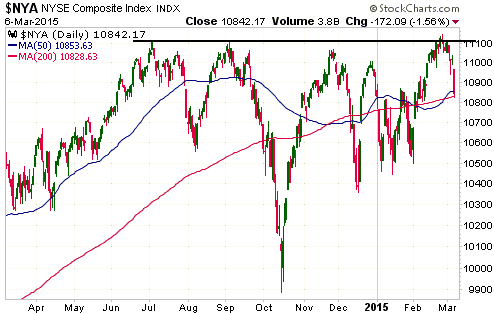
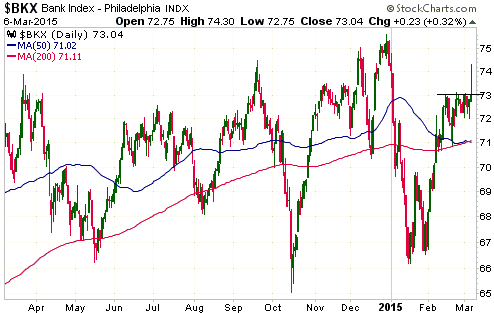
Here are two other charts of interest. The first shows that there is now either
a triple or a quadruple top (depending on whether or not we count the November
top) in place for the NYSE Composite Index (NYA). Note that it would be strange,
although not impossible, for a major top in the NYA to be put in place via three
or four coincident highs. The second shows that the Bank Index (BKX) moved well
above short-term resistance during Friday's trading session before giving up
almost all of its gains and ending the day below this resistance.
This week's
significant US economic events
(The most important events are shown
in bold)
| Date |
Description |
| Monday Mar 09 |
No important events scheduled | | Tuesday
Mar 10 |
No important events scheduled | | Wednesday
Mar 11 |
Treasury Budget | | Thursday
Mar 12 |
Retail Sales
Import and Export Prices
Business Inventories
|
| Friday Mar 13 |
PPI
Consumer Sentiment |
Gold and
the Dollar
Gold
Extremes
What we write about the price action often seems to be in the eye of the
beholder, in that different people read the same market analysis and come away
with completely different impressions. We know that this is the case because of
the feedback we receive from our readers.
There is a good example in the gold-related emails we received in the aftermath
of Friday's market action. Among several emails was one that criticised us for
not foreseeing the severity of the recent gold price decline and for 'moving the
bar' on gold's correction. Another email contained a thankyou note for helping
to keep the reader out of trouble via our warnings of gold market weakness near
the January price top and subsequently. A third email congratulated us on being
very accurate with our short-term gold market analysis over the past four
months. All of these emails were from long-term TSI supporters who have seen
many ups and downs in the markets and the TSI service.
We appreciate all the feedback, but, in truth, it's rare that we make a
definitive short-term call about gold or any other market, because we realise
that short-term price movements are largely sentiment-driven and unpredictable.
The best we can generally do is weigh risk against potential reward. This means
that it is rare for us to be either right or wrong about the short-term market
action. The reality is that we usually don't have an opinion. However, like
everyone else with chart-reading experience we can identify support and
resistance levels that have the potential to limit short-term price trends.
The more extreme the price action the more likely it is that we will make an
actual "call", thus leaving ourselves open to being either right or wrong.
Within the past six months, for example, the crash pattern that completed in the
gold-mining sector in early-November of last year enabled us to make the call
(which turned out to be correct) that an important bottom was in place and that
the bottom would probably be tested within a few weeks prior to the start of a
tradable rally. Another "call" was made possible during the second half of
January when the non-US$ gold price became so extended to the upside that a
substantial correction was a near certainty. However, during the same 6-month
period we've been wrong about the currency market. In the currency market's case
the price action became extreme enough on more than one occasion to prompt us to
make a short-term "call", but the anticipated reaction to the extremity hasn't
yet happened. It will happen, but our timing was obviously wrong.
Current Market Situation
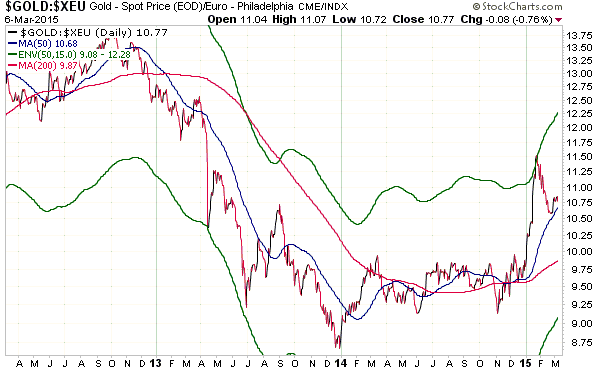
The January extreme in the euro-denominated gold price (gold/euro) is
illustrated by the following chart. After pulling back to its 200-day MA in
December, gold/euro rocketed upward and four weeks later was at the top of a MA
envelope that had always limited intermediate-term rallies in the past. At this
point there was a high probability that a downward correction lasting at least a
few months was about to begin, as we noted at the time.
The historical record suggests an eventual decline to the 200-day MA prior to
the start of the next intermediate-term advance. The 200-day MA is rising and we
suspect that it will intersect the price 2-4 months from now at somewhere above
1000 euros.
Gold's position at the late-January peak wasn't anywhere near as extreme in US$
terms as it was in terms of the euro and many other currencies. However, with
regard to the US$ gold price both the daily RSI(14), a momentum indicator, and
the speculative net-long position in COMEX gold futures, a sentiment indicator,
were at 2-year highs in late-January. This suggested that a short-term
correction was a good bet, but other than $1250 being a high-probability initial
target the extent of the correction was unknowable in advance.
Corrections continue until they've done what they need to do. We guessed that
gold's correction needed to reduce the speculative net-long position by around
70K contracts, which it had done by the week before last. Also, prior to last
week gold's daily RSI had dropped to around 40, which is as low as it will
typically get during a routine short-term correction. By the start of last week
gold's correction had therefore done what it needed to do to set the stage for a
multi-week rally, but this didn't guarantee that a rally was about to begin. The
markets aren't that straightforward.
Signs that gold's correction was not yet ready to end appeared last Wednesday,
when the HUI broke below its 50-day MA and the HUI/gold ratio dropped to a
multi-week low. Hindsight is always 20/20, but in real time these signs didn't
say anything more than "the correction will probably extend into the ensuing
week".
Friday's plunge in the gold price undoubtedly caused a further significant
reduction in the speculative net-long position in the gold futures market. Also,
the gold price has just fallen for 5 days in a row and the daily RSI has dropped
below 30. This means that the US$ gold price is nearing an 'oversold' extreme,
although it isn't quite there yet.
As an aside, an 'oversold' extreme shouldn't be reached during a routine
short-term correction. Instead, the market should reverse course well before it
reaches an extreme.
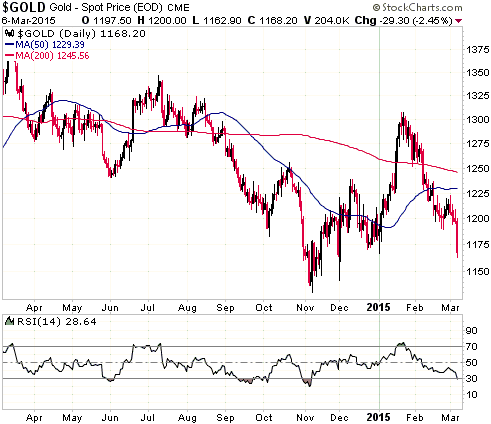
In US$ terms the gold market is almost as 'oversold' today as it was
'overbought' at the short-term peak in January. The stage is therefore set for
an upward reversal, but the reversal could be preceded by some additional
down-days.
Whether it happens as part of the current decline or during the second quarter
of this year after an intervening a multi-week rebound, there is a high
probability that last year's low will be tested.
Gold Stocks
Like gold, the HUI has fallen for five days in a row and is now nearing an
'oversold' extreme. However, it has only just broken below important lateral
support at 180, so we can't confidently predict that there will be an immediate
upward reversal. In fact, an immediate upward reversal wouldn't necessarily be
bullish beyond the very short-term. Now that support has given way, three or
more additional down days in a row would create a much better chance of a
sustainable bottom.
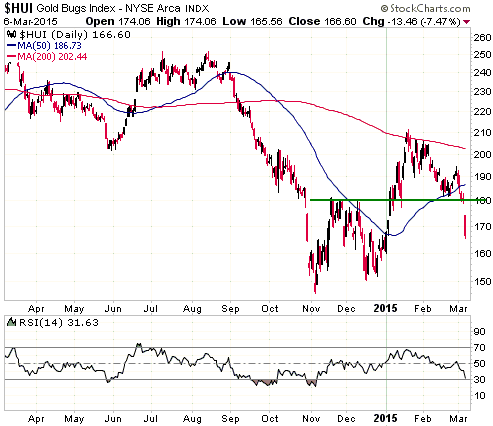
Unfortunately, Friday's breach of support suggests that the next multi-week
rally will end at a lower high for the year (that is, below 210). The 200-day
moving average could be a realistic short-term upside target, but there's no
point giving much thought to the magnitude of the next rally until after
evidence emerges that the decline has ended.
The Currency Market
By reliable measures the T-Bond, gold in non-US$ terms and oil reached
intermediate-term extremes (highs for the T-Bond and non-US$ gold, low for oil)
in late-January. By similar measures the Dollar Index also reached an extreme in
late-January, but unlike the other markets it didn't reverse course. Instead, it
traded sideways for a few weeks and then resumed its steep advance. As a
consequence, an intermediate-term extreme has turned into an extreme for the
ages.
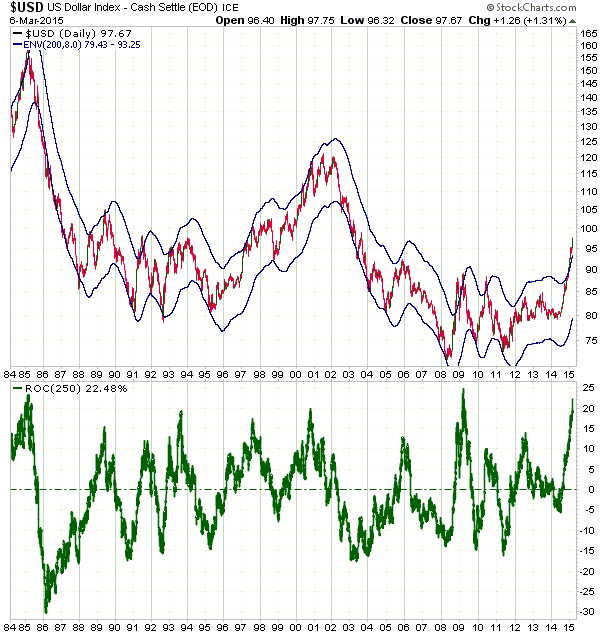
The following chart illustrates the extreme. Specifically, the top section of
the following chart shows that the Dollar Index is in the midst of its
largest-ever sustained move above its 200/8 MA envelope (an 8% envelope around
the 200-day MA). It went further above the top of this MA envelope in 2008, but
in 2008 the move was more quickly reversed. The bottom section of the same chart
shows that the Dollar Index's 250-day rate-of-change (ROC) was only higher near
its 1985 and 2008 peaks, and was only significantly higher at its 1985 peak.
The chart's overarching message is therefore that the Dollar Index is now at the
second or third most 'overbought' level since the advent of the current monetary
system. Furthermore, it was only during the final months of the major upside
blow-off that ended at the all-time high of Q1-1985 that the Dollar Index was
significantly more 'overbought' than it is right now.
Perhaps it will turn out to be important that we are now almost 30 years to the
day from the major peak of Q1-1985.
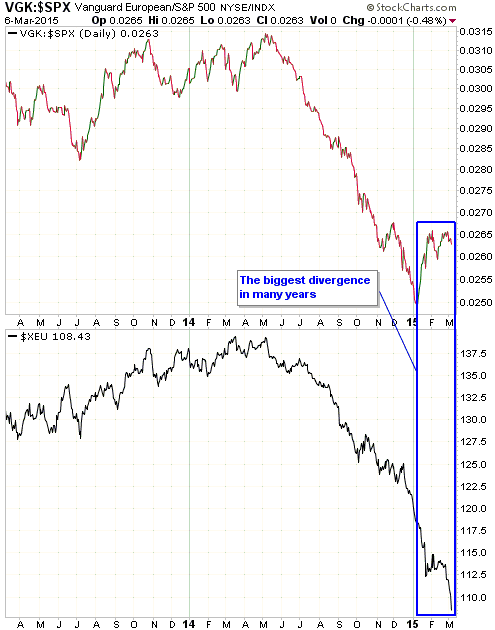
The continuing rapid advance in the Dollar Index has no regard for anything.
Even the relative strength in European equities relative to US equities, as
indicated on the following chart by the VGK/SPX ratio, has failed to turn the
tide, creating the biggest divergence in years between the VGK/SPX ratio and the
euro.
The historical record tells us to expect the Dollar Index to suffer a 1-2 month
decline of at least 10% after the current blow-off runs out of steam. Be aware,
though, that having come this far the blow-off could extend to the 'magical' 100
level before the expected 10%+ decline gets underway.
Updates
on Stock Selections
Notes: 1) To review the complete list of current TSI stock selections, logon at
http://www.speculative-investor.com/new/market_logon.asp
and then click on "Stock Selections" in the menu. When at the Stock
Selections page, click on a stock's symbol to bring-up an archive of
our comments on the stock in question. 2) The Small Stock Watch List is
located at http://www.speculative-investor.com/new/smallstockwatch.html
 Company
news/developments for the week ended Friday 6th March 2015: Company
news/developments for the week ended Friday 6th March 2015:
[Note: AISC = All-In Sustaining Cost, FS = Feasibility Study, IRR = Internal
Rate of Return, MD&A = Management Discussion and Analysis, M&I = Measured and
Indicated, NAV = Net Asset Value, NPV(X%) = Net Present Value using a discount
rate of X%, P&P = Proven and Probable, PEA = Preliminary Economic Assessment,
PFS = Pre-Feasibility Study]
*Almaden Minerals (AAU) advised that all field work and testing
related to the Tuligtic project's PFS and environmental permitting will be
completed by May of this year, allowing for the completion of the PFS and
submittal of environmental permits later in 2015. The company also confirmed
that a shareholder vote to enable the spin-out of its exploration and royalty
assets into a separate company was still planned for June.
*Clifton Star (CFO.V) made an announcement last Monday that we
view in a positive light. The company announced that it had settled the legal
action relating to a C$22.5M loan that should originally have been provided by
Osisko more than 2 years ago. Under the terms of the settlement, CFO is
receiving C$11M of cash. In return, CFO will release the new owners of Osisko (Agnico
Eagle and Yamana) from any further liability associated with the loan and will
issue a combined total of 9.6M. With a total post-deal share count of 48M, this
means that the Agnico-Yamana combo will end up with 20% of CFO.
This deal will boost CFO's working capital (cash) to C$14M, which equates to
about C$0.29/share. The company has no long-term debt, which means that at
Friday's closing price of C$0.21 (up about 100% over the week, but obviously
from a very low base) it is trading at a substantial discount to its cash in the
bank.
Unfortunately, with the option on 90% of the Duparquet gold project having been
let go, CFO has no assets of significance apart from its cash. It still holds
10% of Duparquet, but this doesn't have much value at the moment. Therefore, we
think that the stock is currently worth no more than its cash in the bank
(C$0.29/share).
However, there is still a chance that the efforts of former CEO Harry Miller to
replace the current board and renegotiate the Duparquet option will be
successful. A lot will now depend on how Agnico-Yamana votes its 20% stake. In
other words, CFO could still end up with significant cash and a decent mining
asset.
For existing shareholders it could make sense to do some selling if the CFO
stock price moves up to near its cash backing (C$0.29) over the weeks
immediately ahead and to retain some exposure due to the potential for corporate
activity.
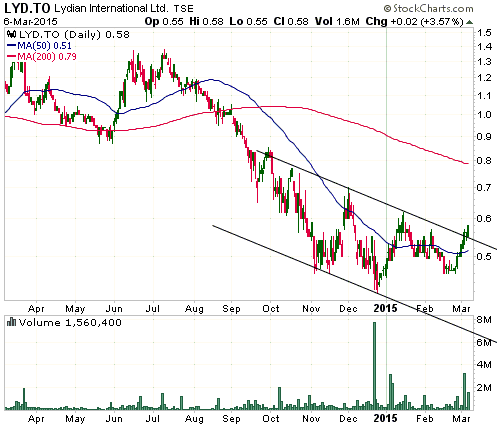
*Lydian International (LYD.TO), a former member of the TSI Stocks
List, warrants a mention in today's report due to its price action over the past
week. The price action (see chart below) is interesting because it was very much
at odds with the performance of the overall sector and was not the result of
company-specific news. Why was LYD, an exploration-stage miner with a
sub-economic (at the current gold price) gold deposit in Armenia, being
accumulated in a down market last week? We don't know. It could be that a
corporate deal (takeover or JV) is in the works. It could also be something as
simple and fundamentally irrelevant as the stock being mentioned favourably by a
widely-followed newsletter-writer, journalist or broker.
*Premier Gold (PG.TO) reported drilling results from its Rahill-Bonanza
(RB) gold project in Ontario, a JV with Goldcorp (PG owns 49% of the project).
The results indicated some potential, but weren't anything to write home about.
The best intercept was 15.79 g/t Au over 2.13m.
PG also advised that it will be conducting a major exploration program this year
at its newly acquired Hasaga gold project in Ontario. The program is expected to
include up to 30,000m of drilling.
*Pilot Gold (PLG.TO) provided an update on the progress of
exploration at its Kinsley Mountain gold project (79% PLG, 21% NEV.V) in Nevada.
A recent hole drilled between the Western Flank high-grade gold zone and the
historic pits in the Kinsley Trend provided the first confirmation that
high-grade mineralization is present between the two mineralized zones. The
relevant intercept was 6.15 g/t gold over 7.6m.
The 2015 exploration program at Kinsley is currently budgeted at a modest $2M
and is planned to involve only 11,000m of drilling, but PLG said that the
exploration work will be iterative and that the program will be continually
evaluated in light of data from each drill hole. This suggests that the plan
could change and the budget could increase depending on drilling results
achieved.
Kinsley Mountain continues to have great potential.
*Pretium Resources (PVG) issued its financial statements for the
quarter and year ending 31st December 2014. It also updated the market on its
progress.
The financial statements indicated that PVG had C$33M of working capital at the
end of last year. Allowing for subsequent spending and a large equity financing,
we estimate that the company now has about C$120M of working capital. This is
more than enough to get it to the point where it makes a construction decision
for the Brucejack gold project.
A decision to proceed with the construction of a mine can't happen until PVG
receives the necessary environmental permits. If all goes according to plan, the
permits will be issued within the next two months. We expect that this aspect of
the project will go according to plan, but permitting will remain a risk until
the permits are in hand.
If PVG is going to be taken over by a major or mid-tier mining company it will
probably happen after the environmental permits are issued and before the money
needed to finance the $747M initial capex is raised. We are not optimistic that
a takeover will happen this year, but it's a realistic possibility.
Based on the June-2014 FS for the Brucejack project, PVG offers very good value
near its current stock price of US$5.41. However, the price will probably have
to fall to US$5.00 or lower for PVG to be among our top five candidates for new
buying.
*True Gold Mining (TGM.V) issued a press release summarising the
current state of play at its Karma gold project in Burkina Faso, where
construction was suspended in mid-January in response to a violent protest. Here
are our main takeaways from the press release:
1) TGM expects to be 10 months from the first gold pour once construction
activities fully resume. This means that if construction were to fully resume by
the end of April then the first gold pour would be expected to occur next
February, which would be about three months behind the original schedule.
2) The financial extent of property damage caused during the protest is
estimated to be about $6M, about $2M of which will be covered by insurance. This
means that TGM will incur a cost of about $4M to fix the damage.
3) The company implemented a "technical shutdown" to minimise capital
expenditures until construction can resume. During this shutdown the company is
providing financial assistance to its employees, thus paving the way for
operations to be quickly re-started.
4) The Karma project has the support of the federal government.
5) Negotiations with local leaders and other stakeholders are proceeding in a
generally positive way, but the date for resuming construction is still not
known.
TGM will not be a good candidate for new buying until the issues that led to the
work suspension are put to bed and the date for the resumption of construction
is known.
 Note regarding new buying of gold stocks
With the HUI having broken below its 50-day MA as recently as last
Wednesday and support at 180 as recently as last Friday, it's
important not to be aggressive with new buying. An upward reversal
could occur within the next couple of trading days, but there could
also be significant follow-through to the downside over the days
immediately ahead.
Listed below are the stocks that we think are the best candidates
for new buying at or near current prices, but note that if there is
significant sector-wide follow-through to the downside then better
buying opportunities could arise elsewhere. In particular, be on the
lookout for opportunities to buy Dalradian Resources (DNA.TO) in the
low-C$0.80s, McEwen Mining (MUX) in the low-US$0.90s, Premier Gold (PG.TO)
in the C$2.00-$2.20 range and Pretium Resources (PVG) at around
US$4.80.
 List of candidates for new buying
From within the ranks of TSI stock selections the best candidates
for new buying at this time, listed in alphabetical order, are:
1) AAU (last Friday's closing price: US$0.97).
2) AKG (last Friday's closing price: US$1.41).
3) EDV.TO (last Friday's closing price: C$0.59).
4) EVN.AX in the low-A$0.80s (last Friday's closing price: A$0.86).
5) TGD (last Friday's closing price: US$0.79).
Note that the above list is limited to five stocks. It will
sometimes contain less than five, but it will never contain more
than five regardless of how many stocks are attractively priced for
new buying.
Chart Sources
Charts appearing in today's commentary
are courtesy of:
http://stockcharts.com/index.html
http://research.stlouisfed.org/

|

